Dynamic characteristics of very-high-rate GPS observations for seismology
Takuji Ebinuma1and Teruyuki Kato2
1Department of Aeronautics and Astronautics, University of Tokyo, Japan 2Earthquake Research Institute, University of Tokyo, Japan
(Received April 24, 2011; Revised October 17, 2011; Accepted November 17, 2011; Online published June 28, 2012)
GPS observations with higher than once-per-second sampling are becoming increasingly important for seis-mology. A number of reports have shown that very-high-rate GPS receivers are capable of capturing dynamic ground displacements from significant earthquakes. The higher output rate, however, does not necessarily mean higher frequency content of the corresponding observations. In order to examine dynamic effects on very-high-rate GPS observations, the frequency response characteristics of several geodetic GPS receivers were evaluated using a GPS signal simulator in controlled laboratory conditions. The tested receivers include Trimble Net-R8, NovAtel OEMV, and TOPCON Net-G3A. The experiment results suggest that the dynamic characteristics of the signal tracking loops put a limit on the frequency of the received signals, and all the tested receivers except for Trimble show good signal tracking performance at up to 5 Hz under dynamic stress of 2 G acceleration. The power spectral densities of the kinematic solutions obtained from the simulated seismic motion of the 2008 Iwate-Miyagi Inland earthquake (Mw6.8) are also evaluated. The power spectral densities of both the NovAtel and TOPCON receivers agree with the simulated ground displacement at up to 5 Hz. By contrast, the Trimble receiver provides a pronounced increase in spectral energy above 2 Hz.
Key words:GPS, seismology, earthquake, loop filter, bandwidth.
1.
Introduction
The Global Positioning System (GPS) observations have been widely used in geodetic studies over the past several decades to monitor crustal deformations with precision of the order of millimeters. In the early days of GPS geodesy, scientists analyzed time series of daily positions of GPS net-work stations obtained from the GPS data recorded at 30 s or longer, time intervals. These low-rate position solutions can give an accurate picture of long-period Earth deforma-tions such as plate modeforma-tions, but much higher observation rates are required to monitor short-period ground motions caused by earthquakes.
In recent years, 1-Hz GPS observations have been used to determine the short-period surface displacements and suc-cessfully measured seismic motions induced by the 2002 Denali fault earthquake (Larson et al., 2003; Bock et al., 2004; Bilichet al., 2008), the 2003 Tokachi-oki earthquake (Koyama et al., 2004; Miyazaki et al., 2004), the 2004 Sumatra-Andaman earthquake (Ohtaet al., 2006), and the 2008 Wenchuan earthquake (Shiet al., 2010).
However, Smalley (2009) showed that 1-Hz GPS obser-vations of strong seismic motions were aliased and could not produce a valid temporal history of displacement. For strong seismic events, 5-Hz GPS observations may also be aliased. Sampling rates higher than that required by the fre-quency content of the seismic motion provide additional in-formation that can be used to improve the quality of the final
Copyright cThe Society of Geomagnetism and Earth, Planetary and Space Sci-ences (SGEPSS); The Seismological Society of Japan; The Volcanological Society of Japan; The Geodetic Society of Japan; The Japanese Society for Planetary Sci-ences; TERRAPUB.
doi:10.5047/eps.2011.11.005
displacement time series.
Modern receiver technology now enables sampling of GPS observations at very high sampling rates of 10 to 50 Hz, or even higher. The higher sampling rate, however, does not necessarily mean higher frequency content of the corresponding observations. The dynamic characteristics of the GPS observations at high-frequency regions will even-tually be limited by the bandwidth of the signal tracking loops. The typical bandwidth of the carrier phase tracking loop is about 20 Hz, which is much less than the 50-Hz sam-pling rate of recent very-high-rate GPS receivers. Since the signal tracking loop works like a low-pass filter, any high frequency motion over the bandwidth is attenuated and no meaningful dynamical information is added to the observa-tions. Even worse, the dynamic characteristics of the signal tracking loops may cause undesirable range errors under a high-frequency and high-acceleration environment.
Genrich and Bock (2006) evaluated noise characteristics of the GPS observations at a sampling rate of 10–50 Hz obtained from GPS stations in southern California. How-ever, the GPS observations were taken under a static en-vironment, and the results may not properly represent the receiver response under high dynamic stress. Some re-searchers evaluated dynamical characteristics by using vi-bration tables to emulate ground motions (Geet al., 2000; Eloseguiet al., 2006). The field tests using the vibration ta-bles, however, hardly provide a repeatable test environment due to the variation of satellite geometry and multipath sig-nals caused by surrounding objects.
In this study, a GPS signal simulator was used for the first time to characterize the dynamical performance of modern geodetic GPS receivers with a sampling rate of 50 Hz,
cluding Trimble Net-R8, NovAtel OEMV, and TOPCON Net-G3A. The GPS simulator is basically an RF (radio frequency) signal generator capable of transmitting realis-tic GPS signals. Since the GPS signal simulator is a pure electronic system, it is capable of providing much higher dynamical performance than the mechanical simulators. It also allows great repeatability in a user-defined test environ-ment. The dynamical characteristics of those very-high-rate GPS receivers were evaluated from frequencies responses against known sinusoidal antenna motions generated by the simulator. Since the signal tracking loop is basically a lin-ear system, the amplitude gain and the phase delay of the kinematic solutions characterize the dynamical response of the receiver system.
The actual seismic motion is not a simple sinusoidal wave but composed of a wide spectrum of frequencies. In gen-eral, the seismic energy decreases toward higher frequency, and the corner frequency is around several to tens of Hz de-pending on the earthquake magnitude. In order to simulate a real ground motion, a time series of surface displacements during the 2008 Iwate-Miyagi Inland earthquake was recon-structed from the recorded acceleration data and used as a user-defined motion data for the GPS signal simulator. The power spectral densities of the kinematic solutions and po-sition errors obtained from the very-high-rate GPS observa-tions were evaluated to determine the receiver response to the real seismic event.
In order to clarify the relationship between the internal signal processing and the dynamic response of the GPS ob-servations, the following sections will start with a general description on signal tracking loops and their design crite-ria. The dynamic characteristics of the very-high-rate GPS receivers will then be discussed based on the experimental results of their frequency and spectral responses.
2.
Signal Tracking Loops
GPS signal tracking is achieved by operating a numerically-controlled oscillator (NCO) to generate an in-ternal replica signal, Y(s), matching the received signal, X(s). The objective of the loop filter, F(s), is to produce an accurate estimate of the original signal, and the NCO generates the replica signal based on the output from the loop filter. As shown in Fig. 1, the replica signal is then ef-fectively subtracted from the original signal by a so-called discriminator to produce an error signal,E(s), which is fed back into the filter input in a closed loop process.
The loop filter works like a low-pass filter, and its re-sponse to signal dynamics is determined by the filter order and bandwidth. In order to reduce the noise in the filter output, the bandwidth (or the cut-off frequency for a low-pass filter) has to be narrower (or lower) to attenuate high-frequency components in the filter input. In return for the noise reduction, the dynamic range of the loop filter be-comes lower as the bandwidth gets narrower. The filter out-put also suffers from the steady-state error if the order of the input signal dynamics is equal to, or higher than, the filter order. For example, the first, second, and third order loops are sensitive to velocity, acceleration, and jerk stress in the filter input, respectively.
The performance of the signal tracking loop depends on
Fig. 1. System block diagram of the typical GPS signal tracking loop. The loop filter produces an accurate estimate of the original signal, and the NCO generates the replica signal based on the output from the loop filter. The dynamical performance of the tracking loop is governed by the order and bandwidth of the loop filter.
the dynamics of the received signal, and the goal of the fil-ter design is to optimize the order and bandwidth to elimi-nate error signal effectively under a certain dynamic stress. Many geodetic GPS receivers are designed for low dynamic applications, such as a static survey, and may not work properly under a high dynamic environment like a strong seismic event. Moreover, each receiver manufacturer im-plements extra signal-processing functions, such as multi-path reduction, to make their observations much cleaner, and the resulting loop filter is no longer a linear system. Some of the vendors have made part of basic loop pa-rameters configurable by the users, but, in general, they are unwilling to disclose more details about their signal-processing algorithms and how the measurements are actu-ally made.
In order to quantify the dynamic characteristics of this “black box” system, the effect of the internal signal pro-cessing was evaluated with a frequency response. The fre-quency response is often used to indicate the effect of an unknown linear system in response to a known input sig-nal and can be measured by sweeping a pure tone input through the frequency range of interest or applying a signal with a wide frequency spectrum. In this study, those test signals were generated by the GPS signal simulator using a sinusoidal motion or actual seismic displacements. The fre-quency response of the receiver will then be characterized by the amplitude and the phase of the kinematic solutions obtained from the GPS observations.
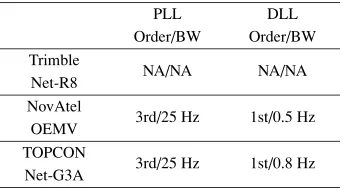
Table 1. Order and bandwidth (BW) of signal tracking loops. The PLL order and bandwidth of the NovAtel and TOPCON receivers are configurable by the user. Trimble did not disclose those parameters.
PLL DLL
Both the Novatel OEMV and TOPCON Net-G3A re-ceivers utilize the third-order PLL for carrier signal track-ing. The PLL thermal noise is often treated as the only source of carrier phase measurement error for a static sur-vey since the signal dynamics caused by the GPS satellite motion is negligible. The standard deviation,σ, of the PLL thermal noise is computed as follows:
σ = λ
whereBis the PLL bandwidth,C/N0is the carrier-to-noise ratio, andT is the pre-detection integration time, which is typically 20 milliseconds. For a given C/N0, it is clear that the thermal noise is smaller when the bandwidth is nar-rower. Note that the thermal noise is not directly dependent on the filter order.
Since the loop filter is sensitive to the same order of dy-namics, the third-order PLL can track angular acceleration but is sensitive to jerk stress. The steady-state phase error,
e, in response to a constant jerk input is given by
e= 1
whereφis the carrier phase measurement,λis the carrier wavelength (= 0.19 m for GPS L1-band signal), andr is the range measurement between the receiver antenna and the GPS satellite. ωn is the natural frequency of the loop
filter, and the loop bandwidth can be expressed as follows:
B=0.7845ωn. (3)
For a given jerk stress, it is clear that the dynamic stress error is larger when the bandwidth is smaller. In order to ex-tend the dynamical limit of the receiver, a wider bandwidth has to be chosen. In this case, the observations are degraded by a higher noise level in return. Thus, there is a trade-off between noise performance and dynamic response, and the loop bandwidth has to be selected carefully for dynamical applications.
As shown in Fig. 1, the difference between the received and replica signals is yielded by the discriminator. For the typical PLL design, the loop bandwidth (or the correspond-ing natural frequency) must be selected to limit the steady-state phase offset under 1/8 cycle (=45◦) to make the dis-criminator work properly. This means the following
equa-tion must be satisfied:
For example, for the given loop bandwidth of 25 Hz in Table 1, the PLL could accommodate a peak jerk stress of about 78 G/s without losing carrier signal tracking. As mentioned earlier, the actual PLL inside the receiver is not strictly a linear system, and the peak jerk stress obtained from Eq. (4) may not guarantee the dynamic response of the receiver. The maximum dynamic stress error could also be larger than the steady-state error given by Eq. (1) if the filter response has overshot. However, the dynamic response of the loop filter is still dominated by the linear system and characterized by the order and the bandwidth. Thus, the upper limit of the jerk stress expected from Eq. (4) gives a good guideline to the later discussions on the frequency response. More detailed discussions on the GPS signal tracking loop design can be found in Ward (1996).
3.
Data Acquisition and Analysis
3.1 GPS signal simulatorIn order to measure the dynamic response of the very-high-rate GPS receiver, the antenna motion is used as a test signal input to the unknown system and its true position must be known. Moreover, a controlled and repeatable test environment is required to compare the dynamical proper-ties of different GPS receivers.
In this study, the true antenna motion was generated by the GSS8000 GPS signal simulator of Spirent. The GPS simulator is basically an RF signal generator that can re-produce the same kinds of signals transmitted by the GPS satellites, so the receiver can process the simulated signals in exactly the same way as those from the actual GPS satel-lites. Unlike live GPS signals, the simulator provides full control over user antenna motion and environmental condi-tions. The Spirent GSS8000 is also designed for use in the most demanding applications and supports up to 20,000 G acceleration and 120,000 m/s velocity.
The GPS signal simulator was connected directly to the test receiver through a coaxial cable to eliminate any en-vironmental error sources, such as multipath signals. The simulated atmospheric delays and satellite position uncer-tainties were also disabled. The resulting observation errors contain, ideally, the thermal noise and dynamic stress er-rors.
In order to minimize the effect of the baseline length, the GPS observations were taken under zero-baseline scenar-ios, in which the user antenna was virtually collocated with the reference antenna. Furthermore, the reference antenna remained stationary even when the user antenna was vibrat-ing to simulate the seismic motion. It should be noted that the GSS8000 GPS signal simulator used in this study was capable of generating only the L1 C/A signal for each satel-lite. The typical field survey requires both the L1 and L2 measurements to eliminate the different ionospheric delay errors experienced at the separated locations. In the zero-baseline setup, kinematic solutions can be calculated effi-ciently from L1 observations alone because the ionospheric delay and any other geometric-dependent errors are com-pletely removed by taking differential measurements.
It should be noted that this simulation represents a highly-idealized environment to evaluate the most achiev-able signal tracking performance of the very-high-rate GPS receivers. There are wide ranges of issues that are experi-enced in practice (Genrich and Bock, 2006).
3.2 Kinematic positioning
The post-processed kinematic solutions were obtained by RTKLIB, which is open source real-time kinematic (RTK) positioning software developed by Tomoji Takasu and freely available from http://www.rtklib.com/. The RTKLIB calculates kinematic solutions from double-differenced carrier phase measurements and utilizes the well-known LAMBDA method to resolve integer ambigui-ties (Teunissen, 1995). The ratio test is then applied to val-idate the candval-idate solutions and select the best (or fixed) integer ambiguity (Wanget al., 2000). The RTKLIB also utilizes a Kalman filter to compute the kinematic solutions, and users can change some of the filter parameters to op-timize its performance. Although some might work better with different settings, all the GPS observations were an-alyzed with the same filter setups hereafter. The version of RTKLIB used in this study is 2.4.1, and no backward smoothing was applied to the kinematic processing.
4.
Frequency Response
One of the important characteristics of linear systems is how they behave with sinusoids. If the input to a linear sys-tem is a sinusoidal wave, the output will also be a sinusoidal wave having exactly the same frequency as the input. Only the amplitude and the phase will change. Linear systems are additive, that means the net response caused by two or more inputs is the sum of the response which would have been caused by each input individually. So, if one knows the am-plitude and the phase of response for sinusoidal waves at all possible frequencies, then one can predict how the system will respond to any possible input signals.
4.1 Dynamics of input signals
The frequency response is typically characterized by the amplitude and the phase of the system response, which can be measured by sweeping sinusoidal waves through the bandwidth of interest. In this experiment, a set of sinu-soidal antenna motions in the local vertical direction was generated by the GPS signal simulator as the input signals to the tested receiver. The kinematic solutions were calcu-lated from the GPS observations for each test signal input
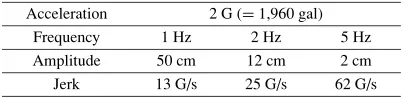
Table 2. Amplitude and jerk of input sine wave for frequency response analysis. The maximum acceleration was set to 2 G to simulate a strong earthquake. The amplitude must be smaller for a higher-frequency input in order to maintain the constant acceleration stress.
Acceleration 2 G (=1,960 gal)
Frequency 1 Hz 2 Hz 5 Hz
Amplitude 50 cm 12 cm 2 cm
Jerk 13 G/s 25 G/s 62 G/s
individually, and the frequency response of the receiver was obtained directly from the amplitude and phase difference between the kinematic solutions and the true antenna mo-tion.
For a given angular frequency,ω, the time-dependent an-tenna position,y, and the corresponding velocity, accelera-tion, and jerk can be expressed as follows:
⎧
wherehis the amplitude of the input antenna position and selected to yield the maximum acceleration,d2y/dt2, ex-perienced in a real seismic event for a givenω. In this study, the maximum acceleration was set to 2 G (=1,960 gal) to simulate a strong earthquake. Table 2 summarizes the am-plitude and jerk settings for each test signal frequency.
It is apparent that the amplitude must be set smaller for a higher frequency input in order to maintain the constant acceleration stress, and it becomes smaller than 1 cm at a frequency higher than 5 Hz. Since the resulting kinematic solutions tend to be buried under the thermal noise, the frequency response was evaluated through a frequency of up to 5 Hz. Moreover, the jerk stress becomes higher for a higher frequency input. Recall the earlier discussion on the steady-state error for the PLL. Since the jerk value of the maximum 5-Hz input signal frequency is still smaller than the peak jerk stress obtained from Eq. (4), the PLL should work properly without losing carrier phase tracking under the signal dynamics defined in Table 2.
Figure 2 illustrates the skyplot of the visible GPS satel-lites during the simulation. The GPS satellite SV06 was intentionally allocated at the zenith to experience the maxi-mum dynamic stress against the vertical sinusoidal antenna motion defined in Table 2.
Tentatively, the receiver response to an antenna motion with the maximum acceleration of higher than 2 G was also tested. Disappointingly, none of the three receivers was able to keep tracking the GPS signals from SV06 satellite re-gardless of the frequency and jerk of the antenna motion. Of course, there is a sufficient number of visible satellites even if the receiver loses a single satellite signal, and the kinematic position solutions are still available with a less favorable satellite geometry. However, the signal lock sta-tus of SV06 is our keen interest here in order to evaluate the most achievable signal tracking performance under dy-namic stress.
Fig. 2. Skyplot of visible GPS satellites during the simulation. The GPS satellite SV06 was intentionally allocated at the zenith to experience the maximum dynamic stress against the vertical antenna motion.
acceleration sensitivity is considered to be caused by the lowness of the DLL order. Both the NovAtel and TOPCON receivers utilize the first-order DLL, which is sensitive to velocity or higher-order dynamic stress. Unfortunately, nei-ther receiver allows users to change the DLL order. The optimization of signal tracking loops for high dynamic ap-plications requires full access to the internal signal process-ing, which is not available with any commercial receivers. Although it is beyond the scope of this paper, the software receiver (also known as software-defined radio) approach could be an alternative to less reconfigurable traditional re-ceivers (Borreet al., 2007).
4.2 Output waveforms
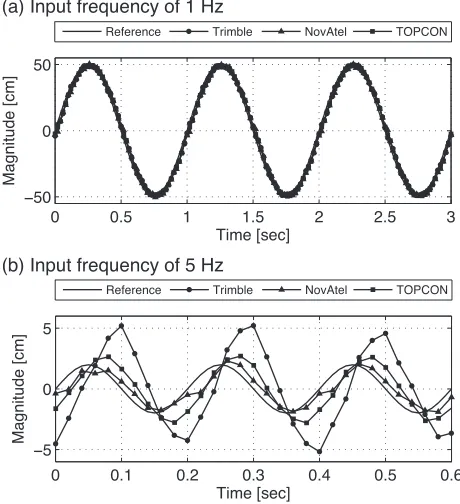
Figure 3 shows the kinematic solutions in the local verti-cal direction for each receiver in response to the 1-Hz and 5-Hz sinusoidal antenna motions. Although a little phase delay was observed, all the receivers could track the 1-Hz test signal nicely. On the other hand, receiver response suf-fered from large amplitude gain and phase delay for the 5-Hz input. The Trimble Net-R8 showed the largest over-shoot in amplitude, which was twice as large as the original. It should be noted that the carrier phase observations were obtained at each epoch without a single cycle slip, and all the kinematic solutions were calculated with fixed integer ambiguities.
In order to evaluate the amplitude and the phase of each receiver response, the optimal sinusoidal waveform was es-timated with the least squares method. Assume the output wave can be modeled as follows:
y+δy=(h+δh)sin(ωt+δφ)+, (6)
whereδyis the observation error,δh andδφare deviations in the amplitude and phase, respectively, andis the resid-ual. For each epoch,ti, Eq. (6) can be linearized as follows:
δyi =giδx+i, (7)
where the observation matrixgi and the state vectorδxare
Fig. 3. Receiver response to sinusoidal antenna motion. The amplitude is smaller for the 5-Hz input in order to maintain the constant acceleration stress defined in Table 2. All the receivers track the 1-Hz signal nicely. By contrast, the receiver response suffered from large amplitude and phase delay for the 5-Hz input.
defined by:
ForN-point kinematic solutions, the following matrix equa-tion can be formulated:
Finally, the optimal state vector, δxˆ, which minimizes the squared-sum of the residual vector,eTe, is obtained from:
δxˆ =GTG−1GTδy. (11)
4.3 Amplitude gain and phase shift
Table 3. Amplitude gain and phase delay of kinematic solutions with respect to the input sinusoidal waveforms.
Trimble NovAtel TOPCON
Net-R8 OEMV Net-G3A
1 Hz (h+δh)/h 0.99 0.99 1.00
δφ −4.3◦ −5.4◦ −4.7◦
2 Hz (h+δh)/h 1.15 0.98 1.05
δφ −23.4◦ −10.1◦ −8.6◦
5 Hz (h+δh)/h 2.25 1.05 1.31
δφ −74.1◦ −24.8◦ −43.2◦
As shown in Fig. 3, high-frequency antenna motion is still detectable by each receiver up to 5 Hz but provides a larger amplitude reading, which leads to an erroneous estimation of seismic energy release at the corresponding frequency region. This trend is distinct for Trimble Net-R8, and it may require special care to process very-high-rate observations obtained from Trimble receivers.
Although NovAtel OEMV showed the smallest ampli-tude and phase errors among the three, TOPCON Net-G3A provided a much smoother output waveform as shown in Fig. 3(a) and achieved comparable receiver response at a frequency of up to 2 Hz. Among the three tested receivers, TOPCON Net-3GA is recommended for seismic monitor-ing from the point of view of both the frequency response and the smoothness of the output waveform.
5.
Iwate-Miyagi Inland Earthquake
The results of the frequency-response experiments re-vealed that the dynamic characteristics of the signal track-ing loops put a limit on the frequency and the acceleration of the received signals, and it would be quite difficult to track the ground motion with greater than a few Hz in fre-quency and 2 G in acceleration without any degradation in kinematic solutions. For real seismic events, however, it is impractical to assume such a high acceleration motion continuously for a long period of time. The actual seismic motion is not a simple sinusoidal wave but composed of a wide spectrum of frequencies. In general, the seismic en-ergy decreases toward a higher frequency.
In order to determine the receiver response to the real seismic motion, a time series of displacements during the 2008 Iwate-Miyagi Inland earthquake was reconstructed from the recorded acceleration data and used as a user-defined motion data for the GPS signal simulator.
5.1 Ground displacements
Figure 4 shows the vertical component of the recorded acceleration at the AKTH04 KiK-net station during the Iwate-Miyagi Inland earthquake. The AKTH04 was located about 20 km northwest of the epicenter and recorded a max-imum vertical acceleration of higher than 1 G. Figure 5 illustrates the time series of ground displacements recon-structed from the recorded acceleration data, and the corre-sponding power spectral density (PSD) of the vertical com-ponent is shown in Fig. 6. It is evident that the PSD follows a power low, and the spectral index corresponding to the slope of the best-fitting line is about 1.8. This line will be used as the reference PSD for those obtained from
kine-Fig. 4. Recorded acceleration in an up-down direction at AKTH04 KiK-net station during the Iwate-Miyagi Inland earthquake. Since the maximum acceleration is smaller than 2 G, all the three tested receivers are able to provide kinematic solutions without losing any signal lock.
Fig. 5. Simulated ground displacement at AKTH04. The time series of ground displacements was calculated from the recorded acceleration data and will be used as a reference input to the GPS signal simulator.
Fig. 6. Power spectral density of vertical displacement at AKTH04 (gray). The best-fitted line (black) will be used as a reference PSD for those obtained from kinematic solutions of the three tested receivers.
matic solutions of the three tested receivers in the later dis-cussion.
5.2 Kinematic solutions
Net-Fig. 7. Example of a kinematic positioning result. Each dot indicates a kinematic position solution of the reference ground motion (solid line) at a corresponding sampling time. The kinematic solutions show pro-nounced overshoot during a high-frequency motion around 25 second.
Table 4. Summary of mean and standard deviation of vertical position errors (unit: mm) during static (0–16 sec) and dynamic (16–30 sec) periods shown in Fig. 8.
Trimble NovAtel TOPCON
Net-R8 OEMV Net-G3A
Mean/Std Mean/Std Mean/Std U-D Static +0.1/2.9 −0.1/2.5 −0.0/1.7 Dynamic +0.2/6.7 +0.0/3.2 +0.0/2.5 E-W Static +0.0/1.7 −0.1/1.6 −0.0/1.1 Dynamic +0.0/4.8 −0.1/2.0 +0.0/1.8 N-S Static +0.0/1.1 −0.0/1.2 −0.0/0.7 Dynamic −0.1/3.2 −0.0/1.4 −0.0/1.3
G3A show a slight increase in position errors during the dynamic period, but it is less than one millimeter and could be negligible. The position errors of TOPCON Net-G3A also appear less noisy than those of NovAtel OEMV.
It should be noted that the position errors are obtained in a highly-idealized simulation environment in order to evaluate the most achievable signal tracking performance of very-high-rate GPS receivers. There are a wide ranges of issues that degrade the final positioning accuracy in prac-tice, such as atmospheric errors and multipath.
5.3 Power spectral density
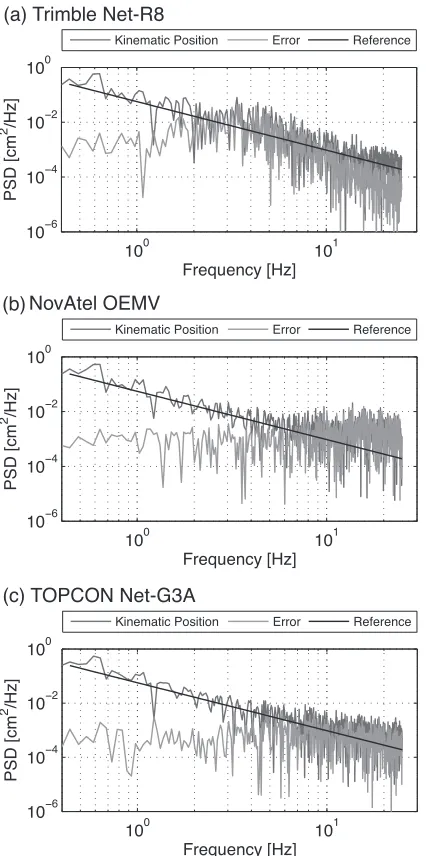
As shown in Fig. 8, the amplitude of the kinematic solu-tions tends to increase during a seismic event. This might lead to an erroneous estimation of the seismic energy for a certain frequency band and wrongful modeling of the corre-sponding rupture process. In order to evaluate the receiver response in the frequency domain, the PSD plots of the kinematic solutions and the corresponding position errors in a vertical component were calculated and compared to the best-fitting PSD line of the true antenna motion shown in Fig. 6.
Figure 9 shows the PSD comparison result of each re-ceiver. Similar to the frequency response result, the kine-matic solution PSD agrees with the true antenna motion PSD for a frequency of lower than 1 Hz, and the corre-sponding position error PSD has a spectral index of about 0, which indicates white noise. On the other hand, each receiver shows a different spectrum for a frequency higher than 1 Hz. The increase in spectral energy for the frequency band 2–5 Hz is pronounced for Trimble Net-R8. This trend is peculiar to Trimble Net-R8 and considered to be caused
Fig. 8. Kinematic position errors in an up-down direction obtained from the AKTH04 simulation. The ground motion starts at 16 second and lasts until 30 second of simulation time.
by the PLL dynamics, which produced a large overshoot for the same frequency band in the frequency response ex-periment. The decline of the kinematic solution PSD slope of NovAtel OEMV is leveled and buried under the noise PSD at a frequency of about 5 Hz. The TOPCON Net-G3A curves are of similar shape to those of NovAtel OEMV but show less high-frequency noise.
Similar to the frequency response results, TOPCON Net-G3A shows the most preferable performance of the three receivers to track the real seismic motion.
6.
Conclusions
Unlike the wider frequency range of the traditional seis-mic accelerometers, the frequency range and the corre-sponding sensitivity of GPS observations are characterized by the dynamics of the internal signal tracking loops. Re-cent earthquake recordings from high-rate GPS receivers having a 1-Hz sampling rate indicate that an even higher temporal resolution is desirable. Modern GPS receivers are capable of providing very high sampling rates of 10 to 50 Hz, or even higher. The higher sampling rate, however, doesn’t necessarily mean a higher frequency range of the corresponding observations. The dynamic characteristics of the GPS observations at high frequency will eventually be limited by the bandwidth of the signal tracking loops.
very-Fig. 9. PSD plots of kinematic solutions (dark gray) and position errors (light gray) compared with the reference PSD (black) obtained in Fig. 6.
high-rate geodetic GPS receivers from three major manu-facturers were investigated at a sampling rate of 50 Hz. The dynamic response to a high frequency and high acceleration seismic motion of each receiver was characterized by the frequency response of the kinematic solutions to the pure sinusoidal antenna motions in the frequency range of inter-est and the reconstructed seismic motion of the 2008 Iwate-Miyagi Inland earthquake. A high-end GPS signal simu-lator was used to generate such high dynamic signals in a controlled laboratory environment. The difference between the kinematic solutions inferred from GPS observations and the known true antenna motion yielded directly the dynamic characteristics of each receiver.
The results showed that all the receivers could track the antenna motions nicely at frequencies below 1 Hz with very little amplitude and phase differences, and the resulting po-sition errors were essentially white noise. On the other hand, each receiver showed a different frequency response at the higher frequency band. Trimble Net-R8 exhibited a
pronounced increase in spectral energy for the frequency band of 2–5 Hz, and the amplitude of the frequency re-sponse to the 5-Hz sinusoidal motion was twice as large as the original. The position error PSD of NovAtel OEMV is nearly flat up to 5 Hz, and that indicates the position error is white noise and the corresponding kinematic so-lutions contain no systematic error due to dynamic stress. The kinematic solution PSD of TOPCON Net-G3A is simi-lar to that of NovAtel OEMV but shows less high-frequency noise above 5 Hz. Taking into account these results of the three tested receivers, TOPCON Net-3GA is more highly recommended for seismic monitoring.
At frequencies above 1 Hz, each receiver has a unique signature of its spectral response. Since this might lead to an erroneous estimation of the seismic energy for a cer-tain frequency band, the very-high-rate GPS observations recorded during a seismic event must be treated carefully. The frequency response and the power spectral density of each receiver is hardware dependent and could be used to calibrate the dynamic characteristics of the recorded GPS observations. This would be essential when analyzing the baselines among different receiver models in a GPS net-work. The development of a calibration algorithm will be considered in future work.
Acknowledgments. The authors acknowledge the National
Re-search Institute for Earth Science and Disaster Prevention (NIED), Japan, for the use of the Iwate-Miyagi Inland earthquake data. We thank Yusuke Yokota, a doctoral student at the Earthquake Re-search Institute, University of Tokyo, who generated the surface displacement data for the GPS signal simulator. We are grateful to Hitachi Zosen Co., Amtechs Co., and TOPCON Co. for providing very-high-rate GPS receivers.
References
Bilich, A., J. F. Cassidy, and K. M. Larson, GPS Seismology: Application to the 2002 Mw 7.9 Denali Fault Earthquake,Bull. Seismol. Soc. Am., 98(2), 593–606, 2008.
Bock, Y., L. Prawirodirdjo, and T. I. Melbourne, Detection of arbitrarily large dynamic ground motions with a dense high-rate GPS network,
Geophys. Res. Lett.,31, L06604, 2004.
Borre, K., D. M. Akos, N. Bertelsen, P. Rinder, and S. H. Jensen,A Software-Defined GPS and Galileo Receiver: A Single-Frequency Ap-proach, 176 pp, Birkhauser Boston, Cambridge, MA, 2007.
Elosegui, P., J. L. Davis, D. Oberlander, R. Baena, and G. Ekstrom, Accu-racy of high-rate GPS for seismology,Geophys. Res. Lett.,33, L11308, 2006.
Ge, L., S. Han, C. Rizos, Y. Ishikawa, M. Hoshiba, Y. Yoshida, M. Izawa, N. Hashimoto, and S. Himori, GPS seismometers with up to 20 Hz sampling rate,Earth Planets Space,52, 881–884, 2000.
Genrich, J. F. and Y. Bock, Instantaneous geodetic positioning with 10-50 Hz GPS measurements: Noise characteristics and implications for monitoring networks,J. Geophys. Res.,111, B03403, 2006.
Koyama, J., N. V. Shestakov, and R. Honda, Strong ground motion recorded by high-rate sampling GPS at the closest site to the 2003 Tokachi-oki earthquake,Earth Planets Space,56, 383–387, 2004. Larson, K. M., P. Bondi, and J. Gomberg, Using 1-Hz GPS data to measure
deformations caused by the Denali Fault Earthquake,Science,30, 1421– 1424, 2003.
Miyazaki, S., K. M. Larson, K. Choi, K. Hikima, K. Koketsu, P. Bodin, J. Haase, G. Emore, and A. Yamagiwa, Modeling the rupture process of the 2003 September 25 Tokachi-Oki (Hokkaido) earthquake using 1-Hz GPS data,Geophys. Res. Lett.,31, L21603, 2004.
Ohta, Y., I. Meilano, T. Sagiya, F. Kimata, and K. Hirahara, Large sur-face wave of the 2004 Sumatra-Andaman earthquake captured by the very long baseline kinematic analysis of 1-Hz GPS data,Earth Planets Space,58, 153–157, 2006.
Seismic deformation of theMw8.0 Wenchuan earthquake from high-rate GPS observations,Adv. Space Res.,46, 228–235, 2010.
Smalley, R., Jr., High-rate GPS: How high do we need to go?,Seismol. Res. Lett.,80(6), 1054–1061, 2009.
Teunissen, P. J. G., The least-square ambiguity decorrelation adjustment: a method for fast GPS ambiguity estimation,J. Geod.,70, 65–82, 1995. Wang, J., M. P. Stewart, and M. Tsakiri, A comparative study of the integer
ambiguity validation procedures,Earth Planets Space,53, 813–817,
2000.
Ward, P., Satellite signal acquisition and tracking, inUnderstanding GPS: Principles and Applications, edited by Kaplan, E. D., 535 pp., Artech House, Norwood, MA, 1996.