R E S E A R C H
Open Access
Advanced spectrum sensing with parallel
processing based on software-defined radio
Wei Liu
*, Daan Pareit, Eli De Poorter and Ingrid Moerman
Abstract
Due to interference between co-located wireless networks, obtaining accurate channel assessment becomes increasingly important for wireless network configuration. This information is used, among others, for cognitive radio solutions and for intelligent channel selection in wireless networks. Solutions such as spectrum analyzers are capable of scanning a wide spectrum range, but are not dedicated for channel occupation assessment because they are extremely costly and not able to perform continuous recording for a time period longer than a few seconds. On the other hand, low-cost solutions lack the flexibility and required performance in terms of configuration and sensing efficiency. To remedy the situation, this paper presents an alternative for channel assessment on top of a commercial software-defined radio platform. Although there exist software solutions for performing spectrum sensing on such platforms, to the best of our knowledge, continuous spectrum sensing and long-term recording remain challenging. We propose a pioneering solution that is capable of seamless spectrum sensing over a wide spectrum band and guarantees sufficient flexibility in terms of configurations. The proposed solution is validated experimentally. We demonstrate two advantages of seamless spectrum sensing: the capability of accurate channel occupancy measurement and detecting transient signals such as Bluetooth.
1 Introduction
As the density of co-located wireless networks grows, wireless systems are more and more susceptible to mutual interference, leading to degraded network performance. At the same time, end users demand high quality of ser-vice from wireless networks. This conflict gains increased interest in both the industrial and the academic world, resulting in several research projects [1,2]. Cognitive radio (CR) is a promising technology for solving the above prob-lem. Originally, CR is a frequency-agile radio, capable of accessing licensed spectrum without influencing the pri-mary users [3]. The concept of CR can be extended for more efficient sharing of unlicensed band among hetero-geneous technologies.
The fundamental requirement for CR is the ability to correctly examine the spectrum usage. One approach is to register the primary user’s location and power coverage into a central database, which obviously does not apply
*Correspondence: [email protected]
Internet Based Communication Networks and Services (IBCN), Department of Information Technology, Ghent University - iMinds, Gaston Crommenlaan 8 Bus 201, Gent 9050, Belgium
for a dynamic environment. Another approach is to per-form channel assessment locally, allowing fast reaction to changes in the spectrum.
The localized spectrum sensing approach appears to be more appealing, thanks to its adaptivity to a changing spectrum environment. Most wireless devices have only one radio module. Therefore, it is common to interleave the channel assessment and data transmission activity. How to find the optimal sensing frequency is crucial to improve the system performance and hence becomes a popular research topic on itself [4,5]. However, it is not always convenient to limit transmission into prede-fined intervals. Sensing a broad spectrum range with lim-ited radio front-end capability and processing resources results in limited sensing performance.
An alternative is to add a few more advanced devices dedicated for sensing above the original network. Such devices are referred to assensing engines[6]. Apart from the CR context, sensing engines can help operators of wireless technology to better identify the location and characteristics of the interference. In addition, for wire-less researchers, an accurate sensing engine can provide a more detailed view on the physical layer. One use case
Liuet al. EURASIP Journal on Wireless Communications and Networking2013,2013:228 Page 2 of 15 http://jwcn.eurasipjournals.com/content/2013/1/228
could be a MAC layer researcher that needs to identify the interpacket interval or the duty cycle of a channel.
One of the most crucial aspects of the sensing engine is its efficiency because discontinuity in spectrum sensing often leads to inaccurate assessment and missed detec-tion of interference or primary usage. Spectrum sensing generally consists of two phases:
• The sampling phase, in which raw samples are collected from the air
• The processing phase, in which buffered samples are processed for spectrum analysis
Depending on the processing speed, the processing phase can partially or completely happen in parallel with the sampling phase. The time used for collecting samples from the air is referred to as the sampling time, while the time required by the processing phase in addition to the sampling time is referred to as the processing time. The sensing efficiency is then defined as the ratio of the sampling time and the summation of the sampling time and the processing time. During the processing time, the sampling of the wireless medium is put onto hold, which means that the sensing engine is ‘blind’. It is possible that a number of transient signals are missed during this period. The time interval when sampling activity is put onto hold is referred to as the blind time. Ideally, the blind time should be reduced to zero, meaning 100% sensing efficiency to achieve seamless detection.
There are various sensing devices on today’s market. Solutions such as spectrum analyzers are capable of scan-ning a wide spectrum range, but are not dedicated for channel assessment and extremely costly. For instance, a spectrum analyzer usually cannot do continuous record-ing for a time period longer than a few seconds, and the recorded spectrum needs to have high frequency resolution for visualization purposes. However, the raw spectrum information still requires further processing to obtain the energy for specified channels. On the other hand, low-cost solutions are trimmed for simple and steady recording but lack the flexibility and required per-formance. For instance, they are not able to achieve seam-less spectrum sensing and usually have nonconfigurable frequency span and resolution bandwidth.
The key requirements for channel assessment in the CR context are flexibility, reliability, and the capability of con-tinuous recording. Energy per channel with a timestamp is the desired output format; an excessively fine frequency resolution is generally not appreciated. To enable cooper-ative or distributed spectrum sensing, the measurement should be obtained with a relatively low-cost platform. Finally, from a developer’s point of view, the implemen-tation should be flexible and transparent in order to achieve fast prototyping and testing. After realizing the
gap between the capability of high-end spectrum analyz-ers and the need of cognitive radio researching, we decide to build an alternative - a simpler but more dedicated sensing engine.
In summary, to achieve an advanced wireless system, we need sensing engines with relatively low cost and that are capable of continuous sensing and recording. To this end, this paper presents a solution that is built upon a commercial software-defined radio (SDR) [7]. The solu-tion is further extended on multiple SDR devices for cooperative and distributed spectrum sensing. While the developed solution has less functionality than spectrum analyzers, it is also much cheaper and dedicated for chan-nel assessment. Above all, in contrast to most spectrum analyzers, our solution is capable of continuous sampling and recording.
The remaining part of the paper is organized as follows: first, we present an overview of the most common sens-ing devices today; next, we describe how we arrive at our solution and its advantages; and finally, the detailed soft-ware structure and configurations of the sensing softsoft-ware are presented. The proposed solution is verified experi-mentally, with real-life wireless signals, such as Wi-Fi and Bluetooth.
2 Analysis of existing platforms
This section presents some of the most representative sensing solutions, starting from powerful but expensive spectrum analyzers to simple off-the-shelf sensor devices. The processing mechanism of high-end spectrum analyz-ers is discussed in depth, as it is needed for the further sections.
2.1 Spectrum analyzers
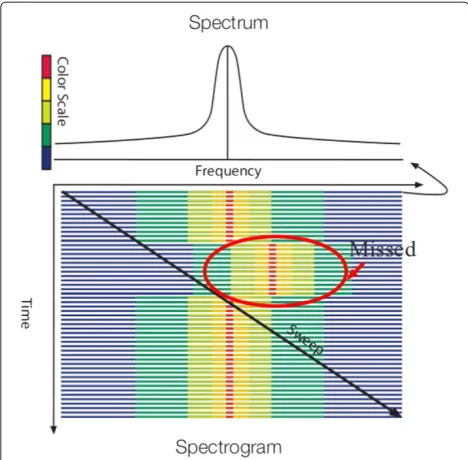
In today’s market, most spectrum analyzers have two basic modes: swept mode and fast Fourier transform (FFT) mode [8]. The swept mode is the traditional spectrum sensing method, where the radio-frequency (RF) center frequency is incremented by a small step very rapidly, hence the name ‘swept analyzer’. The signal obtained at each step is passed through a resolution bandwidth RBW filter, and the amplitude is then calculated by a detector. The range of the sweep defines thefrequency span. The time needed for the front-end to scan the entire frequency span is called thesweep time. The major disadvantage of a swept analyzer is that the spectrum can only be measured at one frequency point at a time. Therefore, it is possible to miss short signal events during the sweeping, as illustrated in Figure 1.
Figure 1Swept mode of a spectrum analyzer.The center frequency of the spectrum analyzer is continuously incremented (‘swept’), leading to potentially missed signals. The figure is adapted from [8].
spectrum information. The frequency span of the FFT-based analyzer depends on the sample rate. Although no sweeping is actually performed, we inherit the term ‘sweep time’ to describe the time between two consecutive FFT results.
Some spectrum analyzers combine the swept mode and the FFT mode. The result of one sweep is then a combi-nation of several FFT shots obtained at different center frequencies. This is termed as the swept FFT mode.
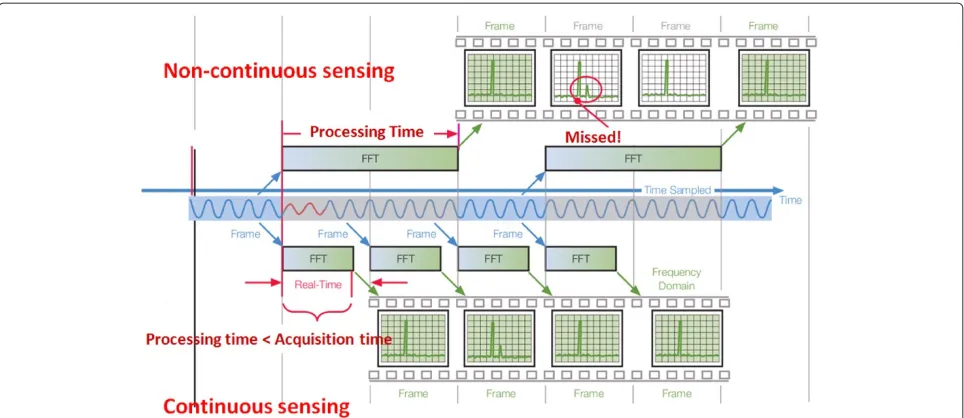
The advantage of the FFT-based analyzer is that it is possible to look at a broader range of the spectrum with one operation. However, FFT requires first the acquisition of a batch of samples and then followed by a processing step. What happens in between subsequent acquisition phases is missed by the analyzer, as illustrated in the upper part of Figure 2.
To solve this problem, the analyzer needs to meet the following conditions:
• The processing speed should be faster than the acquisition speed.
• The sample acquisition and sample processing should happen in parallel.
The above requirements are also described in the lower part of Figure 2. Spectrum analyzers that are capable of seamless measurements are referred to as real-time spec-trum analyzers [8]. The exact features of real-time analyz-ers depend on the type of the device. To illustrate this, two
specific spectrum analyzers are described in more detail in the following section: the FSVR series of ROHDE & SCHWARZ and the RSA series of Tektronix. Although modern spectrum analyzers also include the swept mode to increase the frequency range, here we only focus on the FFT mode. The discussion below does not include imple-mentation details but instead emphasizes the underlying processing mechanism and the amount of flexibility for the end users.
2.1.1 ROHDE & SCHWARZ FSVR
The FSVR is a popular series from R&S. The machine per-forms 250,000 times 1,024-point FFT per second, result-ing in one FFT shot every 4μs. When users configure the frequency span (sample rate), the amount of overlapping between adjacent FFT frames is automatically adjusted, as illustrated in Equation 1, where Fs is the sample rate andX is the amount of overlapping of samples between adjacent FFT frames in percentage:
1, 024/Fs×(1−X)=4μs (1)
The obtained FFT shot cannot be displayed directly because the number of FFT bins is generally greater than the available pixels on the screen. Various detectors are used to combine multiple FFT bins into one bin for visu-alization. Apart from the pixel limitation, most screens can only refresh 60 times per second; hence, FSVR com-bines multiple FFT shots into one for display purposes, and this is referred to as the trace detector. In the spectro-gram mode, the number of combined FFT shots is defined by the parameter sweep time. To a certain extent, users can lower the sweep time to increase the time resolution. The resolution bandwidth however is dependent on the frequency span, due to the fixed FFT size.
2.1.2 Tektronix RSA6000
Unlike FSVR, the RSA spectrum analyzer from Tektronix exposes more parameters to the end user. For instance, there is a parameter to specify the length of the time interval during which samples are collected and analyzed seamlessly. Both FFT size and sample rate can be config-ured independently. This decouples the resolution band-width from the frequency span. Similar to FSVR, the final result is trimmed by various detectors for displaying on the screen.
RSA provides highly flexible processing features, based on post-processing of raw samples in the memory.
Liuet al. EURASIP Journal on Wireless Communications and Networking2013,2013:228 Page 4 of 15 http://jwcn.eurasipjournals.com/content/2013/1/228
Figure 2FFT-based spectrum analyzer.In the upper part, the FFT processing time is longer than the sampling time, resulting in discontinuous sampling and missed transient signal; in the lower part, the analyzer is capable of detecting the transient signal, thanks to increased processing speed and continuous capturing. The figure is adapted from [8].
samples, a black line is used to indicate the discontinuity of the spectrogram.
2.1.3 Summary
Regardless the difference in processing style, the two ana-lyzers do have one thing in common - the output is produced in a way that is best suited for displaying on the screen. Also, in contrast with the fancy display features, the recording features of spectrum analyzers are rela-tively basic. Both FSVR and RSA are capable of recording raw samples and some amount of spectrogram, depend-ing on the waveform memory depth. Take the FSVR as an example, the waveform memory allows the user to store maximum 200 million in-phase and quadrature-phase (IQ) samples. This means a recording of 8 s with 25 mega samples per second (Msps) of sample rate, which is just wide enough to cover one Wi-Fi channel. Apart from the time limitation, further processing on the raw IQ samples is still required to obtain the energy in specific channels.
In summary, spectrum analyzers are made for fast visu-alization of various signals and performing sophisticated off-line analysis. The capability of spectrum analyzers are far beyond FFT or storing raw samples; however, they lack the capabilities of continuous recording and fast data transfer, hence are not suitable for basic channel assessment.
2.2 Low-cost USB devices
There are several commercial sensing solutions running on a regular computer with a USB dongle. The USB dongle
functions as the RF front-end while the host computer provides the user interface and the visualization function-ality. Some of the well-known devices are Wi-Spy [9] and Airmagnet [10].
The radio of Airmagnet has a 20-MHz intermediate frequency (IF) bandwidth. The Airmagnet spectrum ana-lyzer makes use of the swept FFT mechanism to cover a bandwidth that is wider than 20 MHz. For the 2.4-GHz industrial, scientific, and medical (ISM) band, the entire frequency span is fixed to 83 MHz with 156-kHz resolu-tion bandwidth. During each sweep, the radio increases its center frequency with a step of 20 MHz and dwells on each center frequency for 30 ms. The sweep time is fixed to 1 s. The fact that the frequency span is less than five times the IF bandwidth infers that each measurement of the 2.4-GHz ISM band contains maximum five blocks of samples. This means that the time to sample the wireless medium for each sweep is at maximum 150 ms. Given the constant sweep time of 1 s, the actual sensing efficiency is only 15%.
their usage. The feature of long-term recording is pro-vided but with very limited efficiency and flexibilities.
2.3 Sensor devices
Another option is to use cheap sensor devices for spec-trum analysis. Here the sensor devices refer to the battery-operated, low-power wireless platforms [11,12]. Sensor chips are originally meant to form sensor networks for home automation or various monitoring purposes. They usually consist of integrated sensors, a microcontroller, and an IEEE 802.15.4 (Zigbee)-compliant radio module. The radio module provides built-in clear channel assess-ment (CCA), which can be used to evaluate the energy of the selected channel. With appropriate firmware, cheap sensor devices can also be programed into a swept spec-trum analyzer.
It is evident that the CCA module can only sense one channel at a time and the frequency resolution is as wide as the Zigbee channel width. Although there exist solu-tions for programming front-end to perform fast sweeping [13] in the 2.4-GHz ISM band, its low resolution band-width limits the detection accuracy.
2.4 Sensing solution overview
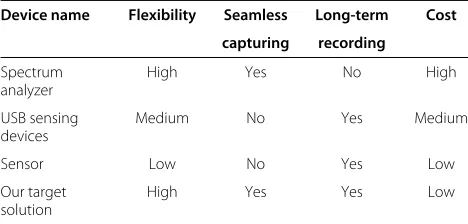
Table 1 gives an overview of the advantages and disadvan-tages of different sensing solutions. High-cost solutions such as spectrum analyzers are usually overkill for the tar-geted applications: many functionalities built in spectrum analyzers are redundant for merely channel assessment. In addition, these devices are not capable of long-term and seamless recording and fast data transfer. On the other hand, low-cost devices have less bandwidth and limited processing power and flexibility. To remedy this situation, we aim to design a low-cost solution that is capable of seamless recording and offers sufficient flexibility, as listed as the last entry of Table 1.
3 Our sensing solution
3.1 Design constraints
As discussed in Section 2.1, among the common spectrum analyzing approaches, the FFT mode is more advanced
Table 1 Overview of existing sensing solutions
Device name Flexibility Seamless Long-term Cost capturing recording
Spectrum analyzer
High Yes No High
USB sensing devices
Medium No Yes Medium
Sensor Low No Yes Low
Our target solution
High Yes Yes Low
than the swept mode. Therefore, our SDR-based sensing solution makes use of an FFT-based sensing solution. Our solution has the following design goals:
• Direct access to the IQ samples. This is a strict requirement since FFT relies on raw IQ samples instead of decoded bits or packets.
• Sufficient sample rate. The frequency span is defined by the sample rate; hence, the higher the sample rate, the broader the detection range.
• Flexibility. To be useful in a wide range of
technologies, the solution should expose sufficient flexibility to the end user. It should be possible to configure the sensing engine to assess different sets of channels and to change the front-end gain settings or FFT size.
• Ease of development. The design should be kept simple and transparent for fast prototyping and development.
• Platform independence. To overcome any limitations caused by operating systems, the software should be platform independent.
These requirements are the main motivation to use a SDR platform.
3.2 The hardware platform
SDR platforms allow traditional radio functions, such as decoding or encoding, to be shifted from hardware to software. SDRs can be divided into two categories based on the type of processor used for signal processing: the first category makes use of a general-purpose proces-sor in a regular computer; the second category relies on embedded processors onboard.
Liuet al. EURASIP Journal on Wireless Communications and Networking2013,2013:228 Page 6 of 15 http://jwcn.eurasipjournals.com/content/2013/1/228
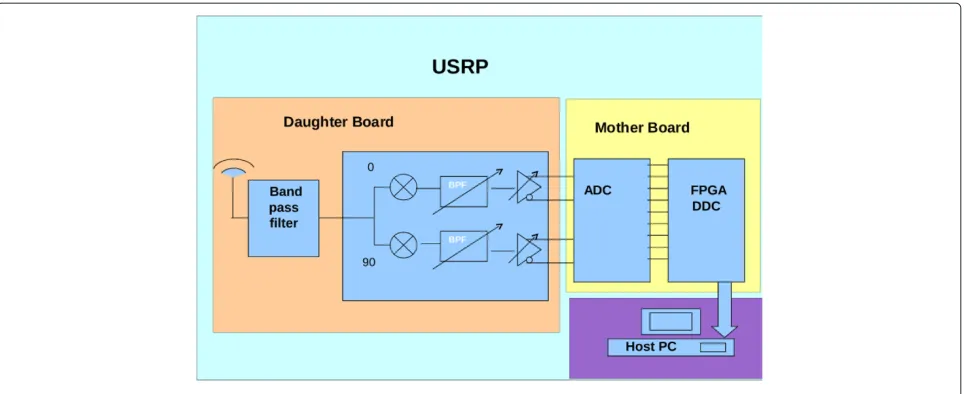
Figure 3USRP block diagram.
driver (UHD) for communicating between USRP and host PC [16]. It is entirely open source and available for all major operating systems and can be built with many pop-ular compilers such as the GNU Compiler Collection [17]. Users are able to use the UHD driver stand-alone or with third-party platforms such as GNU Radio [18].
The Wireless Open-Access Research Platform (WARP) is an example SDR platform that falls into the second category. It has a powerPC [19] processor and a large amount of programmable hardware resources [20]. Com-pared to USRP, WARP provides higher onboard process-ing capacity but is also much more expensive. The WARP programming environment relies on the Xilinx FPGA software, which is not free for use. The embedded pro-cessing power and rich FPGA resource make it possible to build a stand-alone sensing system; however, due to the hardware programming and embedded environment, it is also more difficult to design and debug. In addition, there are less RF boards available in the WARP repository than in the USRP.
Because of the aforementioned reasons, the USRP was selected to design our SDR sensing platform. The lack of processing power on the USRP can be compensated by connecting it to a powerful host machine. Though there is an option to use GNU Radio like third-party plat-forms, our software is implemented directly above the UHD driver. This reduces the overhead of function calls, hence gives better performance and sensing efficiency. Apart from the UHD library, the Boost [21] and FFTW [22] libraries are also required. All of the required libraries work on major operating systems, including UNIX and Windows variants, thus making our solution platform independent.
The sensing engine software is currently compiled and tested on six identical hexa-core Linux servers. The choice
of using a hexa-core server does not strictly comply to the initial low cost requirement; however, it is necessary to achieve sufficient amount of parallel processing, as further explained in Section 3.3. The architecture of the software can easily be ported to an FPGA platform. Note that the price of one USRP and one server is still significantly lower than the price of one spectrum analyzer; therefore, even the current approach is already an improvement in terms of overall financial cost.
The servers are physically located within a large-scale wireless testbed: the w-iLab.t testbed [23]. Currently, six USRPs are deployed in the testbed, each connected to one of the hexa-core servers. The w-iLab.t uses OMF (cOn-trol Management Framework) as its testbed con(cOn-trol and management framework [24]. OMF allows experimenters to configure multiple devices simultaneously, providing easy data logging services. Therefore, the multiple USRPs can easily be set up as a distributed cooperative sensing system. This configuration will be used for the Bluetooth detection experiment in Section 4.3.
3.3 The software architecture
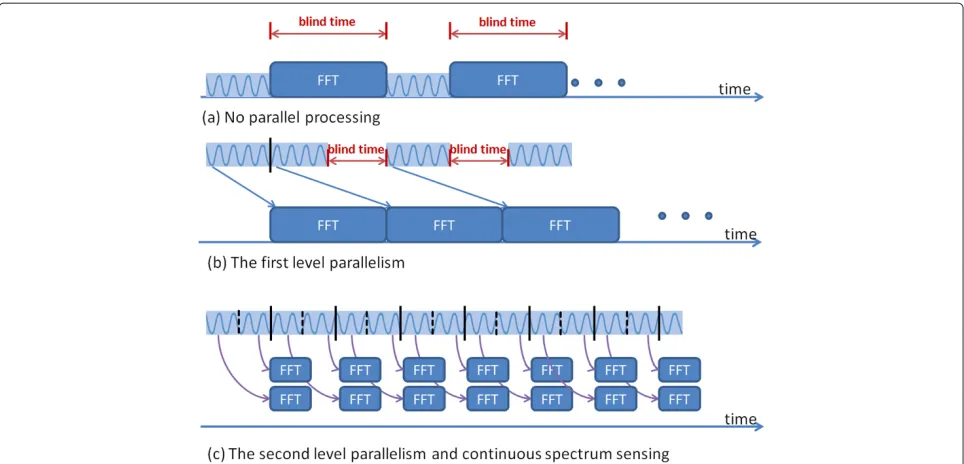
As stated in Section 2, it is important that the processing time is shorter than the sample acquisition time in order to achieve continuous spectrum sensing.
When no parallelism is present, the sample acquisition alternates with the processing phase, and as such, the blind time of the sensing engine is equal to the processing time (as illustrated in plot (a) of Figure 4).
Figure 4Parallel processing for seamless spectrum sensing.(a)No parallel processing.(b)The first level of parallelism.(c)The second level of parallelism and continuous spectrum sensing.
shown in plot (b) of Figure 4. However, this is not suffi-cient to achieve seamless sampling if the processing time is longer than the sampling time. To further reduce the processing time, we seek to add parallel processing within the processing phase itself. The processing phase con-sists of splitting samples into small frames, applying FFT operation on all frames sequentially, and combining all the FFT result in one way or another. As FFT is a highly computational demanding operation, instead of having one single FFT core working sequentially, we utilize mul-tiple FFT cores to work simultaneously: the incoming samples are divided among the multiple FFT cores for pro-cessing. Once the samples have been received, the FFT cores work independently from each other, hence ideal for parallelism. This is where the second-level parallelism is introduced. We illustrate the case of two FFT cores work-ing in parallel in plot (c) of Figure 4. More FFT cores could be added if it is necessary to achieve continuous spectrum sensing.
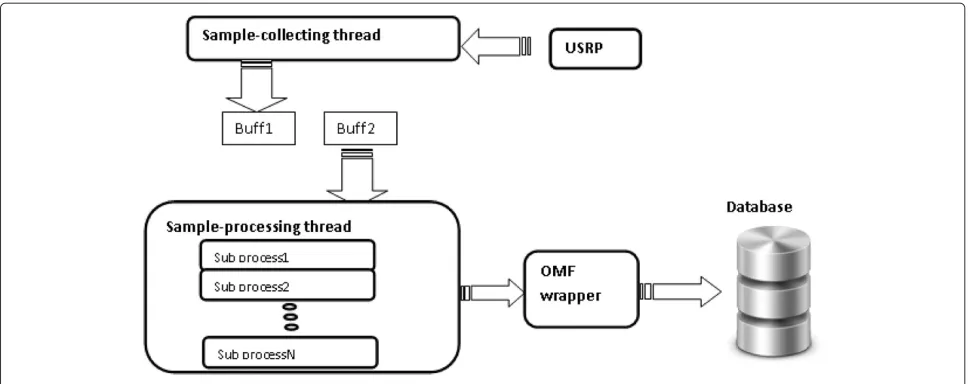
The sensing engine software relies on multi-threading to achieve parallel processing. There are two main threads running at any moment: one thread is responsible for col-lecting samples from the USRP (referred to as the sample-collecting thread), and the other thread is responsible for processing the samples (referred to as the sample-processing thread). The sample-sample-processing process again generates several sub-threads to process the incoming samples in parallel. The sample processing in our solu-tion calculates the FFT-based power spectrum density (PSD) and the energy for specified channels. Once all
sub-threads finish processing, they terminate and the original sample-processing thread outputs the result to either a local file or the standard output. To simplify the collection of measurements in the w-iLab.t testbed, the measurements are first printed to the standard output and then piped to a predefined database using an OMF wrapper. The general structure is illustrated in Figure 5.
Liuet al. EURASIP Journal on Wireless Communications and Networking2013,2013:228 Page 8 of 15 http://jwcn.eurasipjournals.com/content/2013/1/228
Figure 5High-level description of the software for seamless spectrum sensing.
3.4 Configurations and important features
The sensing engine software can be configured using var-ious options, which are described in detail in this section.
3.4.1 Continuous FFT mode vs. swept FFT mode
First of all, the sensing engine can be used in two modes: the continuous FFT mode and the swept FFT mode.
For the continuous FFT mode, the USRP front-end stays at the same frequency and continuously samples the wire-less medium. Similar to spectrum analyzers, users can control both the center frequency and the sample rate in order to define the spectrum range.
For the swept FFT mode, the USRP will always collect samples at its maximum sample rate of 25 Msps. The sam-ples collected at a specific RF center frequency are called a block, while the complete measurement across several RF center frequencies is called one sweep. Between two adjacent blocks, the center frequency is incremented by a step of 20 MHz. Users can specify the center frequency of the beginning block and how many blocks one sweep should contain. As such, by adding the swept FFT mode, the frequency span is no longer limited by the sample rate.
3.4.2 Measurement types
The sensing engine can be configured to perform different types of measurement:
1. The sensing engine can measure the PSD in the required frequency range and thus calculates the amount of energy detected in each specified channel. This is referred to as the PSD measurement. The PSD measurement has three variants: averaging, maxhold, and minhold, comparable to the function of the detector for spectrum analyzers. Typically, the number of samples per buffer is a lot larger than the FFT size; hence, each buffer contains many FFT
frames. For the PSD measurements, the software does either averaging, maxhold, or minhold across different FFT frames, and the final FFT result is used for the power integration for the requested channels. The maxhold mode is useful to detect the signal’s presence, while the minhold mode can be used for estimating the noise floor.
2. For the continuous FFT mode, the sensing engine can also measure how much portion of time the energy of the specified channels is above a certain threshold. This is referred to as the duty cycle measurement. To realize this function, the software investigates a particular channel and counts how many times its energy is above a threshold, and then divides this number by the total number of FFT frames in the buffer. When the appropriate threshold is selected (a value that is slightly above the noise floor), the duty cycle mode can be a powerful tool to detect transient signals.
3.4.3 Sensing efficiency
Recall that the sensing efficiency is defined as the ratio of the sampling time and the summation of the sam-pling time and the additional processing time. In our case, the processing phase happens entirely in parallel with the sampling phase. Hence, no additional time is required by the processing phase. For the continuous FFT mode, the sensing efficiency is always 100% since the USRP never stops sampling.
For the swept FFT mode, the sampling phase must be interrupted for channel switching, which is the only cause for time loss. Hence, the the sensing efficiency for the swept FFT mode is defined as
λ= Sampling time
Unfortunately, channel switching of the USRP is more complicated than only tuning the radio front-end’s cen-ter frequency. The host machine needs to communicate with the embedded processor on the USRP over the Eth-ernet interface. The exact handling of channel switching depends on the firmware on the embedded processor and the driver of the host machine.
To measure the channel switching time, Wireshark [25] was used to record the packets between the USRP and the host machine. All configuration packets have a short packet length, while the packets containing IQ samples are typically 1,514 bytes long. By using a packet-length-based filter, only the configuration packets used for chan-nel switching and streaming commands can be displayed. Based on this output, Wireshark can generate an IO graph, plotting the packet per millisecond vs. the time, as shown in Figure 6. This graph gives an indication on how much time is spent on sampling and how much time is spent on channel configuration. The sampling time is directly related to the requested number of samples by one stream command. This is defined by the option ‘– spb’ in the sensing software, standing for sample per buffer. The packet trace shown in Figure 6 is generated with 524,288 samples per buffer; the sampling time for each block is 524, 288/25 Msps = 21 ms, this result corre-sponds with Figure 6. The configuration time for channel switching cannot be influenced by software options. It currently requires about 19 ms to switch a channel for the USRP. The channel switching time is a hardware and driver issue, and it can be reduced by improving the driver and firmware. Although this is not the focus of this paper, it is an interesting direction for future improvements.
Up till now, we have identified the channel switching time, and the sensing efficiency in the swept FFT mode can be calculated by Equation 2. Increasing the sampling time is an effective way to improve the sensing efficiency. When configuring the sensing engine with ‘spb’ equal to 4,194,304, the sampling time is 4, 194, 304/25, 000 kHz= 168 ms and the sensing efficiency is 168 ms/(168 + 19)ms =89.8%. With five blocks per sweep, the sensing
engine can cover 100-MHz bandwidth and produce one sweep per second. Note that this configuration is very similar to the measurement capabilities of Airmagnet; however, the sensing efficiency of Airmagnet is only 15%.
3.4.4 Time resolution
In the swept FFT mode, the sensing engine produces one line of output per sweep. The continuous FFT mode can be considered as a special case of the swept FFT mode, where the sweep consists of only one block of samples. We use the term sweep time to describe the time interval between two subsequent lines of measurements.
When measuring the PSD, the time resolution depends on the sweep time. For the continuous FFT mode, the sweep time is equivalent to the sampling time. For a given sample rate, the sweep time is proportional to the sample per buffer - the spb parameter. Reducing the spb param-eter will reduce the sweep time, making the output more suitable for resolving short signal events.
For the swept FFT mode, the sweep time is equal to
T =Block per sweep×(Channel switching time
+Sampling time) (3)
Although for the swept FFT mode the sweep time depends on the channel switching time and proportional to the number of blocks in a sweep, it still heavily relies on the sampling time. Hence, to a certain extent, we are able to improve the time resolution by reducing the buffer size. For the duty cycle measurement in the continuous FFT mode, the time to resolve an event depends on the FFT size. This is because the entire buffer of samples is divided into multiple FFT frames. The length of the FFT frame serves as the basic unit for the channel occupation calculation.
Since commercial USB sensing solutions typically have no or limited sweep time configurations, our solution is clearly more flexible in this aspect.
Liuet al. EURASIP Journal on Wireless Communications and Networking2013,2013:228 Page 10 of 15 http://jwcn.eurasipjournals.com/content/2013/1/228
3.4.5 Channel configuration
It is important to let the sensing engine know which chan-nels to measure. Four configuration options are used to complete this target:
• numofchannel: specifies the number of channels to be measured
• firstchannel: the center frequency of the first channel • channelwidth: the bandwidth of each channel • channeloffset: the difference between adjacent
channels’ center frequency
At this moment, software only allows to specify chan-nels that are uniformly spaced and with identical band-width. This format is flexible enough to describe the channel specifications of the most popular wireless standard. As an example, to measure the 13 chan-nels of Wi-Fi in the 2.4-GHz range, the following options are used in the input command: ‘–numofchannels 13 –firstchannel 2412000000 –channelwidth 22000000 – channeloffset 5000000’. The above options tell the sensing engine to measure 13 channels, with the first channel starting at 2,412 MHz, each channel 22 MHz wide, and the center of all the channels 5 MHz apart. This fea-ture makes it easy to conduct measurements for different technologies.
3.4.6 Output format
The output of the sensing engine contains the following components:
• timestamp: a unix timestamp in microsecond precision
• usrpid: the id of the USRP used to collect samples • energy or duty cycle array: an array that contains
either the energy (in dBm) or duty cycle (in percentage) for all channels of interest
In contrast to the raw spectrum measurements from spec-trum analyzers and some USB-based devices, the output format can directly be used for channel assessment.
3.4.7 Resolution bandwidth and FFT size
Usually, the RBW of the FFT-based spectrum analyzer is calculated as the ratio of sample rate over FFT size. Sim-ilar to the Tektronix RSA analyzer, users can also directly specify the FFT size and sample rate independently. The final frequency resolution that is obtained is defined by the number of channels and the channel’s bandwidth. So the RBW does not directly rely on the FFT size. How-ever, it is still necessary for the underlying RBW of FFT to be sufficiently smaller than the interested channel band-width; otherwise, the power integration for the specified channel will be less accurate.
3.4.8 Performance comparison with existing sensing solutions
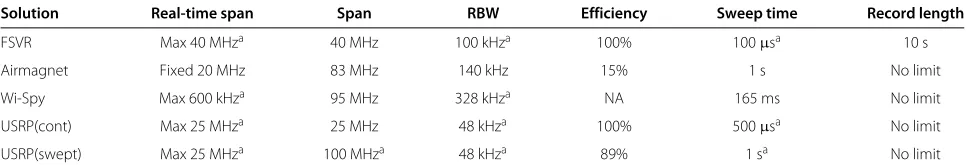
Having introduced the various configurations for our solution, this section compares the performance of our spectrum analyzing solution with commercially available devices. A summary is available in Table 2. A few things need to be kept in mind to understand this table:
• Firstly, we are comparing a broad range of devices. For a fair comparison, we need to fix one set of parameters and observe the remaining parameters. However, due to the fact that some devices are less flexible than others, it is not feasible to configure all devices so that they achieve exactly the same settings. To resolve this issue, a simple rule is applied: the most flexible devices are configured to have the same settings as the most inflexible device. For our comparison, Airmagnet is the most inflexible device among the presented solutions. Therefore, all other devices are configured to the same settings as Airmagnet.
• Secondly, the performance parameters are not completely independent. We already stated the trade-off between frequency resolution and time resolution, which applies to all devices. Another example is device specific: for the FSVR spectrum analyzer, the ratio of the span over RBW is predefined, depending on which FFT window is selected. In Table 2 this ratio is 400, when the rectangular window is applied [26]. Therefore, we need to decide which parameters are controlled and which parameters are observed. For this comparison, sensing efficiency was chosen as the primary observed parameter. The entire frequency span is chosen to be the major controllable parameter, listed as ‘span’ in Table 2. Real-time span refers to what bandwidth the sensing engine can cover without performing sweeping; the maximum real-time span usually depends on the hardware capability of the platform. It is listed here for completion.
• When a parameter is configurable, it is marked with a superscripted lowercase letter ‘a’. The settings presented in Table 2 are just one set of
configurations; readers are encouraged to check the reference materials for more details.
• The continuous FFT mode and the swept FFT mode of the USRP sensing engine are listed as two separate entries: ‘USRPSE(cont)’ and ‘USRPSE(swept)’. This way, it is possible to fully evaluate the capability of our solution.
Table 2 Performance comparison with existing sensing solutions
Solution Real-time span Span RBW Efficiency Sweep time Record length
FSVR Max 40 MHza 40 MHz 100 kHza 100% 100μsa 10 s
Airmagnet Fixed 20 MHz 83 MHz 140 kHz 15% 1 s No limit
Wi-Spy Max 600 kHza 95 MHz 328 kHza NA 165 ms No limit
USRP(cont) Max 25 MHza 25 MHz 48 kHza 100% 500μsa No limit
USRP(swept) Max 25 MHza 100 MHza 48 kHza 89% 1 sa No limit
aConfigurable parameters.
FFT mode. The same reason applies for putting 25 MHz as the span of the USRP sensing engine in continuous FFT mode.
• When certain parameters are independent of the sensing efficiency, the optimal performance of that device is listed. For instance, the sweep time of FSVR is listed as 100μs which is the shortest sweep time the device can achieve, and the same applies to the sweep time of the USRP in continuous FFT mode. • The sensing efficiency of the USRP sensing engine
has been discussed in Section 3.4.3. The efficiency of Airmagnet is derived in Section 2.2. For Wi-Spy, the concept of sensing efficiency is not applicable because it operates purely in sweeping mode. The rest of the values are obtained from the
corresponding reference material [9,10,26].
Table 2 demonstrates the performance advantages of our solution. The continuous FFT mode of the USRP sens-ing engine is the only solution which is capable of 100% sensing efficiency and long-term recording at the same time. The swept FFT mode offers 89% sensing efficiency under a configuration similar to that of Airmagnet, which only provides 15% sensing efficiency. Although the sweep time of our solution is longer than the best record of the (more expensive) FSVR spectrum analyzer, it is still much faster than Airmagnet and Wi-Spy devices.
4 Experiments and results
This section focuses on experimental analysis for the pro-posed solution. We first describe the experiment platform in Section 4.1, and then we present two experiments in depth in Sections 4.2 and 4.3. In both experiments, we use our sensing engine solution for detecting certain types of signal and evaluating the performance. The difference is that the first experiment uses Wi-Fi beacon frames as target signal, while the second experiment uses regular Bluetooth traffic. The reason that we choose the Wi-Fi beacon is that it appears periodically at a fixed frequency band, so it is a well-defined signal. Bluetooth, on the other hand, uses random frequency hopping, therefore is one of the most challenging signals to detect in the ISM bands.
Within each experiment, we first introduce the char-acteristics of the target signal and then describe what
settings are used on our sensing engine to detect the target signal, followed by measurements and thorough analysis.
4.1 The w-iLab.t testbed
The experiments are conducted on the w-iLab.t testbed [23]. The topology of the testbed is shown in Figure 7, where the locations of the USRPs are highlighted with yel-low stars. Apart from USRPs, the majority of the devices in the w-iLab.t testbed are embedded PCs equipped with Wi-Fi interfaces, IEEE 802.15.4 sensor nodes, and Blue-tooth dongles. All devices are reachable over a wired network interface for management purposes. Each device can be fully configured by the experimenters. When the wireless devices are configured via the same embedded PC, they are said to be attached to one ‘node’. The reg-ular nodes are indicated with blue dots in Figure 7. The rich combination of heterogeneous technologies is ideal for testing the proposed sensing solution. As mentioned before, two representative wireless signals are used to test the performance of our sensing engine - the beacon of a Wi-Fi access point (AP) and regular traffic between a pair of Bluetooth devices. The locations of the Wi-Fi AP and the Bluetooth devices used for experiments are indicated in Figure 7.
4.2 Wi-Fi beacon experiment
The Wi-Fi beacon appears periodically on a fixed channel. According to the IEEE 802.11 standard, a beacon frame is 134 bytes long and transmitted at 1 Mbit/s. Hence, one beacon transmission takes around 134×8/1 Mbit= 1.072 ms [27]. The beacons are transmitted on channel 1 and the beacon interval is set to 100 ms. As such, the channel will be occupied for about 1% of the time. This well-defined signal is convenient to validate the channel occupation measurement.
4.2.1 Measurements using continuous FFT mode
Liuet al. EURASIP Journal on Wireless Communications and Networking2013,2013:228 Page 12 of 15 http://jwcn.eurasipjournals.com/content/2013/1/228
Figure 7USRP deployment in iMinds w-iLab.t testbed.
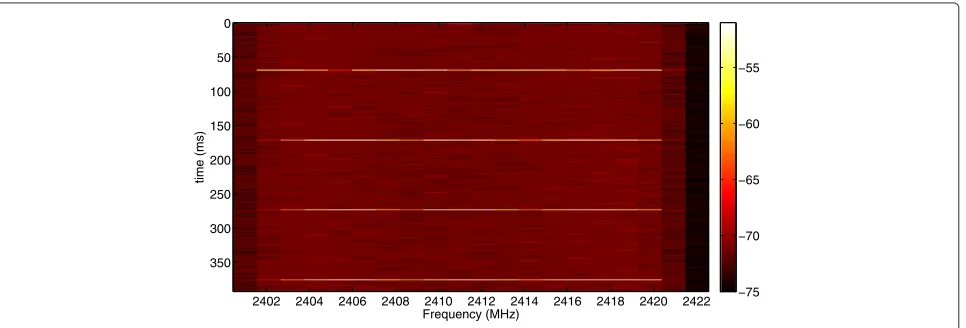
A spectrogram is the best way to show the seamless cap-turing of the Wi-Fi beacons. The recorded spectrogram is shown in Figure 8. During 400 ms, four beacons are transmitted and they are all captured with their full sig-nal strength. This clearly demonstrates the advantage of seamless capturing. Note that the presented spectrogram is only 400 ms long; in reality, the period of this recording can be indefinite.
The above measurement with extremely fine time res-olution is only needed for visualization purposes, but is not required for channel assessment. In order to reduce the output per second while still being able to reflect the actual usage of a channel, the channel duty cycle was mea-sured with −70 dBm as the detection threshold. Note that−70 dBm is slightly above the noise level measured by the USRP for Wi-Fi channels, which gives the best probability of detection based on our experience. There are many theories related to the energy detection thresh-old in order to improve the probability of detection. In
the context of our experiment, all the nodes are in line-of-sight topology; hence, the detection threshold is not critical. The complexity of determining the optimal energy detection threshold is out of the scope of this paper.
When the spb parameter is set to 16,777,216, the sam-pling time is around 0.67 s. The sensing engine measures that the selected Wi-Fi channel is occupied between 0.95% and 1.05%. This corresponds to the calculated duty cycle. The reason of the 0.1% fluctuation is because the sam-pling time is not a multiple of the beacon interval; hence, the exact number of detected beacons per buffer varies. This measurement demonstrates that our sensing engine is capable of seamless capturing and performing accurate channel occupation assessments.
4.2.2 Measurements in swept FFT mode
For the measurement in the swept FFT mode, all 13 Wi-Fi channels in 2.4 GHz are measured. The spb parameter is increased by a power of 2, from 131,072 to 4,194,304. The
Frequency (MHz)
time (ms)
2402 2404 2406 2408 2410 2412 2414 2416 2418 2420 2422 0
50
100
150
200
250
300
350
−75 −70 −65 −60 −55
spectrograms of 12 s are shown in Figure 9. Note that at the time of this experiment, apart from our test beacon on channel 1, there is another external access point active on channel 10. This paper focuses only on the analysis of the beacon signal on channel 1.
First, as expected, when the spb value is small, the sens-ing engine uses a shorter sweep time, hence the thinner horizontal lines in the spectrogram. Secondly, beacon sig-nals are not always detected with full signal strength; the strongest signal appears to be around−50 dBm, while the weakest yet still distinguishable signal is around−65 dBm. This is because when using the swept FFT mode, the sam-pling is not continuous and sometimes only part of the beacon packet is captured, leading to inaccurate power measurement. This observation is illustrated in Figure 10, where the number of occurrences for the energy above various thresholds is plotted. In addition, the total num-ber of sweeps in the recording is drawn as a reference. We observe that with the growth of spb, the probabil-ity of detecting a beacon signal with full signal strength increases. When the sampling time is larger than the beacon interval, in each buffer of samples, at least one complete beacon is captured; hence, all beacons that have been captured are displayed with correct signal strength. This observation reveals that for the swept FFT mode, there is a trade-off between the sensing efficiency and time resolution. It is obvious that decreasing the buffer size can improve the time resolution; however, at the same
time, the channel switching time becomes more impor-tant compared to the total sweep time, which results in worse sensing efficiency.
We conclude that the swept FFT mode can effectively expand the frequency span, which helps give a global view of the spectrum. Despite the trade-off with the sens-ing efficiency, the time resolution can be conveniently configured using the spb parameter.
4.3 Bluetooth experiment
The Bluetooth technology utilizes frequency hopping spread spectrum modulation. There are 79 Bluetooth channels in the 2.4-GHz ISM band, and each channel has a 1-MHz bandwidth [28]. A Bluetooth device hops to a different frequency every 625 μs. For the experi-ment, two nodes were paired with the Bluetooth interface. An unidirectional UDP traffic with 1-MB/s throughput is generated from the application layer on top of the Blue-tooth stack. The BlueBlue-tooth activity was measured with a cooperative spectrum sensing system formed by four USRPs. Each USRP operates in the continuous FFT mode and covers 20 Bluetooth channels; as such, in total, a 80-MHz bandwidth is observed. All the nodes and USRPs have a line-of-sight connection.
To be able to assemble the spectrum from different USRPs into one complete spectrum covering all Bluetooth channels, we need to synchronize the system clock of the servers connected to the USRPs. This was achieved by
sample per buffer 131072
time(ms)
2 4 6 8 10 12
0
5000
10000
sample per buffer 262144
time(ms)
2 4 6 8 10 12
0
5000
10000
sample per buffer 524288
time(ms)
2 4 6 8 10 12
0
5000
10000
sample per buffer 1048576
time(ms)
2 4 6 8 10 12
0
5000
10000
sample per buffer 2097152
time(ms)
2 4 6 8 10 12
0
5000
10000
sample per buffer 4194304
time(ms)
802.11 Channel 802.11 Channel
802.11 Channel 802.11 Channel
Liuet al. EURASIP Journal on Wireless Communications and Networking2013,2013:228 Page 14 of 15 http://jwcn.eurasipjournals.com/content/2013/1/228
0 0.5 1 1.5 2 2.5 3 3.5 4 4.5
x 106 0
10 20 30 40 50 60 70 80 90 100
Number of samples per buffer
Sweep count
Total number of entries detected with threshold −70 dBm detected entries with threshold −65 dBm detected entries with threshold −60 dBm detected entries with threshold −55 dBm
Figure 10Number of detections with different threshold settings.
using the Precision Time Protocol daemon (PTPd) [29]. PTPd allows computers within a local area network to keep their clock synchronized to a common clock source, commonly referred to as the master clock. In our sys-tem, the clock of server 1 is the master clock. After some time, the offset from master to slave starts to settle down to around 30 μs. As each Bluetooth packet occupies a random Bluetooth channel for 625 μs, the clock drift-ing is relatively small (5%) compared to the Bluetooth packet length, hence will allow us to identify the packets correctly.
The experiment is conducted via the OMF, where a central script is executed to make sure all USRP sensing engines start approximately at the same time. The time resolution is adjusted to 655μs to better resolve the Blue-tooth activity. Since all servers are synchronized to server 1, the timestamp from server 1 is used to derive the rel-ative timestamp. The resulting spectrogram is shown in
Figure 11. It is possible to observe short 1-MHz-wide Bluetooth activities spread over the spectrum space. Addi-tionally, it can be seen that there is no Bluetooth activity between 2,423 and 2,446 MHz. In recent implementa-tions, Bluetooth does not necessarily use all the channels. As an example, the adaptive frequency hopping mecha-nism excludes channels with bad communication quality from the channel list [30].
In conclusion, this measurement demonstrates the pos-sibility to form a distributed and cooperative sensing system with our sensing engine solution. The result can be used to identify Bluetooth activity in the wireless spectrum.
5 Conclusions
In this paper we first presented a brief survey of vari-ous spectrum sensing solutions. We argue that continuvari-ous spectrum sensing is important for channel occupation
Frequency (MHz)
Time (ms)
2410 2420 2430 2440 2450 2460 2470 2480 0
200
400
600
800
1000
1200 −90
−85 −80 −75 −70 −65 −60 −55 −50 −45 −40
assessment. However, a sensing engine capable of con-tinuous sensing with sufficient flexibility is still missing among today’s sensing solutions.
To close this gap, we developed a new sensing engine based on a commercial SDR platform. Compared to most low-cost sensing solutions, our solution provides much more flexibilities in terms of configuration. The most important feature is its capability of seamless capturing and long-term recording. The implementation is based on several open-source libraries supported on major plat-forms. This makes our solution transparent and being able to run on a broad range of operating systems. Additionally, our solution can easily be extended into cooperative and distributed sensing systems, as described in Section 4.3.
The solution we proposed relies on a standard PC for processing. On one hand, this makes it ideal for fast pro-totyping and development. On the other hand, it makes the solution less portable and not able to work in a stand-alone situation. How to migrate the software computa-tional capability to an embedded platform is one of the remaining challenges. The basic idea is to shift the pro-cessing load from software to hardware. In this way, we do not require extensive processing power on an embedded system.
The pipelined software architecture and seamless spec-trum sensing functionalities can be ported to an FPGA chip with minor effort; because independent hardware blocks works in parallel intrinsically. There exists a large amount of tools for translating software functionalities into hardware [31,32], but attention should be paid to issues such as processing time, power consumption, etc. This is one of the ongoing activities for future extension.
Competing interests
The authors declare that they have no competing interests.
Acknowledgements
The research leading to these results has received funding from the European Union’s Seventh Framework Programme FP7/2007-2013 under grant agreement no. 258301 (CREW project).
Received: 30 April 2013 Accepted: 28 August 2013 Published: 13 September 2013
References
1. iMinds: QoCON project (2012), http://www.iminds.be/en/research/ overview-projects/p/detail/qocon-2. Accessed Sept 2013
2. RWTH Aachen University: Faramir project (2012), http://www.ict-faramir. eu/. Accessed Sept 2013
3. S Haykin, Cognitive radio: brain-empowered wireless communications. IEEE J. Select. Areas Commun.23, 201–220 (2005)
4. AT Hoang, Y-C Liang, Adaptive scheduling of spectrum sensing periods in cognitive radio networks, inProceedings of the IEEE Global
Telecommunications Conference, 2007 (GLOBECOM ’07)(Washington, DC, 26–30 Nov 2007)
5. S-C Chen, C-J Chang, R-H Gao, A two-phase and two-period spectrum sensing scheme using high-layer information for cognitive radio networks, inProceedings of the 2012 Computing, Communications and Applications Conference (ComComAp)(Hong Kong, 11–13 Jan 2012)
6. S Pollin, An integrated reconfigurable engine for multi-purpose sensing up to 6 GHz, inProceedings of the 2011 IEEE Symposium on New Frontiers in Dynamic Spectrum Access Networks (DySPAN)(Aachen, 3–6 May 2011) 7. E Buracchini, The software radio concept. IEEE Comm. Mag.38, 138–142
(2000)
8. Tektronix,Fundamentals of Real-Time Spectrum Analysis(Tektronix, Beaverton, 2009), p. 7
9. MetaGeek, How Wi-Spy works (2011), http://www.metageek.net/blog/ 2011/01/how-wi-spy-works/. Accessed Sept 2013
10. Fluck Corporation,AnalyzerAir User Manual(Fluck Corporation, Everett, 2006)
11. Moteiv Corporation,Ultra Low Power IEEE 802.15.4 Compliant Wireless Sensor Module(Moteiv Corporation, El Cerrito, 2006)
12. Zolertia (2013), www.zolertia.com. Accessed Sept 2013
13. C Heller, S Bouckaert, I Moerman, S Pollin, P Van Wesemael, D Finn, D Willkomm, J-H Hauer, A performance comparison of different spectrum sensing techniques, inProceedings of the Wireless Innovation Forum European Conference on Communications Technologies and Software Defined Radio(Brussels, 22–24 June 2011)
14. Ettus Research (2013), http://www.ettus.com/. Accessed Sept 2013 15. Ettus Research, USRP RF daughter boards (2013), https://www.ettus.com/
product/category/Daughterboards. Accessed Sept 2013 16. Ettus Research, Universal Hardware Driver software (UHD) (2013),
http://code.ettus.com/redmine/ettus/projects/uhd/wiki. Accessed Sept 2013
17. FreeSoftware Foundation, Inc., GCC, the GNU Compiler Collection (2013), http://gcc.gnu.org/. Accessed Sept 2013
18. GNU Radio (2011), http://gnuradio.org/redmine/projects/gnuradio. Accessed Sept 2013
19. IBM, PowerPC processor (2013), http://www.ibm.com/developerworks/ linux/library/l-powarch/. Accessed Sept 2013
20. WARP (2013), http://warp.rice.edu/. Accessed Sept 2013 21. Boost library (2013), http://www.boost.org/. Accessed Sept 2013 22. FFTw library (2013), http://www.fftw.org/. Accessed Sept 2013 23. S Bouckaert, P Becue, B Vermeulen, B Jooris, I Moerman, P Demeester,
Federating wired and wireless test facilities through Emulab and OMF: the iLab.t use case, inProceedings of the TridentCom 2012(Thessaloniki, 11–13 June 2012)
24. T Rakotoarivelo, M Ott, G Jourjon, I Seskar, OMF: a control and
management framework for networking testbeds. SIGOPS Oper. Syst.43, 54–59 (2010)
25. Wireshark Foundation, Wireshark packet sniffer (2013), http://www. wireshark.org/. Accessed Sept 2013
26. R&S,FSVR Real-Time Spectrum Analyzer Specifications(R&S, Munich, 2010) 27. 80211g group I,IEEE 802.11g-2003: Further Higher Data Rate Extension in the
2.4 GHz Band(IEEE, Piscataway, 2003)
28. Bluetooth SIG, Bluetooth standard (2013), https://www.bluetooth.org/ en-us. Accessed Sept 2013
29. Precesion Time Protocol daemon (2012), http://ptpd.sourceforge.net/. Accessed Sept 2013
30. MH Chek, On adaptive frequency hopping to combat coexistence interference between Bluetooth and IEEE 802.11b with practical resource constraints, inProceedings of the 7th International Symposium on Parallel Architectures, Algorithms and Networks, 2004(Hong Kong, 10–12 May 2004) 31. Berkeley Design Technology Inc.,The AutoESL AutoPilot High-Level
Synthesis Tool(Berkeley Design Technology, Inc., Walnut Creek, 2010) 32. Xilinx,Vivado Design Suite User Guide(Xilinx, San Jose, 2013)
doi:10.1186/1687-1499-2013-228