Theses and Dissertations
2017
Tuberculosis Screening in New Healthcare
Employees: A Comparison of QuantiFERON®-TB
Gold In-Tube Test and Tuberculin Skin Test
Mary C. Giovannetti University of South Carolina
Follow this and additional works at:https://scholarcommons.sc.edu/etd Part of theNursing Commons
This Open Access Dissertation is brought to you by Scholar Commons. It has been accepted for inclusion in Theses and Dissertations by an authorized administrator of Scholar Commons. For more information, please [email protected].
Recommended Citation
Tuberculosis Screening in New Healthcare Employees: A Comparison of QuantiFERON®-TB Gold In-Tube Test and Tuberculin Skin Test
by
Mary C. Giovannetti
Bachelor of Science in Nursing Marshall University 1994
Master of Science in Nursing Marshall University 1998
Submitted in Partial Fulfillment of the Requirements
for the Degree of Doctor of Nursing Practice in
Nursing Practice
College of Nursing
University of South Carolina
2017
Accepted by:
Stephanie Burgess, Major Professor
Karen Kane McDonnell, Committee Member
Abbas Tavakoli, Committee Member
Stephanie Barnhill, Committee Member
ii
iii
DEDICATION
I dedicate this manuscript first to my Lord and Savior Jesus Christ.
I would like to dedicate this project to my husband Sean and my children
Bethany, Sean Christopher, Emily and Olivia who supported and put up with me
throughout this journey. Without your understanding, I would not have achieved my goal.
I love each of you very much and am looking forward to more free time to spend with
you so that I can cheer each of you on in your gifts and own educational endeavors. And
to my parents Dana and Tess Gullett who worked so hard, so that I could have an
iv
ACKNOWLEDGEMENTS
Thank you to my committee chair, Dr. Stephanie Burgess, along with my
committee members Dr. Karen McDonnell, and Dr. Abbas Tavakoli for your editing,
guidance, and encouragement throughout this process. Your countless hours spent on this
project are much appreciated. Thank you to my secondary investigator and committee
member Stephanie Barnhill for taking the time to help collect the large amount of data
that seemed insurmountable. Your assistance helped me finish on time.
Thank you to the Employee Health staff who are the hands and feet for
implementation of the QFT®-GIT for new hire screening processes, and for tracking the
new hire logs. Thank you to Kathy Sinclair and SRHS administration for your support of
this project. Also, thanks to Frankie Rice, Robbie Ford, Rachel Dattilo, Kathy Bryant,
Todd Bridges, Denise Smith, Laurie Wybenga, Betty Warlick, and Kim Coggins for your
v ABSTRACT
Background: Streamlining onboarding processes for new hires to maximize
efficiency and reduce costs while meeting regulatory requirements is a constant challenge
for healthcare systems’ Employee Health staff. Health screening is a required step and
includes obtaining a detailed health history, tuberculosis screening, drug screens,
immunizations, fit for duty examinations, obtaining medical records, clarification of
disability accommodations, pre-work screens, and other tests which are time consuming
and result in delays in hire dates. Faced with a high volume of potential new employee
hires a major southeast healthcare system was concerned about delays in new hire start
dates. The two-step tuberculin skin test administration and follow-up process was
identified as a potential area for concern to improve onboarding efficiency.
Method: A quality improvement study was designed and implemented to
compare baseline testing for new employees with an Interferon-Gamma Release Assay
(IGRA) known as QuantiFERON®-TB Gold In-Tube Test (QFT®-GIT) to the two step
PPD Tuberculin Skin Test (TST) for tuberculosis screening time, overall onboarding
time, compliance with screening within 10 days of hire date, and associated costs. A
retrospective electronic record review included a sample of 484 new hire employees.
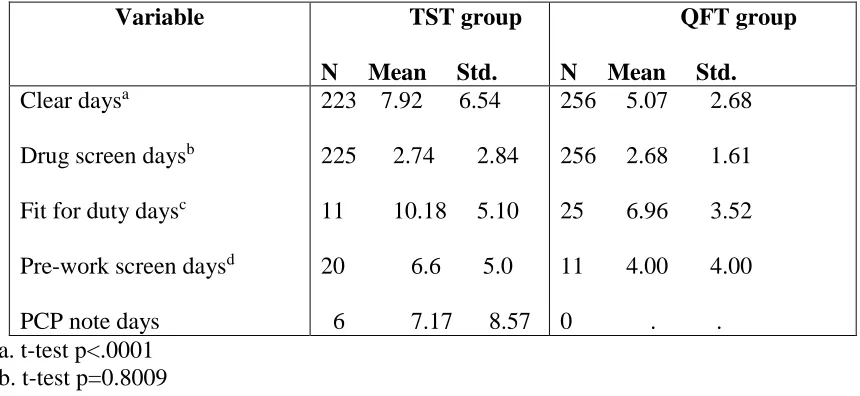
Results: Results showed that the QFT®-GIT for tuberculosis screening in
comparison to the TST testing significantly reduced tuberculosis screening time for new
vi
onboarding time (TST = 7.92 days, QFT®-GIT = 5.07 days; p<.0001) while improving
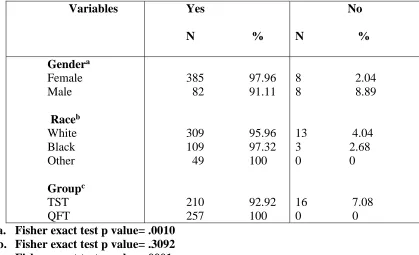
compliance with tuberculosis screening within 10 days of hire date (TST = 92.92%,
QFT®-GIT =100%; p<.0001).
Conclusions: The utilization of QFT®-GIT for tuberculosis screening of new
employees significantly reduced screening and onboarding time while improving
compliance with screening within 10 days of the hire date. Anecdotal feedback from
hiring managers and senior management indicated improved satisfaction with the
Employee Health hiring process.
Implications: Healthcare systems should consider implementation of an IGRA
to streamline processes for onboarding new employees. New processes require
negotiations between healthcare systems and lab vendors, changes in policies and
procedures, and employee health and laboratory staff development. Future research
vii
TABLE OF CONTENTS
DEDICATION ... iii
ACKNOWLEDGEMENTS ... iv
ABSTRACT ...v
LIST OF TABLES ...x
LIST OF ABBREVIATIONS ... xii
CHAPTER 1: INTRODUCTION ...1
Description of Clinical Problem ...1
Scope of the Problem ...3
Analysis of Current Practices ...6
Practice Innovation ...11
Purpose ...14
Project Question/PICOT ...14
Assumptions ...16
Summary ...17
CHAPTER 2: LITERATURE REVIEW ...18
Introduction ...18
Literature Search Strategy ...19
Literature Analysis ...22
Synthesis of Literature ...67
viii
CHAPTER 3: PROJECT DESIGN AND PLAN ...78
Introduction ...78
Conceptual Framework ...79
Project Design ...81
Justification for Need ...81
Feasibility ...82
Summary ...85
Intervention Plan ...85
Timeline ...86
Evaluation Plan ...89
Data Collection Procedure ...92
Data Management and Analyses Procedures ...93
Human Subjects ...94
Summary ... 95
CHAPTER 4: FINDINGS AND CONCLUSIONS ...97
Introduction ...97
Findings ...98
Conclusions ...106
Implications for Practice ...108
Future Research ...108
Dissemination ...109
REFERENCES ...110
ix
APPENDIX B: EVIDENCE LEVEL AND QUALITY GUIDE ...144
APPEDIX C: CONCEPTUAL FRAMEWORK ...147
APPENDIX D: INSTITUTIONAL REVIEW BOARD APPROVALS ...149
APPENDIX E: NURSING RESEARCH COUNCIL PROPOSAL AND APPROVALS ...151
APPENDIX F: POSTER ABSTRACT ...158
APPENDIX G: CONFERENCE PRESENTATION APPLICATION ...160
x
LIST OF TABLES
Table 1.1: Costs per Visit for New Hire Screening in Employee Health ...10
Table 1.2: Estimated Costs for New Hire Screening with QFT®-GIT ...13
Table 1.3: PICOT ...15
Table 1.4: PICOT Definitions ...15
Table 2.1: Keywords ...20
Table 2.2: Criteria for inclusion/exclusion ...21
Table 2.3: Quality ratings per evidence level ...23
Table 2.4: Journal/Sources ...24
Table 2.5: Categories of Articles ...24
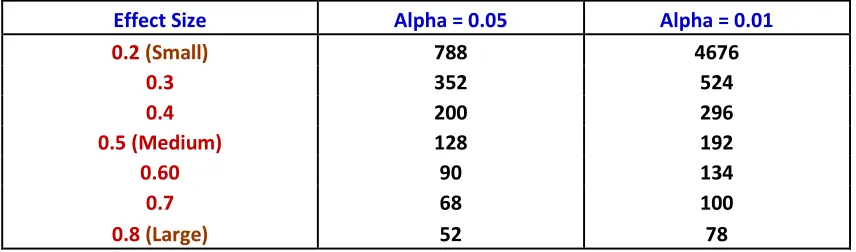
Table 3.1: Required sample size for Ttest analysis with 80% power, Different effect size, and alpha ...94
Table 4.1: Frequency distribution for demographic variables (n=485) ...99
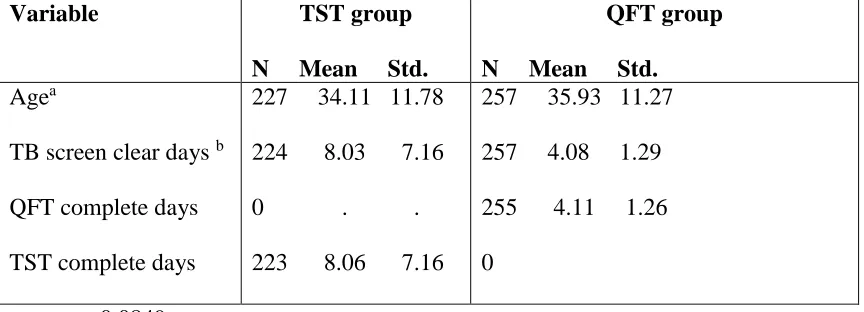
Table 4.2: N, means, standard deviation, minimum, maximum for select variables ...100
Table 4.3: N, mean standard deviation for select variables by group ...101
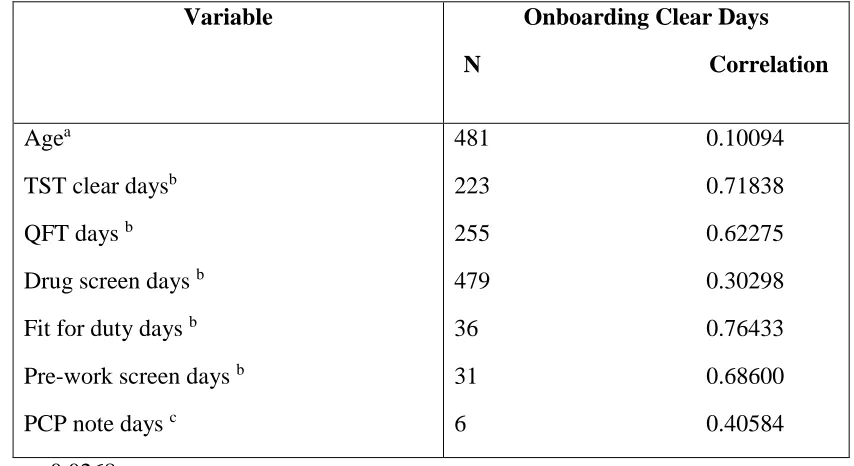
Table 4.4: N, mean standard deviation for select onboarding variables by group ...102
Table 4.5: Correlation of selected variables for onboarding clearance days ...103
Table 4.6: Frequency distribution for clear within 10 days ...104
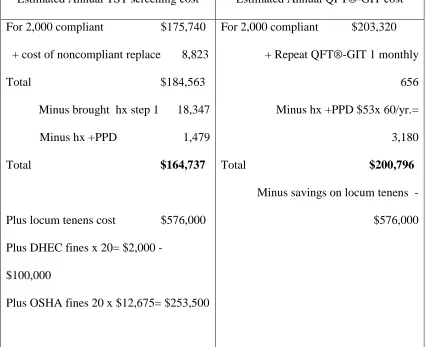
Table 4.7: Average estimated costs based on data collection ...106
Table A.1: Evidence Table Abbreviation Guide ...115
xi
Table B.1: Evidence and quality guide ...144
Table H.1: Frequency distribution for demographic variables ...185
Table H.2: N, means, standard deviation, minimum, maximum
for select variables ...186
Table H.3: N, mean, standard deviation for select variables by group ...186
Table H.4: N, mean, standard deviation for select onboarding
Variables by group ...187
Table H.5: Spearman Correlation of selected variables for onboarding
clearance days ...187
Table H.6: Frequency distribution for clear within 10 days ...188
xii
LIST OF ABBREVIATIONS
BCG ... Bacille Calmette-Guerin Vaccine
CDC ... Centers for Disease Control and Prevention
DHEC ... South Carolina Department of Health and Environmental Control
IGRA ... Interferon Gamma Release Assay
LTBI ... Latent Tuberculosis Infection
PICOT ... Population, Intervention, Comparison, Outcome, Time
PPD ... Purified Protein Derivative
QFT®-GIT ... QuantiFERON®-TB Gold In-Tube Test
TB ... Tuberculosis
1 CHAPTER 1
INTRODUCTION
Description of Clinical Problem
Occupational health nurses in healthcare settings are challenged with promoting
the health and safety of employees. This includes practicing current evidence-based
interventions to prevent the spread of communicable disease including tuberculosis (TB)
(Massante & Stinson, 2014). Healthcare workers are at increased risk for contracting
mycobacterium tuberculosis (TB) from “sharing air space” with infected patients through
airborne droplet transmission (Jensen, Lambert, Iademarco, & Ridzon, 2006). The
Department of Health and Human Services Centers for Disease Control and Prevention
(CDC) recommends that all healthcare workers receive initial screening for TB upon hire
by a 2-step tuberculin skin test (TST) (Jensen et al., 2006). The TST is performed by
injecting tuberculin purified protein derivative (PPD) intradermally. If someone has been
exposed to TB, they will develop induration at the injection site which is measured in
millimeters in 48-72 hours. According to CDC guidelines for interpretation of healthcare
worker TST results, a reading of >10 mm of induration is positive. However, if the
healthcare worker has HIV or other immune compromised conditions, a positive reading
is > 5 mm of induration. A positive result can indicate active TB, latent TB (LTBI), or
may be due to history of vaccination with Bacillus Calmette-Guerin (BCG) vaccine or
exposure to other non-tuberculin mycobacteria. Healthcare workers are at risk for
2
asymptomatic. Latent TB can be reactivated and the healthcare worker can then spread
infection endangering the safety of patients and the community (Jensen et al., 2006).
There are three main categories of problems with utilization of the two step
tuberculin skin test: extended screening time, noncompliance, and potential inaccuracy in
placement and results. Problems with extended screening time and noncompliance occur
due to the multiple steps that are required to complete the two step tuberculin test. The
two step baseline tuberculin skin test requires 4 steps including: step 1- Intradermal
placement of PPD, step 2- read the result in 48-72 hours, step 3- placement of second step
in 1-3 weeks after the first step, and step 4- read the second step in 48 to 72 hours (Jensen
et al., 2006). If the patient is noncompliant with returning for PPD reading, then the PPD
must be replaced. Accuracy of the two step tuberculin skin test occurs due to variation in
skin test placement, subjective reader interpretation, positive results, and
false-negative results. Proper placement of the TST should include injection of 0.1ml of PPD
solution injected intradermally on the inner forearm creating a pale skin elevation (wheal)
of 6-10 mm. If a wheal does not appear, then the test is incorrectly placed and should be
repeated. Inaccurate placement can lead to false-negative results when an untrained
healthcare worker inadvertently places the skin test too deep or too shallow. Furthermore,
errors in reader interpretation can lead to false-negative or false-positive results.
Tuberculin skin tests results should measure millimeters of induration which is a raised,
palpable area (Jensen et al., 2006). Often, inexperienced readers may inaccurately
measure erythema rather than induration resulting in positive results. These
false-positives may result in unnecessary anxiety for the patient and may lead to the patient
3
contrast, some readers who are inexperienced or who do not understand the importance of
accurate interpretation, may interpret results as negative which are really positive. In this
case, the patient who needs treatment for LTBI will be left at risk for TB activation.
Further compounding problems with false-positive results, tuberculin skin tests also react
to Bacille Calmette-Guerin (BCG) vaccination and other non-tuberculous mycobacteria
leading to false-positives (Swindells, Aliyu, Enoch, & Abubakar, 2009). Additionally,
TST can give false negative results in immune suppressed individuals. In summary, the
two step TST is subject to issues with extended screening time, noncompliance, and
inaccuracies due to required multiple visits, variation in placement and readings, results,
and false-positive or false-negatives (Swindells et al., 2009).
The purpose of this DNP project was to compare baseline testing for new
healthcare employees with QuantiFERON®-TB Gold In-Tube Test (QFT®-GIT) to the
two step PPD TB skin test in regards to tuberculosis screening time, overall onboarding
time, compliance with tuberculosis screening within 10 days of orientation, and costs.
This quality improvement project assessed whether implementation of the QFT®-GIT in
place of the two step TST, met the organizational goal to reduce the number of days to
complete tuberculosis screening, reduce overall Employee Health onboarding clearance
time, and improve compliance with completion of tuberculosis screening within 10 days
of hire date, while maintaining cost-effectiveness.
Scope of the Problem
Tuberculosis remains a major threat in the world with 9 million new cases each
4
annually and 4,100 daily. This represents a 50% decrease in TB deaths globally
(“National Action Plan to Combat Multidrug-Resistant Tuberculosis,” 2015). Death rates
in the United States have fallen below 10,000 annually largely due to implementation of
CDC recommended infection control measures (Jensen et al., 2006; “National Action
Plan to Combat Multidrug-Resistant Tuberculosis,” 2015). In 2015, South Carolina had
104 cases of active TB, and 14 in the Upstate with less than 5 of those being in
Spartanburg, South Carolina with a rate of 1.36 cases per 100,000 (South Carolina
Department of Health and Environmental Services, 2016). Even though death rates are
falling, it is estimated one third of the world’s population are infected with latent TB and
are at risk for converting to active TB. Multidrug-resistant tuberculosis has also emerged
threatening this progress. Action must be taken to prevent the spread of this drug resistant
strain of TB. If efforts to prevent and diagnose latent and active TB are not actively
continued, TB can spread rapidly around the world and to the United States and reverse
decades of infection control measures (“National Action Plan to Combat
Multidrug-Resistant Tuberculosis,” 2015).
Healthcare workers have up to 3 times higher risk of TB than the general
population (Verkuijl & Middelkoop, 2016). The healthcare system accepts patients with
TB and confines noncompliant TB patients for direct observed therapy. The healthcare
system treated two patients with TB in 2015. Employees of the healthcare system may
care for patients whose TB status is initially unknown for several days without
respiratory protection and can unknowingly develop latent TB infection (Kathy Bryant,
personal communication, November 2015). If an employee with undetected latent TB
5
family or community. This can be costly to the organization and the employee. If the TB
strain is drug-susceptible then treatment consists of a four drug regimen for 6 months and
can cost up to $17,000. However, if it is drug resistant, treatment is more complex and
expensive costing $150,000 to $482,000. Compounding drug resistance, adherence to
drug regimens is difficult due to side effects and length of required treatment. If an
employee acquires active TB, then the employee is subject to lost work time up to 4
months accounting for 30 percent of their income (“National Action Plan to Combat
Multidrug-Resistant Tuberculosis,” 2015). Moreover, the organization can incur
additional costs such as increased worker’s compensation benefits and interrupted
staffing schedules or locum tenens coverage. Legally, the organization can also expect
citations or sanctions by DHEC or other regulatory agencies if it is determined that
proper infection control measures were not in place. From a public relations perspective,
the organization may expect a tarnished reputation or at least some employee and public
backlash that may instill a lack of trust or confidence as a healthcare institution or
employer.
Healthcare systems must continue to monitor CDC recommendations and DHEC
regulations to prevent spread of TB. Detection of latent or active TB in new employees
plays a large role in this effort. Healthcare systems are required to maintain stringent
respiratory protection plan that includes appropriate ventilation of TB patient rooms,
N-95 mask fit testing, exposure follow up plans, and periodic testing of employees(Verkuijl
& Middelkoop, 2016). Employee Health staff must refer all employees with positive
tuberculosis screening to the health department for appropriate evaluation and treatment.
6
the organization can reduce the TB burden to the community, patients and employees
(Jensen et al., 2006).
Analysis of Current Practices
The healthcare system currently employees approximately 6,800 employees and
had experienced a 15% employee turnover rate in 2015 and 2016 which led to staffing
issues and utilization of expensive locum tenens temporary contract employees (Kathy
Sinclair, personal communication, March 2016). The hospital has 78 locum tenens
Registered Nurses which costs the healthcare system $119,600 per RN or total 9.33
million annually. Hiring a permanent RN would save $46,782 per position (Rachel
Datillo, personal communication, July 2016). This does not include costs for non RN
locum tenens employees. New hire RN orientation only occurs one time per month. If the
new hire RN orientation is delayed due to incomplete tuberculosis screening or other
requirements in Employee Health, then a locum tenens nurse will need to fill that spot for
another month. The average full time RN salary is approximately $30 per hour, but locum
tenens RNs cost approximately $60 per hour for 160 hours, totaling $10,800 for one
month of locum tenens. Therefore, a one-month delay would cost $5,400 per month
additional to the healthcare system. If only 2 RNs per month have delayed orientation,
this would cost the healthcare system $129,600 per year.
Further contributing to short staffing concerns, the process for hiring positions
requires multiple time consuming steps. Managers must go through a position committee
for approval of any job postings. This process can take 1-3 weeks or more. Recruitment
7
to the manager for review which can take 1-2 weeks or more. The Manager must then
conduct interviews and select the candidate. Recruitment must then obtain the pay rate
from the compensation department and negotiate the offer with the candidate which can
take a few days. The average amount of days it takes to fill positions from job posting to
job offer in 2015 was 51 days (47 for RNs), and the January to February 2016 average
was 58 days (Rachel Dattilo, personal communication March, 2016). The 2016 days to
fill job offers ended wrapped up at 47 days compared to the national standard of median
of 48 days (Rachel Dattilo, personal communication, March 2017). Following this, it can
take 1-2 weeks to get an appointment in Employee Health for pre-placement assessments.
Once the new employee has an appointment in Employee Health, it could take 3 days to
30 days to clear the employee for orientation. Clearance for orientation includes, health
assessment, labs, immunization titers, drug screens, tuberculosis screening, review of
medical records, and in some cases pre-work screen lift tests and fit for duties with a
provider. This process could take 2 to 30 days with the Fall 2015 average being 15 days
from time of first appointment to health clearance for orientation. Orientation only
occurred twice per month except for RNs which was monthly, and new hires were
required to attend. It was requested that new hires come to Employee Health at least 10
days prior to orientation, so that orientation will not be delayed due to waiting for drug
screen results, for completion of 2 step PPD tuberculin skin test, and fit for duty
appointments. If drug screen results were not back in time, fit for duties are not
completed or the employee does not complete the PPD tuberculin skin test process prior
to orientation, then the employee would not be able to start work until the next orientation
8
management asked the Employee Health department as well as Recruitment to assess
procedures for expediting new employee total onboarding time.
The healthcare system Employee Health examined its processes to determine
measures to contribute to this reduction in new employee onboarding time. In 2015,
Employee Health screened approximately 100 to 125 new hire employees monthly.
Employee Health completed tuberculosis screening with the two step PPD skin test. This
process took 2-4 visits and sometimes took 10 days to 4 weeks or more to complete. The
first visit took approximately 2 hours and cost $48.70 in staff time (5 min for PPD
placement is $2.58 of time) plus $4 for the PPD test and 0.36 for the syringe and needle.
This does not include the cost for other supplies, and lab processing. The second visit for
PPD reading number one cost $10.15 in staff time. The third visit which would include
PPD placement number 2 and lab result review cost total $10.15 in staff time (5 min of
time for the PPD placement) plus $4.36 for PPD. The fourth visit which would include
PPD reading cost approximately $10.15 in staff time (see Table 1.1). New employees
were required to have at least 1 PPD skin test placed and read prior to orientation. New
employees sometimes failed to return for first PPD reading which resulted in the need for
replacement and delay in orientation. Therefore, if the new employee failed to complete
this first skin test prior to orientation, then the employee could not start work for 2 or
more weeks, or 1 month for RNs. The second step of the tuberculin PPD skin test is also
problematic. New employees were required to have the second PPD skin test placed and
read within 10 days of orientation. However, 6-10% of new employees do not return for
this second PPD which caused Employee Health staff to spend additional time contacting
9
RN spent 15-30 min per noncompliant new hire employee contacting the employee and
scheduling another visit, it cost approximately $7.75-$15.50 in salary time per person that
is non-compliant. If the average non return rate of 10% which would result in $1,550 -
$3,100 cost for contacting approximately 200 new hires to reschedule visits. An extra
PPD placement visit cost $14.51 per person or $2,902 for 200 new hires in staff time and
supplies. This figure grows if you consider the costs of replacing 10% of 6,800
employees for annual PPD skin tests. Noncompliance with completion of two step PPD
within 10 days of orientation can also result in citation by the Department of Health and
Environmental Services (DHEC), or other regulatory agencies (Jensen et al., 2006).
Recent DHEC surveys have resulted in survey staff questioning Employee Health’s past
practice of not reading step one. one A DHEC survey discovered one second step PPD
not being read which could result in citation or penalty. A citation will reflect negatively
on the organization and Employee Health. In fall of 2015 and early 2016, the Employee
Health department reevaluated current practices and implemented processes to expedite
new hire onboarding time, reduce tuberculosis screening time, improve new hire and
manager satisfaction, and streamline processes. Some of these changes included adding
appointment times, additional staffing, and renovation of a storage room to create another
exam room. However, the largest change was implementation of an IGRA for
tuberculosis screening.
Employee Health began verifying all positive tuberculin skin tests with a
QFT®-GIT approximately 2 years before implementation of this study at the advice of the local
department of health. If the test and symptom review were negative, then the employee
10
also utilized for tuberculosis screening for new employees who reported a history of a
positive tuberculin skin test, but who did not have proper documentation. Staff were
already familiar with the test and a contract was already in place with a local lab called
external Lab. The initial cost for QFT®-GIT was $85 per test.
Table 1.1
Costs per Visit for New Hire Screening in Employee Health
Employee Health average staff salary
RN $31
OHT $14
Clerical $14.79
LPN $20
Visit 1 Costs
Clerical 15 min $3.70 OHT 1 hr. $14.00
RN 1 hr. $31.00 (PPD placement, 5 min, $2.58)
Plus PPD cost $4.36
Total visit 1 $53.06
Visit 2 Costs
Clerical 5 min $1.23
OHT 5 min $1.17
RN 15 min $7.75
Total visit 2 $10.15
Visit 3 Costs
Clerical 5 min $1.23
OHT 5 min $1.17
RN 15 min $7.75 (PPD placement, 5 min, $2.58)
Plus PPD cost $4.36
Total visit 3 $14.51
Visit 4 Costs
Clerical 5 min $1.23
OHT 5 min $1.17
RN 15 min $2.58
11
Total costs all 4 visits (cost of labs excluded) $87.87
Annual cost new hire visits 2,000 new hires per year $175,740
Missed visits 10% average (10% of average 2,000 new hires annually) Contacting noncompliant patient staff time 30min15.50 = $3,100 per year
Cost of one Replacement visit $14.51 per patient = $2,902 Additional Cost of visits for noncompliant 200 employees = $6,002
Total costs new hire screening including noncompliant $181,742
Practice Innovation
Tuberculin skin test was the only available test for TB screening until 2001 when
Interferon gamma release assays (IGRA) were developed. Interferon gamma release
assay are blood tests for TB which specifically measure interferon-gamma which is
released by T cells in response to tuberculosis antigens (Swindells et al., 2009). The first
approved IGRA was the QuantiFERON®-TB test (QFT®) in 2001, followed by the
QuantiFERON®-TB gold test (QFT®-G) in 2005, QuantiFERON®-TB Gold In-Tube
(QFT®-GIT) test in 2007 and the T-SPOT® in 2008. In 2010, the CDC published
updated guidelines for use of IGRA’s and approved both the QFT®-GIT and the
T-SPOT®. TB for healthcare worker TB screening (Mazurek et al., 2010). IGRA’s can
potentially overcome issues with TST tuberculosis clearance screening time and
compliance, as well as problems with inaccurate results. In contrast to TST, IGRA’s do
not react to nontuberculous mycobacteria or BCG vaccination. IGRA’s can also be
completed in one visit and eliminate the need for multiple visits. Furthermore, IGRAs
have been found to have a higher correlation to TB exposure than TSTs improving
accuracy. IGRA’s are more expensive than TST’s, but utilization is expect to reduce
12
compliance follow up, and potential DHEC citations for organization noncompliance
(Mazurek et al., 2010).
When a person is exposed to TB, they develop a white blood cell response
(WBC). When white blood cells are re-exposed to TB, they secrete a small amount of
interferon-gamma (TFN-ƴ) protein in response. The QFT®-GIT measures the TFN-ƴ
protein response which is a marker for cell mediated immune response to mycobacterium
tuberculosis. The procedure for testing includes drawing one milliliter of blood is
collected in 3 tubes including the nil (negative control), TB antigen, and mitogen
(positive control). The antigen peptides include ESAT-6, CFP-10, and TB7.7. All tubes
are gently shaken 10 times and must be transferred to a 37ºC+ 1 incubator within 16
hours. Results are measured by TB antigen minus nil and positive is > 0.35 IU/ml. The
advantages of this test include completion in one visit, result is unaffected by BCG
vaccination, test has positive and negative controls, and interpretation of results is
objective (Nienhaus, 2013).
A potential barrier to implementation of IGRAs is the high cost of the lab test.
The healthcare system microbiology department lab manager was contacted in 2015 to
investigate the costs and acceptability associated with implementation of the QFT®-GIT
or the T-SPOT®.TB for all new hires. The manager advised that the QFT®-GIT would
be preferred for the healthcare system due to availability of a local external lab that is
already conducting the test for the organization. This external lab has staff that are
experienced with the testing and are better able to have consistent test performance than
the in house lab. Experienced lab personnel conducting the test will ensure accurate,
13
would require extra staff time for packaging to ship. It was discussed that the lab would
have adequate facilities for incubating the tubes of blood (Frankie Rice, personal
communication, September 2015). With the assistance of the lab manager, the price for
the QFT®-GIT was negotiated from $85 to $53. While the QFT®-GIT is more expensive
than the PPD, cost savings is found when you factor in staff time, and cost savings from
not having delays in orientation, decreasing the amount of time locum tenens staff are
utilized, and avoiding regulatory penalties. Onboarding just 2 full time RNs 1-month
sooner every month would save the organization $129,600 in salaries. Another advantage
of utilizing the QFT®-GIT is that new hire visits can be completed in 1 visit and
therefore reducing Employee Health workload and reduced salary costs to track down
each non-compliant new hire. Reducing each new hire visit from 4 to 1 visit opened up
additional available appointment times for new hire and other visits increasing visit
volume capacity in Employee Health. Potentially, this decrease in number of required
visits would also improve new hire satisfaction with the process. Cost of implementation
of QFT®-GIT can be a barrier or a benefit, while process improvement is a potential
benefit for new hires and Employee Health staff.
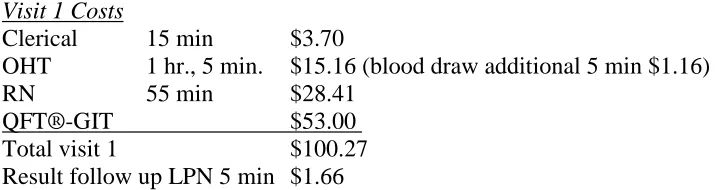
Table 1.2
Estimated Cost for New Hire screening with QFT®-GIT
Visit 1 Costs
Clerical 15 min $3.70
OHT 1 hr., 5 min. $15.16 (blood draw additional 5 min $1.16) RN 55 min $28.41
QFT®-GIT $53.00
Total visit 1 $100.27
Result follow up LPN 5 min $1.66
14
Total cost 2,000 new hires annual with QFT® $203,860
Minus Cost of one locum tenens RN per month delayed by 2 step $64,800
Total annual cost of new hire screening $139,800
Minus cost of two locum tenens RN monthly due to delayed orientation -$129,600
Total annual cost of new hire screening $74,260
Comparison
Annual cost new hire screening
with 2 step PPD $175,740 with QFT® $74,240
Purpose
The purpose of this DNP project was to compare baseline testing for new
healthcare employees with QuantiFERON®-TB Gold In-Tube Test (QFT®-GIT) to the
two step PPD TB skin test in regards to tuberculosis screening time, overall onboarding
time, compliance with tuberculosis screening within 10 days of orientation, and costs.
This quality improvement project assessed whether implementation of the QFT®-GIT in
place of the two step TST, met the organizational goal to reduce the number of days to
complete tuberculosis screening, reduce overall Employee Health onboarding clearance
time, and improve compliance with completion of tuberculosis screening within 10 days
of hire date, while maintaining cost-effectiveness.
Project Question/PICOT
As a foreground question, among all adult newly hired healthcare employees at a
healthcare system, how does baseline testing with QuantiFERON®-TB Gold In-Tube test
(QFT®-GIT) compare with two step PPD TB skin test in regards to time for completion
of tuberculosis screening, overall onboarding screening time, and compliance with
15 Table 1.3
PICOT
_________________________________________________________________ PICOT PICOT components
_________________________________________________________________ Population New hire employees at Spartanburg Regional Healthcare System
Intervention QuantiFERON®-TB Gold In-Tube test (QFT®-GIT) for TB screening
Comparison 2 step tuberculin PPD skin test for TB screening
Outcome Reduction in completion time for TB screening reduction on overall onboarding time, and increased compliance with completion within 10 days of orientation
Time 2 months: chart review of 2 months with 2 step PPD standard of care, compared to 2 months with QFT®-GIT
__________________________________________________________________ PICOT definitions (Melnyk & Fineout-Overholt, 2015)
Table 1.4
PICOT Definitions
Key Terms Definitions
New Hire Employee Any person newly hired to work scheduled for
health assessment in employee health after offer, prior to orientation.
QFT®-GIT QuantiFERON®-TB Gold In-Tube blood test screening for latent tuberculosis infection
PPD Purified protein derivative intradermal skin test for TB screening
Tuberculosis screening Time for employee to complete TB screening. For Tb skin test- time from first skin test to reading of second test. QFT®- time from lab draw to result.
16
placement and reading or QFT®-GIT result, drug screen result, lab results, pre-work screen, fit for duty,
documentation, fit for duties
Compliance Completion of PPD skin test or QFT®-GIT TB screening within 10 days of orientation. Also, completion of
Chest X-Ray and/or retesting prior to orientation if + PPD or QFT®-GIT.
________________________________________________________________________
Assumptions
It was assumed that the new employee, employee health employees as well as
hospital administration prefer for the amount of time it takes to clear employee health
prior to orientation to be as short as possible. It was inferred that other healthcare
organizations will prefer this shortened time as well. Another assumption is that the
procedures in the hospital lab and external lab will be standardized and followed. It was
assumed that laboratory staff were proficient and have achieved competency in all
procedures for QFT®-GIT and lab equipment is in working order. It was assumed that
lab interpretation of positive or negative results was accurate. Likewise, it was assumed
the Chest X-ray procedures and interpretation was accurate.
The Centers for Disease (CDC) is recognized as national experts in tuberculosis
control. It was assumed that this is true and that recommendations from CDC are best
practice. Likewise, it was assumed that DHEC regulations are best practice and
17 Summary
The healthcare system is required to complete tuberculosis screening on all new
hire employees through tuberculin skin tests or blood assays for mycobacterium
tuberculosis (Jensen et al., 2006). Employee Health has traditionally completed the 2 step
PPD as a method of screening all new hires. Processes for completion of this 2 step
process can be problematic due to compliance with visits, and false-positives due to BCG
vaccination or reader interpretation. The 2 step PPD can take 10 days to weeks or longer
to complete delaying orientation dates for new hires. Employee health was tasked with
review of regulations and processes to expedite new hire clearance. Tuberculosis
screening was targeted in this process review. QuantiFERON ®-TB Gold In-Tube test is
a blood test for latent TB and was identified as a possible method to overcome barriers to
TSTs and would help expedite new hire clearance (Mazurek et al., 2010). Tuberculosis
remains a threat to employees and to the community (South Carolina Department of
Health and Environmental Services, 2015). Early detection of TB is essential to stop the
spread of TB (“National Action Plan to Combat Multidrug-Resistant Tuberculosis,”
2015). This project examined whether baseline testing with QuantiFERON®-TB Gold
In-Tube test would reduce tuberculosis screening time, overall onboarding time, and
improve compliance while remaining cost effective in comparison to the 2 step PPD skin
18 CHAPTER 2
LITERATURE REVIEW
Introduction
A literature search was conducted in order to determine if a blood assay for
mycobacterium tuberculosis would be acceptable for implementation of tuberculosis
screening of new hires in a healthcare system Employee Health in place of the two-step
PPD skin test. The primary purpose of the literature review was to answer the PICOT
question: As a foreground question, among all adult newly hired healthcare employees at
a healthcare system, how does baseline testing with QuantiFERON®-TB Gold In-Tube
test (QFT®-GIT) compare with two step PPD TB skin test in regards to time for
completion of tuberculosis screening, overall onboarding screening time, and compliance
with screening within 10 days of orientation over a 2-month time frame? The literature
review focused on articles that pertained to healthcare workers and screening in low
incidence countries since the United States is considered to be low incidence overall. The
healthcare system was considered to be low risk by CDC standards, however has been
medium risk in the past. Therefore, studies that included medium or middle tuberculosis
incidence were included in the review. The literature review examined whether blood
assays for tuberculosis met with CDC and DHEC regulations, would be more efficient
than the two-step tuberculin skin test process, have equal or better accuracy than TSTs,
19 Literature Search Strategy
In order to make evidence-based practice change, clinicians should conduct a
thorough search of peer-reviewed research (Melnyk & Fineout-Overholt, 2015). Thomas
Cooper Library database links were used to browse different databases including
CINAHL, PubMed and Science Direct. Keyword searches included a combination of
IGRA, Interferon gamma, tuberculosis screening, quantiferon, employee, healthcare
worker, and tuberculosis (see table 4). An initial search on Science Direct of “IGRA”
revealed too many results which needed to be filtered to obtain applicable evidence. A
search on Science Direct for keywords “Tuberculosis screening” and “employees”
revealed 2,095 results. When this result was filtered for 2010-2016 there were 32 articles
found, but these did not meet the inclusion criteria. Science Direct was searched for
Quantiferon which revealed 2,181 results. Many of these results were not specifically
about quantiferon and some were in other languages. The search was for 2016 and found
65 results. The strategy was adjusted and this author searched keywords “quantiferon”
and “employee”, 2008 to present and found 87 results with a few relevant articles. Then
PubMed was searched for keywords “IGRA” and “Tuberculosis” and found 596 results.
Filters of 5 years and newer was then added which narrowed it to 450 results. When a
third keyword of “employee” was added in addition to “IGRA” and “Tuberculosis”,
PubMed revealed 4 results with 1 applicable study. PubMed was searched for keywords
“Quantiferon” and “healthcare workers” for the most recent 5 years and found 77 results.
CINAHL proved to be the most user friendly for this author and all of the above the
search strategies were utilized with multiple results found. A search for keywords
20
specific search that was helpful was “tuberculosis” and “employee” and “interferon
gamma” which revealed 10 good results (see Table 2.1). Reference lists from the
reviewed articles were also utilized to identify a few selected articles. Any articles that
this author could not find full text articles for were obtained through the Thomas Cooper
Library interlibrary loan request. During the course of the peer review, this author
contacted South Carolina Department of Health and Environmental Control (DHEC) for
guidance regarding a cluster of positive QFT®s with borderline results. The Columbia
DHEC office referred this author to Dr. F Richard Ervin, regional TB clinician district 4
who emailed relevant articles regarding QFT® cutoff and conversions which was
incorporated into the table (Dr. F Richard Ervin, personal communication, March 2016).
Initially selected articles included approximately 40 articles that were reviewed and
ultimately included 23 articles that were included in this evidence table (see appendices
A).
Table 2.1 Keywords
Keyword Combination of keywords
IGRA IGRA and Tuberculosis
Tuberculosis screening Tuberculosis screening and employees Quantiferon Quantiferon and employee
Employee Quantiferon and healthcare worker Healthcare worker Tuberculosis and IGRA
Tuberculosis IGRA and tuberculosis and employee
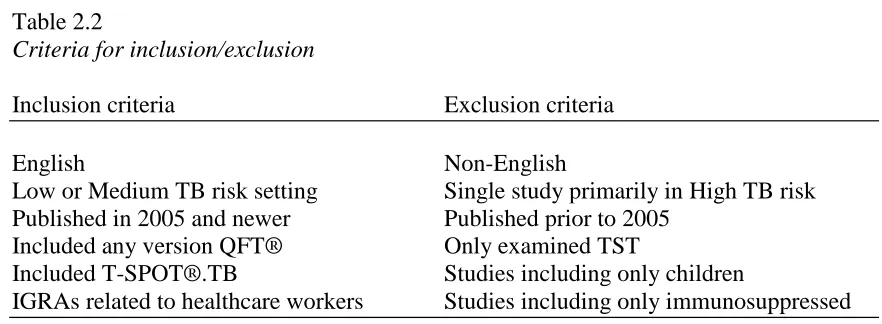
21 Table 2.2
Criteria for inclusion/exclusion
Inclusion criteria Exclusion criteria
English Non-English
Low or Medium TB risk setting Single study primarily in High TB risk Published in 2005 and newer Published prior to 2005
Included any version QFT® Only examined TST
Included T-SPOT®.TB Studies including only children
IGRAs related to healthcare workers Studies including only immunosuppressed
Inclusion criteria included studies published in English conducted in low or
medium TB incidence settings from 2005 to present with relevant information to IGRA
testing in healthcare workers including QFT®, QFT®-TB Gold, QFT®-GIT, or
T-SPOT®.TB. Studies were excluded that were conducted primarily in high TB incidence
settings, did not include healthcare workers, were published in other languages, and those
that were primarily about children or immune compromised patients (see table 5). The
Centers for Disease Control updated guidelines were examined first to determine if
utilization of Interferon Gamma Release Assays (IGRA) would meet required regulations
before proceeding with the PICOT and literature search (Mazurek et al., 2010). Initially
this author tried to limit articles to 5 years but did not find the required number of
relevant articles. Since the QuantiFERON®-TB Gold was developed in 2005 and the
CDC guidelines were written in 2005, articles were limited to those published in 2005 to
present with focus on newer articles. The main inclusion articles of interest were studies
that examined baseline IGRA testing of healthcare workers. Articles were included that
examined IGRA alone with single or multiple retests, or IGRA with Tuberculosis skin
non-22
healthcare workers were excluded unless this was a small portion of a larger study.
Studies were included that examined IGRAs in low or moderate incidence countries since
the setting for this project is in a low to medium TB risk setting. Studies that looked at
IGRAs in high-incidence settings or countries were excluded unless they were part of a
larger study that also included low-incidence setting. Articles on cost-effectiveness of
IGRAs were also included in order to examine financial feasibility for the project. There
were not many articles directly related to new hire tuberculosis screening time and
compliance, but two specific ones were found. Due to the concern regarding
false-positives and at the direction of DHEC, studies regarding QFT®-GIT cutoff values and
retesting were included (see Table 2.2). Overall, there was good evidence to continue on
with the PICOT question and study (see Appendices A for full evidence table).
Literature Analysis
Twenty-three studies were included in the review of the literature. The articles
were classified into levels I through IV according to John Hopkins Research and
Non-Research evidence appraisal tools (Dearholt & Dang, 2012). Level I includes
experimental studies, II quasi-experimental, III Non-experimental, IV clinical practice
guidelines, consensus or position statements, and level V literature review, expert
opinion, community standard, clinician experience, and consumer preference (see
Appendices B for level and quality guide). Of the 23 articles analyzed there were four
level II articles, seven level III, two level IV, and 10 level V (see Table 2.3). Quality of
the articles were also analyzed as shown in table 5 according to John Hopkins appraisal
tools with ratings of A- high quality, B- Good quality, and C- Low Quality (Dearholt &
23
two in Germany that report that the study was conducted in low incidence settings (Diel,
Loddenkemper, Meywald-Walter, Gottschalk, & Nienhaus, 2009; Schablon, Nienhaus,
Ringshausen, Preisser, & Peters, 2014). Most of the studies focused on healthcare
workers with the exception of 4 studies that included healthcare workers as well as other
groups such as close contacts but all were published in English (Banaei, Gaur, & Pai,
2016; Diel et al., 2009; Pai, Zwerling, & Menzies, 2008; Rangaka et al., 2012). The 23
articles were published by 18 different journals or sources (see table 2.4). The articles
reviewed were classified according to type of study which includes quality improvement,
clinical practice guidelines, quasi-experimental, systematic review, financial, program
evaluation, expert opinion/literature review, and case report (see table 2.5).
Table 2.3
Quality Ratings per evidence level
# of Articles in Quality Rating
Level A-High B-Good C-Low
II 1 3 0
III 3 4 0
IV 2 0 0
24 Table 2.4
Journals/Sources
American Journal of Respiratory Critical Care Medicine 2
Annals of Internal Medicine 1
Archives of Internal Medicine 1
BMC Health Services Research 1
Chest 2
Infection Control & Hospital Epidemiology 1
Journal of American College Health 1
Journal of Clinical Microbiology 1
Journal of Hospital Infection 1
Journal of Occupational & Environmental Medicine 1
Journal of Occupational Medicine & Toxicology 1
Lab Medicine 1
Lancet Infectious Disease 1
MMWR 2
PLoS One 1
Qiagen 2
Thorax 1
Workplace Health & Safety 2
Total 23
Table 2.5
Categories of Articles Total
Case Report 1
Clinical Practice Guidelines 2
Correlational 1
Expert Opinion/Lit. review 3
Financial 1
Program Evaluation 2
Quality Improvement 3
Quasi-Experimental 4
25 Evidence level II, high quality (A) articles.
A longitudinal study of healthcare workers at four organizations undergoing
tuberculosis screening from February 2008 through march 2011 was conducted (Dorman
et al., 2014). The purpose of this study was to assess the performance of IGRAs for serial
testing of healthcare workers compared to tuberculin skin test (TST). The sample
included 2,563 healthcare workers in Denver, Colorado; Houston, Texas; Baltimore,
Maryland; and New York City. Healthcare workers with a history of TB, TST within the
past 6 months, and those with history of anaphylactic reactions to TST reagents were
excluded from the study. Initially participants were interviewed regarding demographics,
occupations, TB exposure, history of LTBI and BCG status. Then blood was drawn for
T-SPOT®.TB and QFT® followed immediately by TST. Participants had a second TST
in 1-3 weeks if they did not have another TST in the past 12 months. Participants had
repeat interview, QFT®, T-SPOT®.TB and TST at 6, 12, and 18 months. Those with a
positive TST were asked to have a repeat TST. There was a sub-study wherein
participants had blood drawn two weeks apart without a TST in-between and by drawing
two sets during a single blood draw. It is important to note that mid-study, participants
had repeat ELISA testing for all positive tests because there was a higher than expected
rate of conversion. Another sub-study was conducted in which participants with baseline
negative IGRAs had repeat IGRA in 7-21 days. Statistical analysis included K coefficient
for agreement, two-proportion Z-test for independent proportions and McNemar’s test for
dependent proportions. Multiple comparisons were assessed by Holm-Bonferroni method
and mean changes were compared by t test. Linear mixed-effects models were used and
26
(138 of 2,263) conversion rate for QFT®-GIT, 8.3% (177 out of 2,137) conversion for
T-SPOT®.TB, and 0.9% (21 out of 2,293) for TST. There was a statistically significant
difference in conversion rate of QFT®-GIT compared to TST (p<0.001). Baseline testing
results showed 125 positive TSTs (5.2%), 118 positive QFT®-GIT (4.9%) and 144
positive T-SPOT®.TB (6.0%). The rate of positives in the IGRA groups was not
significantly higher than the TST groups. Agreement of test results for those with triple
positives was high with agreement between TST and QFT®-GIT 93.2%, 91.2% for TST
and T-SPOT®.TB, and 93.8% between QFT®-GIT and T-SPOT®.TB (95% CI for all
comparisons). There was a higher rate of baseline positive TST and negative IGRAs in
BCG vaccinated participants (odds ratio 33.4). There was a 53.7% reversion of baseline
positive TSTs in 29 out of 54 participants. Likewise, there was baseline reversion from
positive to negative for QFT®-GIT of 56.8% (67 of 118) and 63.9% for T-SPOT®.TB
(92 of 144) without statistically significant differences in comparison between the groups.
Those with higher baseline values for QFT®s had lower rates of reversions but there was
no difference in the T-SPOT®.TB group. Test conversions during this study were 0.9%
for TST, 6.1% QFT®-GIT, and 8.3% for T-SPOT®.TB which was significant for TST vs
QFT®-GIT and for T-SPOT®.TB (p<0.001) but no significant difference between
QFT®-GIT and T-SPOT®.TB. When converters were retested in 6 months, 76.4% (81 of
106) QFT®-GIT positive tests reverted and 77.1% (91 of 118) of T-SPOT®.TB. It is
important to note that not one participant converted in all three tests at once and there was
no association with TB exposure for any of the conversions. In the sub study that was
retested in 2 weeks, 7.5% of QFT®-GITs changed from negative to positive and 8.1% for
T-27
SPOT®.TB respectively. In the sub study that had two sets of blood drawn in one visit,
there were discordant results in 5.8% for QFT®-GIT and 6.5% for T-SPOT®.TB (p=.39).
When a subset of samples was retested by ELISA in 8 days, all negatives remained
negative, but 27 out of 114 positives turned negative. An intervening TST boosted
QFT®-GIT in 9.1% and 11.3% for T-SPOT®.TB and those with baseline positive TST a
boosting affect. The authors conclude that conversions of IGRAs over 18 months
occurred 6-9 times more often than TST which demonstrates false-positives and a need
for retesting of converters. The authors did not feel that changing the cut point would be
helpful since this only attributed to 15-18% of conversions in this study (Dorman et al.,
2014).
The prospective study by Dorman et al. (2014) is a level II comparative study,
quality A high study. This is an example of a prospective comparison study of which
there are few for IGRAs. The authors analyzed several conversion factors by statistical
methods. The sample size was sufficiently large and spanned different areas of the US
but each were in larger metropolitan areas. The authors report the limitations of limited
generalizability to groups with immunosuppression and limited generalizability for other
higher incidence countries. There was also some attrition in the TST repeat groups
(Dorman et al., 2014). This study was very thorough and has good applicability to this
project. However, this study does point to the necessity for retesting of any positive
28
Evidence level II, Good quality (B) articles.
The Switch study was conducted to determine what cost an IGRA would need to
be in order to cost less overall than the tuberculin skin test for health care employees
(Wrighton-Smith, Sneed, Humphreys, Tao, & Bernacki, 2012). All of the actual costs for
materials and employee health staff labor costs involved with tuberculosis screening were
gathered from a large healthcare facility’s finance records. The setting was John Hopkins
in Baltimore, Maryland that screens about 18,000 employees annually with the TST.
Secondarily, 393 random employee encounters were selected for time motion study to
measure the time it takes to complete each step with the TST including data entry as well
as time for the IGRA lab draw as well as how much time away from work the employee
had to take for testing. This study also randomly invited new hire and annual employees
to participate in parallel testing of T-SPOT®.TB and TST with a total sample of 750 (473
annual, 270 new hires). Of the 113 employees (69 foreign born) with a previous history
of positive TST, two thirds had negative IGRA. The nonreturn rate for TST was 10%,
while only 0.4% of IGRA results were unavailable. The IGRA test also showed a lower
rate of positive results than the TST in new hires. Questionnaires completed by
participants revealed that 62.3% preferred the IGRA to the TST. The cost model revealed
that when considering non return rates, the average cost for TST for annuals was $73.20
and $90.80 per new hires. The IGRA costs overall $78.05 per annual screening when
adding in labor and supplies, and $64.47 for new hires. The IGRA would save money if
the test costs $54.83 or less per test for each new or current employee. A sensitivity
analysis was also conducted to determine which of 38 variables had the most effect on
29
cost. Labor costs would impact the overall cost due to higher costs for time off work. If
employees made 20% higher salaries, then IGRA would save money if it was $61.16 per
test (p value not provided). The sensitivity analysis of variables was shown in a bar graph
and statistical significance was not revealed. In conclusion, the authors report that the
IGRA saves money and improves compliance rates for health care employee tuberculosis
screening (Wrighton-Smith et al., 2012).
This Switch study was rated level II and quality B. The strengths of this study
include that the study did have some elements of random selection and it did a parallel
comparison of the TST and T-SPOT®.TB. The study also supports the conclusion that
non-return rates for the TST affect cost. There may be potential bias in this study since
the manufacturer of T-SPOT®.TB, Oxford Immune provided the test free of charge and
provided John Hopkins a grant of $49,300 for the study (Wrighton-Smith et al., 2012).
The salaries had to be weighted and estimated to give an estimate of the average hourly
wage. This could have skewed the results. A more accurate direct measure would have
been to use the exact salary of each participant. The authors report the limitation that the
study considered the TST and IGRA to be equally accurate. Descriptive statistics were
described, rather than statistically significant testing. This is probably not necessary for
the cost result, but would be important to ascertain for parallel testing of results. Overall,
this is a good study to support this project.
Cummings et al. (2009) conducted a study of newly hired healthcare workers at
West Virginia University prospectively comparing the tuberculin skin test and
QFT®-GIT. A convenience sample of 182 out of 266 invited new hires from June 2007 to
30
a TST. The QFT®-GIT was drawn first, followed by the first TST up to 3 weeks later,
followed by a second QFT®-GIT and second TST if needed 1 week later. A unique
feature of this study was that any indeterminate or positive QFT®-GIT was retested in
the lab by ELISA. If the positive results agreed, then the result was confirmed. If the
results did not agree, a third test was conducted and the mean of the values was used. In
order to determine specificity, the study assumed that participants who had no risk factors
for TB did not have latent TB. The study used mixed-model repeated measure analysis of
variance (ANOVA) to compare results of first and second QFT®-GIT results and timing
of TST was considered as a variant. The sample included 96% born in the US, 93%
without BCG vaccination, and 62% having no risk factors reported for TB. For initial
testing, the TST and QFT®-GIT had 96% agreement of negative results (both results
were negative) but no agreement on positive results (none had both positive TST and
QFT®). It was determined that specificity for the TST was 99% and QFT®-GIT 98% for
healthcare workers that reported no risk factors. Eighty-five participants completed the
second blood test and out of these two of the participants with initial negative QFT®-GIT
results had subsequent positive results. The authors considered both blood test results and
found that 4 had positive blood tests but negative TST, while 3 had positive TSTs but
negative QFT®-GIT results. Only one participant had both a positive QFT®-GIT and
TST. Sixteen indeterminate results were repeated in the lab by ELISA and 11 remained
indeterminate while 5 were negative. The study found that employees with diabetes or
who were on immunosuppressive therapy had greater odds of having an indeterminate
result (rate 6.8, 95% confidence interval). Out of the 5 positive results, 2 were confirmed
31
and second QFT®-GIT results. The INFƴ result for participants that had only 1 TST
showed a mean increase of 0.02 which was statistically different (p=.04). The authors
conclude that overall agreement and specificity for the TST and QFT®-GIT was good
due to the fact that there was a high rate of negative results, but positive results did not
agree. Retesting of samples in the lab may improve diagnostics due to the reversion of
follow up testing. There was a small boost in IFN-ƴ results from the TST which may
limit testing. Immune status of participants should also be considered due to increase in
indeterminate results. The authors state that the QFT®-GIT may be beneficial due to
fewer visits required for QFT®-GIT as compared to multiple visits for the TST
(Cummings et al., 2009).
This study by Cummings et al. (2009) is level II with rating of good quality. The
study is good in that it compared both QFT®-GIT and TST tests and included statistical
analysis. The authors have clear discussion of the results, but do not assert which testing
is recommended. However, the study had important findings to consider when
determining whether to retest employees when QFT®-GIT are positive or indeterminate.
This setting is low- incidence which is relevant to this project, but would limit
generalizability to other settings. A limitation is that the study lacks randomization and
only 47% returned for the second blood rest resulting in attrition bias (Cummings et al.,
2009). The authors assumed that employees without risk factors for tuberculosis did not
have LTBI which could have skewed results. The sample included 96% United States
born and 93% did not have BCG vaccination which could limit generalizability to other
32
Diel, Loddenkemper, Maywald-Walter, Gottschalk, and Nienhaus (2009)
conducted a study to assess agreement between the QFT® and T-SPOT®.TB in
comparison to people with positive TSTs who had recently been exposed to tuberculosis.
The sample included 2,004 people who were close contacts of patients with culture
confirmed tuberculosis, which were reported to the Hamburg Public health department
from December 2006 through February 2008. Six people were excluded from the study
because they had already had contact investigations, and seven did not follow up for
testing. Eight hundred and forty-two contacts tested positive by TST and had subsequent
QFT® and SPOT®.TB testing. Twenty- two were eliminated because the
SPOT®.TB could not isolate sufficient lymphocytes. Results were indeterminate for 7
T-SPOT®.TB and 1 QFT®. The final sample was 812 TST positive contacts who were
exposed to 123 tuberculosis patients. The results revealed 245 (30.2%) positive QFT®s
and 233 (28.7%) positive T-SPOT®.TB. The rate of negative IGRA results significantly
increased in the BCG vaccinated groups with 140 negative T-SPOT®.TB (versus 93
positive) and 146 negative QFT®s (versus 99 positive) (p<0.0001). Statistical analysis
revealed high agreement between the QFT® and T-SPOT®.TB with k value of 0.852,
95% confidence interval. Furthermore, QFT® and T-SPOT®.TB were more statistically
likely to be positive if the patient coughed in the presence of the contact (p<0.0001 for
each). There was also a statistically higher rate of IGRA positive results for those with
higher exposure time (p<0.0001) and those with contact with AFB positive patients
(p<0.0001). Those with exposure >40 hrs. to AFB positive patients had a 6 times higher
positive rate than those with < 8 hours of exposure and twice as likely in the AFB smear
33
association with positive IGRAs. Those with TST result of >15 mm had 68.3% positive
QFT® and 87% for T-SPOT®.TB. However, this agreement decreased to 56.7% and
54.4% for patients with TST positive results of 11-15 mm and decreased further to 14.2%
and 12.9% for those with TST of 6-10 mm. Multiple regression analysis showed a
statistically significant relationship between increase age (p=.003), and foreign birth
(p<0.001), source AFB-positive contacts (p<0.001) and positive QFT® and
T-SPOT®.TB results. Overall, the QFT® and T-T-SPOT®.TB had good agreement of 93.9%
and were associated with increasing exposure risk factors. Metanalysis revealed the
QFT® to be more specific for active TB than the T-SPOT®.TB but less sensitive,
however in actuality there were more positive QFT®s found than T-SPOT®.TB.
Specificity of the TST was poor (64.5%) for those with TST cutoff of >5 mm if you
consider that patients with positive results to both QFT® and T-SPOT®.TB had true
infection. The authors conclude that the QFT® or T-SPOT®.TB is more accurate
indicators of LTBI than TST and utilization would decrease the number of patients with
suspected LTBI by 70% (Diel et al., 2009).
The article by Diel et al. (2009) is rated level II, good quality. There is excellent
prospective comparison of the TST and QFT® and T-SPOT®.TB. Not many studies have
conducted these analyses with statistically significant results. This was a convenience
sample which can lead to some selection bias. There was just a small attrition in this
study. Multiple statistical tests were applied which result in statistically significant results
by chance (Melnyk & Fineout-Overholt, 2015). This article is relevant to this project in
34
Evidence level III, high quality (A) articles.
Schablon, Nienhaus, Ringshausen, Preisser, and Peters (2014) performed a large
scale study of serial QuantiFERON® Gold in Tube (QFT®) tests on 3,823 healthcare
workers in Germany. Participants included a convenience sample selected by
occupational health physicians from 32 different hospitals, nursing homes and out-patient
centers from 2006 through 2013. Each participant signed a written informed consent and
physicians collected information regarding age, gender, reason for the test, exposure to
TB, work history, history of TB, birth country, and tuberculosis screening results.
Statistical analyses were performed by SPSS version 21 and included Chi-square,
adjusted odds ratios, 95% confidence intervals, and logistic regression models. At
baseline, there were 318 positive QFT®s (> 0.25 IU/ml) which is 8.3% of the sample.
There were four variables found to be associated with positive QFT®s including age > 55
with odds ratio 6.89 (95% CI), foreign birth odds ratio 2.39 (95% CI), personal or family
history of TB with odds ratio 6.23, and place of work. Interestingly, there was no
association with job title (RN versus MD, etc.) or with the reason for the testing
(screening versus contact investigation). Out of the sample, 817 had repeat QFT® testing
from 7 days to 48.6 months apart. The amount of time between testing had no difference
in conversion, reversion, or results that did not change. 97.2% of those with negative
baseline tests had consistently negative QFT® results (721 out of 742) and 62.5% were
consistently positive (47 of 75). The odds of remaining positive increased from 2% to
18% for those over 55 years of age. Age did not appear to affect conversion or reversion
rates. Those who were foreign born outside of Germany had higher reversions rates of
35
2.8% (21 out of 742) and reversion rate of 37.3% (28 out of 75). If the definition of
QFT® result was changed to a borderline zone of 0.2 to <0.7 IU/ml, then conversions
would decrease to 1.1% and reversions to 18.8%. If the definition of conversion was
changed to 1.0 or 3.0, then conversion rates decreased even further to 1.0% or 0.4%
respectively and the reversion rate changed to 18.6% or 11.1%. The authors conclude that
a borderline interpretation zone of 0.35 to 0.7 or 1.0 IU/ml would be safe and reduce the
number of chest x-rays for healthcare workers without symptoms of TB in countries with
low TB incidence (Schablon et al., 2014).
This study by Schablon et al. (2014) is a level III correlational, quality B Good
study. The authors discuss the limitations of using a convenience sample with selection
bias. The occupational health physicians did not have a strict study protocol for schedules
of retesting or selection of groups to test (Schablon et al., 2014). There appears to be a
preconceived bias by the authors that there should be a borderline testing zone, however
it does not appear that the authors directed the physicians to retest participants in this
zone. There was no specific inclusion or exclusion criteria for participant selection to
control for any variables. The sample size was sufficiently large at 3,823.
Generalizability to US healthcare workers could be limited since this study was
conducted in Germany and authors report that from literature there is a historical positive
rate of TSTs to be 24-50% in healthcare workers. This would not be the general result
that is found in the US. Furthermore, 45.5% of participants had BCG which did not affect
the odds ratio for positive QFT®s (Schablon et al., 2014). This high rate of BCG