IJEDR1602088
International Journal of Engineering Development and Research (www.ijedr.org)483
Analysis of the sky scraper structure using software
1
Pratik S. Bhandari,
2Anuj K. Chandiwala
1M.Tech Student, 2Assistant Professor Civil Engineering Department,
Chhotubhai Gopalbhai Patel Institute of Technology, Bardoli, India
________________________________________________________________________________________________________
Abstract–With the lot of loss of life and property due to failure of structure caused by earthquake and wind forces, now it
is necessary to pay an attention to the adequate accuracy of strength in Composite Sky scraper structures. In this thesis, the sky scraper structure having height 392.36 meter is analyse under the effect of earthquake force and wind force by using ETABS-2015 that is the ultimate integrated software package for the structural analysis and design of buildings. In this thesis different bracing pattern and two types of earthquake analysis analyze. From the analysis, we will conclude the best bracing pattern and the results of two earthquake analysis.
IndexTerms–Sky scraper structure, Seismic force, Wind force, ETABS 2015
________________________________________________________________________________________________________
I.INTRODUCTION
In general, for design of tall buildings both wind as well as earthquake loads need to be considered. According to the provisions of Bureau of Indian Standards for earthquake load, IS 1893(Part 1):2002, height of the structure, seismic zone, vertical and horizontal irregularities, soft and weak storey necessitates dynamic analysis for earthquake load[1]. As per IS 875(Part 3):1987, when wind interacts with a building, both positive and negative pressures occur simultaneously, the building must have sufficient strength to resist the applied loads from these pressures to prevent wind induced building failure[1].
We consider two different seismic approaches for our study: i. Response Spectrum Analysis
ii. Time History Analysis
Elcentro is taken for the time history analysis. The 1940 El Centro earthquake (or 1940 Imperial Valley earthquake) occurred at 21:35 Pacific Standard Time on May 18 in the Imperial Valley in south eastern Southern California near the international border of the United States and Mexico. It had a moment magnitude of 6.9 and a maximum perceived intensity of X (Extreme) on the Mercalli intensity scale.
We consider three different bracing pattern for our study: 1. Bottom to Top Single side bracing
2. Bottom to Top Diagonal bracing 3. Intermediate bracing
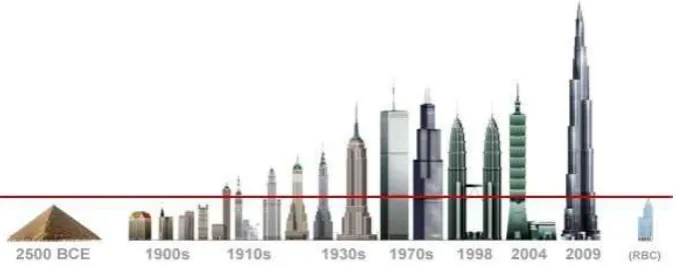
II. SKY SCRAPER STRUCTURE
A skyscraper is a tall, continuously habitable building of over 40 floors, mostly designed for office, commercial and residential uses. A skyscraper can also be called a high-rise, but the term skyscraper is often used for buildings higher than 150 m (492 ft). For buildings above a height of 300 m (984 ft), the term Supertall can be used, while skyscrapers reaching beyond 600 m (1,969 ft) are classified as Megatall. One common feature of skyscrapers is having a steel framework that supports curtain walls. Some early skyscrapers have a steel frame that enables the construction of load-bearing walls taller than of those made of reinforced concrete. Modern skyscrapers often have a tubular structure, and are designed to act like a hollow cylinder to resist lateral loads (wind, seismic, etc.). To appear more slender, allow less wind exposure and to transmit more daylight to the ground, many skyscrapers have a design with setbacks.
IJEDR1602088
International Journal of Engineering Development and Research (www.ijedr.org)484
III.MODELING PROCESS
Here A sky scraper structure with 5B+G+100 floors having total height 392.36 meter is selected for the analysis. Dead load, Live Load, Floor Finish Wind Load and Earthquake Load in X and Y-direction were applied on structure. Column, Beam and slab sections are of composite material. Bracing property is of steel. Floor height is 3.65 meter. Earthquake load is applied as per IS 1893:2002 for zone III. Wind load is applied as per IS 875 (part 3) : 1987 with wind speed of 44 m/s.
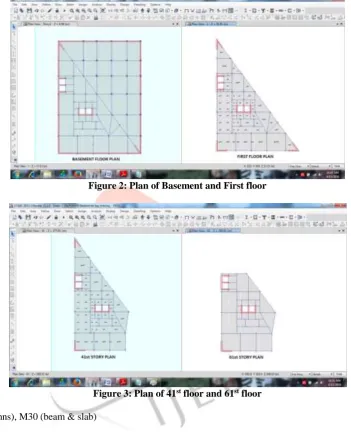
Figure 2: Plan of Basement and First floor
Figure 3: Plan of 41st floor and 61st floor Material :
Concrete : M60 (columns), M30 (beam & slab) Steel : Fe 345
Rebar : HYSD 550
Table 1 : Material Property
Property Concrete Steel
Young’s Modulus E, (MPa) 38729.83 210000
Poisson’s ratio (µ) 0.2 0.3
Density (Kg/mt3) 2549.291 7833.413
Table 2 : Load description
Load Description Value Dead load Self weight Live load (KN/mt2) 3.5 Floor finish (KN/mt2) 1.25
IJEDR1602088
International Journal of Engineering Development and Research (www.ijedr.org)485
IV.ANALYSIS PROCESS
After completion of modeling process next step which carried out was analysis of building. Here we carried out analysis of the sky scraper structure. According to this analysis we had provided two different earthquake analysis. Here, in this thesis focus on results of value of drift.
V.RESULTS
Hereby, results are developed. The value of drift for the two different earthquake analysis and three different bracing pattern are obtained.
I. Results by “Response spectrum analysis” : i. Case I – bottom to top single side bracing.
Table 3 : Story Drift for Case I – bottom to top single side bracing.
STORY STORY DRIFT (mt)
EQX (max) EQY (max) WLX (max) WLY (max) 100 0.083521 0.041524 0.021075 0.000837
95 0.085008 0.046438 0.021147 0.000897 90 0.085406 0.049089 0.021265 0.001147 85 0.082618 0.043705 0.021395 0.001477
80 0.076856 0.030016 0.021455 0.0018
75 0.073896 0.012297 0.021229 0.002026
70 0.068318 0.01271 0.020378 0.002021
65 0.057993 0.021061 0.018418 0.001585
60 0.04157 0.012283 0.014388 0.00125
55 0.034327 0.008774 0.012258 0.000949 50 0.031612 0.007248 0.011207 0.000673
45 0.030069 0.006085 0.011025 0.0007
40 0.028626 0.006708 0.01122 0.000898
35 0.026419 0.005826 0.010963 0.000975 30 0.024233 0.005098 0.010655 0.000999
25 0.021982 0.004453 0.01025 0.001117
20 0.019569 0.003875 0.009688 0.001229 15 0.016918 0.003346 0.008904 0.001335 10 0.013894 0.002837 0.007772 0.001422
5 0.009917 0.002192 0.005863 0.001337
0 0.000931 0.000139 0.000478 0.000055
ii. Case II – bottom to top Diagonal bracing.
Table 4 : Story Drift for Case II – bottom to top Diagonal bracing.
STORY STORY DRIFT (mt)
EQX (max) EQY (max) WLX (max) WLY (max) 100 0.036976 0.030529 0.005872 0.000978
95 0.037383 0.031754 0.006125 0.001199
90 0.038635 0.03361 0.006532 0.001542
85 0.039464 0.035318 0.006924 0.001835 80 0.039599 0.036314 0.007222 0.002044
75 0.038855 0.037602 0.00734 0.002116
70 0.036952 0.038804 0.007173 0.002009 65 0.033615 0.036371 0.006637 0.001656 60 0.030628 0.024796 0.005464 0.000874
55 0.03042 0.020894 0.005008 0.000572
50 0.03052 0.019399 0.005105 0.000529
45 0.030468 0.018314 0.005645 0.000697
40 0.03019 0.017314 0.006123 0.00086
35 0.02901 0.016325 0.006366 0.000966
30 0.027595 0.015292 0.006541 0.001023 25 0.025885 0.014167 0.006607 0.001036 20 0.023802 0.012895 0.006524 0.001135 15 0.021247 0.011364 0.006235 0.001236 10 0.017983 0.009688 0.005632 0.001297
5 0.01314 0.007465 0.004355 0.001178
IJEDR1602088
International Journal of Engineering Development and Research (www.ijedr.org)486
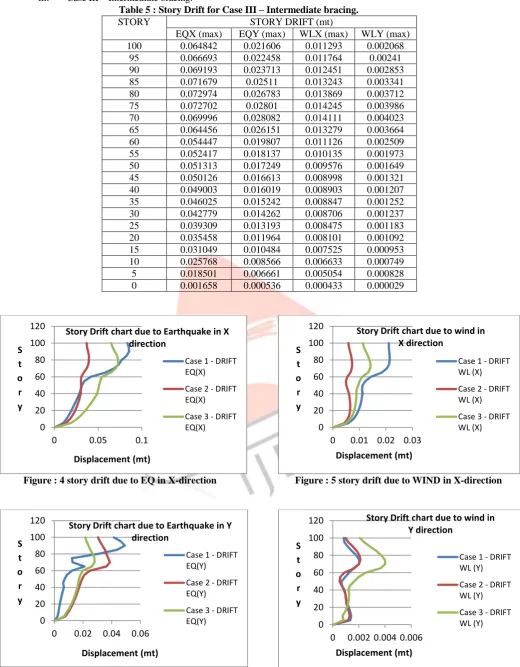
iii. Case III – Intermediate bracing.Table 5 : Story Drift for Case III – Intermediate bracing.
STORY STORY DRIFT (mt)
EQX (max) EQY (max) WLX (max) WLY (max) 100 0.064842 0.021606 0.011293 0.002068
95 0.066693 0.022458 0.011764 0.00241
90 0.069193 0.023713 0.012451 0.002853
85 0.071679 0.02511 0.013243 0.003341
80 0.072974 0.026783 0.013869 0.003712
75 0.072702 0.02801 0.014245 0.003986
70 0.069996 0.028082 0.014111 0.004023 65 0.064456 0.026151 0.013279 0.003664 60 0.054447 0.019807 0.011126 0.002509 55 0.052417 0.018137 0.010135 0.001973 50 0.051313 0.017249 0.009576 0.001649 45 0.050126 0.016613 0.008998 0.001321 40 0.049003 0.016019 0.008903 0.001207 35 0.046025 0.015242 0.008847 0.001252 30 0.042779 0.014262 0.008706 0.001237 25 0.039309 0.013193 0.008475 0.001183 20 0.035458 0.011964 0.008101 0.001092 15 0.031049 0.010484 0.007525 0.000953 10 0.025768 0.008566 0.006633 0.000749
5 0.018501 0.006661 0.005054 0.000828
0 0.001658 0.000536 0.000433 0.000029
Figure : 4 story drift due to EQ in X-direction
Figure : 6 story drift due to EQ in Y-direction
Figure : 5 story drift due to WIND in X-direction
Figure : 7 story drift due to WIND in Y-direction
0 20 40 60 80 100 120
0 0.05 0.1
S t o r y Displacement (mt)
Story Drift chart due to Earthquake in X direction
Case 1 - DRIFT EQ(X)
Case 2 - DRIFT EQ(X)
Case 3 - DRIFT EQ(X) 0 20 40 60 80 100 120
0 0.02 0.04 0.06
S t o r y Displacement (mt)
Story Drift chart due to Earthquake in Y direction
Case 1 - DRIFT EQ(Y)
Case 2 - DRIFT EQ(Y)
Case 3 - DRIFT EQ(Y) 0 20 40 60 80 100 120
0 0.01 0.02 0.03
S t o r y Displacement (mt)
Story Drift chart due to wind in X direction
Case 1 - DRIFT WL (X)
Case 2 - DRIFT WL (X)
Case 3 - DRIFT WL (X) 0 20 40 60 80 100 120
0 0.002 0.004 0.006
S t o r y Displacement (mt)
Story Drift chart due to wind in Y direction
Case 1 - DRIFT WL (Y)
Case 2 - DRIFT WL (Y)
IJEDR1602088
International Journal of Engineering Development and Research (www.ijedr.org)487
II. Results by “Time History analysis” :iv. Case I – bottom to top single side bracing.
Table 6 : Story Drift for Case I – bottom to top single side bracing.
STORY STORY DRIFT (mt)
EQX (max) EQY (max) WLX (max) WLY (max) 100 0.112502 0.061587 0.023607 0.003217
95 0.117910 0.063589 0.02451 0.003385
90 0.118457 0.066514 0.025103 0.003029
85 0.111581 0.062751 0.02437 0.001779
80 0.105387 0.052487 0.022429 0.002261
75 0.102159 0.051477 0.022329 0.00388
70 0.097012 0.052687 0.02265 0.004385
65 0.088495 0.054331 0.020619 0.003441 60 0.075495 0.049271 0.015327 0.002441 55 0.060774 0.042187 0.012844 0.001539 50 0.054006 0.040661 0.011683 0.001193 45 0.046934 0.037114 0.011318 0.000968 40 0.041890 0.036001 0.011582 0.000668
35 0.040524 0.033221 0.011312 0.00052
30 0.038664 0.030147 0.010975 0.000624 25 0.036014 0.028745 0.010533 0.000722 20 0.029574 0.025501 0.009928 0.000799 15 0.025422 0.023514 0.009094 0.000838 10 0.020644 0.014582 0.007907 0.000811
5 0.012006 0.006221 0.005939 0.000693
0 0.003271 0.000504 0.000487 0.000011
v. Case II – bottom to top Diagonal bracing.
Table 7 : Story Drift for Case II – bottom to top Diagonal bracing.
STORY STORY DRIFT (mt)
EQX (max) EQY (max) WLX (max) WLY (max) 100 0.079125 0.042056 0.022309 0.005007
95 0.081338 0.042957 0.023348 0.0049
90 0.082653 0.044026 0.02421 0.00356
85 0.084481 0.045278 0.023655 0.001128 80 0.083002 0.045697 0.021566 0.002802 75 0.082974 0.047258 0.022318 0.004635 70 0.079004 0.049558 0.022768 0.004776 65 0.072146 0.047551 0.020647 0.003281 60 0.063529 0.036524 0.015242 0.001707 55 0.051227 0.031821 0.012729 0.000793 50 0.049557 0.030079 0.011555 0.000491 45 0.043394 0.027496 0.011285 0.000449
40 0.041901 0.026112 0.011576 0.00059
35 0.037814 0.024159 0.011332 0.00068
30 0.032015 0.021005 0.011014 0.000775 25 0.031507 0.019675 0.010586 0.000862
20 0.024024 0.016583 0.00999 0.000928
15 0.023857 0.016202 0.009159 0.000955 10 0.017259 0.015879 0.007968 0.000995
5 0.009357 0.012403 0.005985 0.000893
0 0.002065 0.001975 0.000486 0.00001
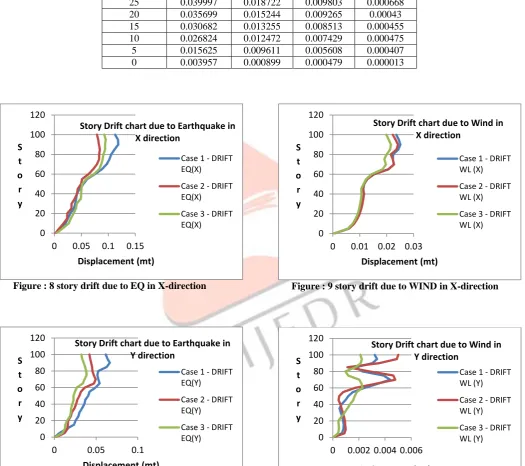
vi. Case III – Intermediate bracing.
Table 8 : Story Drift for Case III – Intermediate bracing.
STORY STORY DRIFT (mt)
EQX (max) EQY (max) WLX (max) WLY (max) 100 0.092346 0.032519 0.019901 0.002116
IJEDR1602088
International Journal of Engineering Development and Research (www.ijedr.org)488
80 0.091057 0.038254 0.019982 0.00098175 0.089602 0.038574 0.019147 0.001173
70 0.087006 0.036254 0.01972 0.002032
65 0.083364 0.034196 0.018483 0.002204 60 0.073604 0.026851 0.014407 0.002276 55 0.058843 0.024698 0.012399 0.001839 50 0.052019 0.023015 0.011425 0.001686
45 0.050126 0.023001 0.01058 0.001563
40 0.049862 0.021597 0.010691 0.001314 35 0.049005 0.020132 0.010471 0.001114 30 0.041586 0.019821 0.010185 0.000899 25 0.039997 0.018722 0.009803 0.000668
20 0.035699 0.015244 0.009265 0.00043
15 0.030682 0.013255 0.008513 0.000455 10 0.026824 0.012472 0.007429 0.000475
5 0.015625 0.009611 0.005608 0.000407
0 0.003957 0.000899 0.000479 0.000013
Figure : 8 story drift due to EQ in X-direction
Figure : 10 story drift due to EQ in Y-direction
Figure : 9 story drift due to WIND in X-direction
Figure : 11 story drift due to WIND in Y-direction
0 20 40 60 80 100 120
0 0.05 0.1 0.15
S t o r y Displacement (mt)
Story Drift chart due to Earthquake in X direction
Case 1 - DRIFT EQ(X)
Case 2 - DRIFT EQ(X)
Case 3 - DRIFT EQ(X) 0 20 40 60 80 100 120
0 0.05 0.1
S t o r y Displacement (mt)
Story Drift chart due to Earthquake in Y direction
Case 1 - DRIFT EQ(Y)
Case 2 - DRIFT EQ(Y)
Case 3 - DRIFT EQ(Y) 0 20 40 60 80 100 120
0 0.01 0.02 0.03
S t o r y Displacement (mt)
Story Drift chart due to Wind in X direction
Case 1 - DRIFT WL (X)
Case 2 - DRIFT WL (X)
Case 3 - DRIFT WL (X) 0 20 40 60 80 100 120
0 0.002 0.004 0.006
S t o r y Displacement (mt)
Story Drift chart due to Wind in Y direction
Case 1 - DRIFT WL (Y)
Case 2 - DRIFT WL (Y)
IJEDR1602088
International Journal of Engineering Development and Research (www.ijedr.org)489
VI.CONCLUSION
1. From the three basic pattern of bracing against the lateral loads, we found out “Diagonal bracing pattern from bottom to top” is more effective than other two pattern. How much percentage diagonal bracing pattern is more effective than other two bracing pattern, it is shown in the below table as diagonal bracing pattern is taken as 100%:
Table 9 : Percentage comparison table for Diagonal bracing for Response spectrum results
Accordingly Response Spectrum Results
Load Case Single side bottom to top bracing Intermediate Bracing
Story Acceleration 140.68% 102.47%
Story Drift 225.88% 175.36%
Column Force (Wind) 272.61% 233.20%
Table 10 : Percentage comparison table for Diagonal bracing for time history analysis results Accordingly Time History (ELCENTRO) Results
Load Case Single side bottom to top bracing Intermediate Bracing
Story Acceleration 102.38% 122.42%
Story Drift 142.19 % 116.71%
Column Force (Wind) 84.95% 81.40%
2. “Time history method” is worst than “Response spectrum method” for the sky scraper structure.
3. The variation of the results by seismic analysis is more than that of the wind analysis because of depending on many design factors. One of the most important factors is the weight of the building. The Ductile frames are recommended for tall building or when earthquake govern the design.
VII.ACKNOWLEDGMENT
I express my deepest thanks to Dr. S.A.Vasanwala and Prof. Dharmesh K. Bhagat for their great support, help, appreciation and guidance, at every stage of my work and also believing in me.My special thanks to Prof. K.N. Gandhi, Head of the Civil Engineering Department, for all the facilities provided to successfully complete this work.
REFERENCES
[1] K. Rama Raju*,1, M.I. Shereef3, Nagesh R Iyer2, S. Gopalakrishnan4. Analysis and design of RC tall building subjected to wind and earthquake loads. The Eighth Asia-Pacific Conference on Wind Engineering, December 10–14, 2013.
[2] A. Rahman, A. A. Masrur Ahmed and M. R. Mamun. Drift analysis due to earthquake load on tall structures. Journal of Civil Engineering and Construction Technology Vol. 4(5), pp. 154-158, May 2012.
[3] Nilupa Herath, Priyan Mendis, Tuan Ngo, Nicholas Haritos. Seismic performance of super tall buildings. International Conference on Sustainable Built Environment (ICSBE-2010) Kandy, 13-14 December 2010.
[4] P. Mendis, T. Ngo, N. Haritos, A. Hira. Wind Loading on Tall Buildings. EJSE Special Issue: Loading on Structures (2007). [5] Anupam Rajmani & Prof Priyabrata Guha. Analysis of wind & earthquake load for different shapes of high rise building.
INTERNATIONAL JOURNAL OF CIVIL ENGINEERING AND TECHNOLOGY (IJCIET) Volume 6, Issue 2, February (2015), pp. 38-45.
[6] Khaled M. Heiza, and Magdy A. Tayel. Comparative Study of The Effects of Wind and Earthquake Loads on High-rise Buildings. issres 75 Vol. 3(1) – March 2012.
[7] Dr. K. R. C. Reddy, & Sandip A. Tupat . The effect of zone factors on wind and earthquake loads of high-rise structures. IOSR Journal of Mechanical and Civil Engineering (IOSR-JMCE) e-ISSN: 2278-1684, p-ISSN: 2320-334X PP 53-58. [8] Baldev D. Prajapati & D. R. Panchal. Study of seismic and wind effect on multi storey r.c.c., steel and composite building.