Design A Bartlett Window Based Digital Filter
by Using GRNN
Ajeet Maheshwari 1 Karuna Markam 2
P.G Student, Department of Electronics Engineering, Madhav institute technology and science Gwalior, India. Associate Professor, Department of Electronics Engineering, Madhav institute technology and science Gwalior, India
ABSTRACT: In this paper, we have designed the digital filter based on Bartlett window function using ANN. Firstly
we have designed the 10th order digital filter based on Bartlett window function then calculate the coefficient of designed filter. We have normalized the frequency and designed filter at frequency ranges 0.05 to 1 Hz. Then we calculated the coefficients of filter at different frequencies. Some data group of coefficients is used to train the neural network designed using generalized regression algorithm and rest are used as test input to neural network. The output corresponding to test input is approximate equal to frequency corresponding to calculated coefficients using FDA tool. The optimization of the neural model has been done using generalized regression algorithm. Here radial basis function is used for the training of the neural network.
KEYWORDS:ANN, GRNN, NEURAL NETWORK
I. INTRODUCTION
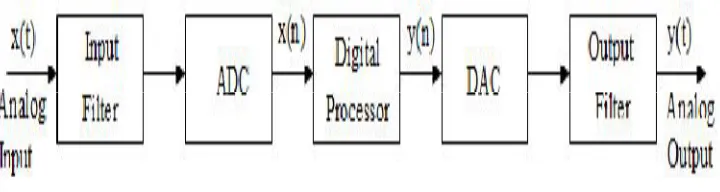
A filter is essentially a system or network that selectively changes the wave shape amplitude – frequency and or phase – frequency characteristics of a signal in a desired manner. Common filtering objectives are to improve the quality of a signal, to extract information from signals or to separate two or more signals. A digital filter is a mathematical algorithm implementation in hardware and/or software that operates on a digital input signal to produce a digital output signal for the purpose of achieving a filtering objective. A simplified block diagram of a real-time digital filter, with analog input and output signal is as shown in figure.1
Figure 1: Block diagram of a digital filter
ISSN: 2319-8753
International Journal of Innovative Research in Science,
Engineering and Technology
(An ISO 3297: 2007 Certified Organization)
Vol. 3, Issue 7, July 2014
neural network model. The efficiency of these above method is about 93%, but when generalized regression algorithm is used the accuracy is about 98%. That is the advantage of this method.
II. DESIGN FIR FILTER USING WINDOW METHOD
The windowing method requires minimum amount of computational effort; so window method is simple to implement. For the given window, the maximum amplitude of ripple in the filter response is fixed. Thus the stop band attenuation is fixed in the given window, but there is some drawback also of this method. The design of fir filter is not flexible. The frequency response of fir filter shows the convolution of spectrum of window function & de-sired frequency response because of this; the pass band & stop band edge frequency cannot be precisely specified. In this work we use Bartlett window method.
III. LITERATURE SURVEY
Awadhesh Gupta et. al. Presented a paper on design and analysis of low pass FIR & IIR filter and find optimum result using neural network. Author designed the low pass FIR and IIR filter and tried to reduce the number of side lobes and compact the size of main lobe then compared the result with filter designed using neural network. Filter designed using neural network gives the better result as compare to conventional method of design.
Harpeet Kaur et. al. presented a paper on design of low pass FIR filter using artificial neural network. Author design the low pass FIR filter based on Keiser window function. The stop band attenuation (SBT), transition width (TW),pass band ripple(PBR),sampling frequency and filter length are the varying parameter. This work is carried out using 30such values of all the varying parameter. Trained the same filter using neural network. The filter coefficient can be easily calculate using some known parameter of filter .
Navneet Gupta et. al. presented a paper on design low pass filter using generalize regression neural network. Author design the rectangular window in FDA tool of MATLAB and calculate the coefficient of designed filter corresponding to cut off frequency. Then trained the neural network using data collected from FDA tool. The accuracy of coefficient corresponding to cut off frequency using neural network is better than designed filter in FDA tool.
III. ARTIFICIAL NEURAL
NETWORKS
Figure 2: General Structure of Neural Network
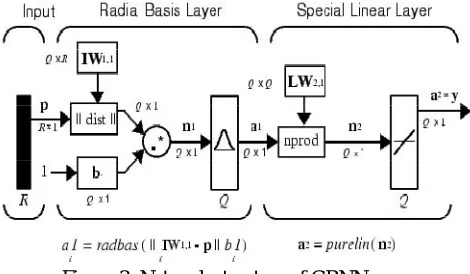
There are some algorithms that can be used to train an ANN such as: Back Propagation, Radial-basis Function, and Support Vector learning, etc. The Back Propagation is the simplest but it has one disadvantage that it can take large number of iterations to converge to the desired solution [3]. In Radial Basis Function (RBF) network the hidden neurons compute radial basis functions of the inputs, which are similar to kernel functions in kernel regression. Speech has popularized kernel regressions, which he calls a General Regression Neural Network (GRNN) [3]. General Regression Neural Network (GRNN) is a variation of Radial Basis Function (RBF) network that is based on the Nadaraya – Watson kernel regression. The main features of GRNN are fast training time and it can also model non-linear function. GRNN being firstly proposed by Sprecht in 1991 is a feed forward neural network model base on non linear regression theory. It approximates the function through activating neurons. The network structure of GRNN consists of three layers: input layer, radial basis hidden layer and linear output layer as shown in Figure 3.The transfer function of hidden layer is Radial Basis Function.
Figure 3: Network structure of GRNN
ISSN: 2319-8753
International Journal of Innovative Research in Science,
Engineering and Technology
(An ISO 3297: 2007 Certified Organization)
Vol. 3, Issue 7, July 2014
V. METHODOLOGY
In this methodology we use Bartlett window technique for filter designing and generalized regression neural network for training purpose.
Step 1
Low pass fir filter designed by fdatool. The order of filter is 10. We use cut of fre-quency ranges from 0 to 1. Then set the value of fc=0.05 and design the filter. Repeat the same process for value of fc from 0.1 to 1. So this gives the 19 dataset of input and output data. Out of these 19 dataset we use 17 for training and 2 for testing. Here input is h(n) and output is fc. The screenshot of first step is given below in Figure 3
Figure3. Filter designing by fdatool Step 2
ISSN: 2319-8753
International Journal of Innovative Research in Science,
Engineering and Technology
(An ISO 3297: 2007 Certified Organization)
Vol. 3, Issue 7, July 2014
Figure7. Result after simulation
VI. RESULTS AND DISCUSSION
In the above experiment, According the Table 2: (Result from fdatool) For the test input h(n), the output fc is 0.55 & 0.85. this result is deduce from filter designing tool. According to the Table 3: (Simulation result from nntool) the output for the same test input h(n) is 0.5537 & 0.83923. This result is taken from neural network tool. So the results from nntool and fda-tool are nearly same, and by this process we can easily estimate the cut off frequency of any fir filter
Table1. Result from fdatool (for Train Input)
h(n)
(Train Input) Cut off frequency
(Target)
h(0) h(1) h(2) h(3) h(4) h(5) h(6) h(7) h(8) h(9) h(10) Fc
0 0.038038 0.078346 0.119987 0.161977 0.203306 0.161977 0.119987 0.078346 0.038038 0 0.05
0 0.032303 0.073275 0.119785 0.167932 0.213409 0.167932 0.119785 0.073275 0.032303 0 0.1
0 0.023293 0.064507 0.118884 0.177903 0.230827 0.177903 0.118884 0.064507 0.023293 0 0.15
0 0.011987 0.05172 0.11637 0.191789 0.256268 0.191789 0.11637 0.05172 0.011987 0 0.2
0 2.26E-18 0.03485 0.110892 0.2091 0.290315 0.2091 0.110892 0.03485 2.26E-18 0 0.25
0 -0.01038 0.014553 0.100777 0.228603 0.332894 0.228603 0.100777 0.014553 -0.01038 0 0.3
0 -0.01655 -0.00726 0.084456 0.24804 0.38262 0.24804 0.084456 -0.00726 -0.01655 0 0.35
0 -0.01652 -0.02722 0.061246 0.26426 0.436461 0.26426 0.061246 -0.02722 -0.01652 0 0.4
0 -0.01019 -0.04121 0.032155 0.274068 0.490355 0.274068 0.032155 -0.04121 -0.01019 0 0.45
0
-4.22E-18 -0.04591 1.27E-17 0.27547 0.540884 0.27547 1.27E-17 -0.04591
0 0.015892 -0.02619 -0.05893 0.254264 0.629927 0.254264 -0.05893 -0.02619 0.015892 0 0.6
0 0.015665 -0.00687 -0.07995 0.234813 0.67269 0.234813 -0.07995 -0.00687 0.015665 0 0.65
0 0.009592 0.013447 -0.09312 0.211225 0.717705 0.211225 -0.09312 0.013447 0.009592 0 0.7
0 5.97E-18 0.030649 -0.09753 0.183895 0.765961 0.183895 -0.09753 0.030649 5.97E-18 0 0.75
0 -0.00955 0.041199 -0.0927 0.152774 0.816546 0.152774 -0.0927 0.041199 -0.00955 0 0.8
0 -0.01539 0.034911 -0.05707 0.080009 0.91508 0.080009 -0.05707 0.034911 -0.01539 0 0.9
0 -0.00944 0.019453 -0.02979 0.040219 0.959131 0.040219 -0.02979 0.019453 -0.00944 0 0.95
Table2. Result from fdatool (for Test Input)
(Test Input) h(n)
Cut off frequency
(output)
h(0) h(1) h(2) h(3) h(4) h(5) h(6) h(7) h(8) h(9) h(10) Fc
0 0.009983 -0.04035 -0.03149 0.268399 0.586926 0.268399 -0.03149 -0.04035 0.009983 0 0.55
0 -0.01544 0.042763 -0.07881 0.117935 0.867109 0.117935 -0.07881 0.042763 -0.01544 0 0.85
Table 3.Simulation Result from nntool (for Test Input)
(Test input) h(n)
Cut off frequency(output)
h(0) h(1) h(2) h(3) h(4) h(5) h(6) h(7) h(8) h(9) h(10) Fc
0 0.009983 -0.04035
-0.03149 0.268399 0.586926 0.268399
-0.03149 -0.04035 0.009983 0
0. 5537
0 -0.01544 0.042763
-0.07881 0.117935 0.867109 0.117935
-0.07881 0.042763 -0.01544 0
0. 83923
VII. CONCLUSION
From this experiment we estimate the cut off frequency and other parameter from filter co-efficient by the help of GRNN, and it is quite simple method than complex calculative window method. The above figures show that results come from Bartlett window method and artificial neural network is almost same. For the filter designing purpose This GRNN training algorithm is much better than other training algorithm like MLP, RBF etc. In the previous work, when MLP is used as a training algorithm, result is about 93% accurate. By the using of generalized regression algorithm, the accuracy of result is almost 97%. So there is increment of 5% in accuracy, which is very effective.
REFERENCES
1. S. Haykins, “Neural Networks –A comprehensive foundation”, Prentice –Hall of India Private Limited, New Delhi, (2003).
ISSN: 2319-8753
International Journal of Innovative Research in Science,
Engineering and Technology
(An ISO 3297: 2007 Certified Organization)
Vol. 3, Issue 7, July 2014
8. W. Tankand J. Hopfield, “Simple neural optimization networks: An A/D converter, signal decision circuit, and a linear programming circuit”, IEEE Trans. Circuits Syst., vol. CAS-33, (1986), pp. 533-541.
9. L. R. Rabinerand B. Gold, “Theory and Application of Digital Signal Processing”, Englewood Cliffs, NJ: Prentice-Hall,(1989).
10. R. Algaziand M. Suk, “On the frequency weighted least squares design of finite duration filters”, IEEE Trans. Circuits Syst., vol. CAS-34,(1987),pp. 80-95.
11. T. Saramaki, “Finite impulse response filter design”, Handbook for Digital Signal Processing, S. K. Mitra and J. F. Kaiser, Eds.,Wiley, New York, NY, USA, (1993).
12. D. F. Spechtand P. D. Shapiro, “Training speed comparison of probabilistic neural networks with back-propagation networks”, Proc. Int. Neural Network Conf.(Paris, France), vol. 1,(1990) July, pp. 440-443.
13. D. F. Specht, “Series estimation of a probability density function” , Technimetrics, vol. 13, no. 2, (1971)May.
14. P. Burrascano, “Learning vector quantization for the probabilistic neural network”, IEEE Trans. Neural Networks, vol. 2,(1991)July, pp. 458-461.
15. H.B. Celikoglu,“Application of radial basis function and generalized regression neural networks in non-linear utility function specification for travel mode choice modelling”, Math Compute Model, vol. 44, (2006), pp. 640-58.
16. E.J.Tkaczand, P. Kostas, “An application of wavelet neural network for classification patients with coronary artery disease based on HRV analysis”, Proceedings of the Annual International Conference on IEEE Engineering in Medicine and Biology, (2000),pp. 1391-1393. 17. H. Demuth, and M. Beale, “Neural Network Toolbox for Use with MATLAB”, User’s Guide, Version 3.0.
![European Union Reports for 1978 by the Ministers of Foreign Affairs [and] by the Commission COM (78) 653 final, 20 November 1978 Bulletin of the European Communities, Supplement 1/79](data:image/gif;base64,R0lGODlhAQABAIAAAP///wAAACH5BAEAAAAALAAAAAABAAEAAAICRAEAOw==)