HIGHLIGHTED ARTICLE
| COMMUNICATIONS
Evolution of Schooling Behavior in Threespine
Sticklebacks Is Shaped by the
Eda
Gene
Anna K. Greenwood,* Margaret G. Mills,*,†Abigail R. Wark,*,‡Sophie L. Archambeault,*,† and Catherine L. Peichel*,1 *Divisions of Basic Sciences and Human Biology, Fred Hutchinson Cancer Research Center, Seattle, Washington 98109,†Graduate Program in Molecular and Cellular Biology and‡Graduate Program in Neurobiology and Behavior, University of Washington, Seattle, Washington 98195 ORCID ID: 0000-0002-7731-8944 (C.L.P.)
ABSTRACTDespite longstanding interest in the genetic mechanisms that underlie behavioral evolution, very few genes that underlie naturally occurring variation in behavior between individuals or species are known, particularly in vertebrates. Here, we build on our previous forward genetic mapping experiments and use transgenic approaches to identifyEctodysplasinas a gene that causes differ-ences in schooling behavior between wild populations of threespine stickleback (Gasterosteus aculeatus)fish. This work provides rare insight into the proximate mechanisms that have shaped the evolution of vertebrate behavior.
KEYWORDSgenetics of behavioral evolution; natural variation; schooling behavior; threespine stickleback; transgenic
B
IOLOGISTS have long recognized that there must begenetic contributions to the evolution of behavioral dif-ferences among animals. Although genes that are necessary to
perform specific behaviors have been identified through
lab-oratory studies of inbred animals, these may not be the genes that underlie differences in behavior between individuals or
species in nature (Boakeet al.2002; Hoekstra 2010). Because
many behaviors arise from a complex interaction between
multiple genes and the environment, it has been difficult to
identify mutations that cause natural variation in behavior. Con-sequently, little is known about the genetic changes that enable behavior patterns to change in response to evolutionary forces, particularly in vertebrates (Bendesky and Bargmann 2011; Martin and Orgogozo 2013). To overcome these challenges, we used a combination of forward genetic mapping and
trans-genesis to identifyEctodysplasin(Eda) as a gene that contributes
to the evolution of schooling behavior in threespine stickleback fish (Gasterosteus aculeatus).
Schooling is a fascinating behavior known to vary widely
amongfish species, due to evolutionary trade-offs between the
costs and benefits of group living (Krause and Ruxton 2002).
To understand the proximate mechanisms that underlie the evolution of schooling behavior, we previously developed an assay to elicit naturalistic schooling in response to a con-trolled stimulus, a robotic school of model sticklebacks (Wark
et al. 2011). This assay permits quantification of the two critical features of schooling behavior: motivation to school
and ability to maintain an efficient body position within the
school (Pitcher 1983). Marine sticklebacks from open-water, pelagic habitats school extensively both in the wild and in
response to the model school (Warket al.2011; Di-Poiet al.
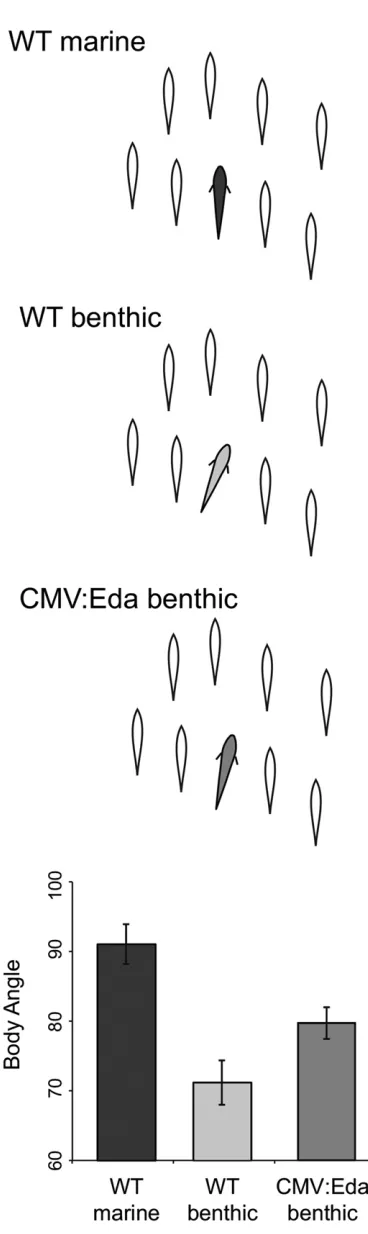
2014). They follow the school for extended durations and display parallel body position with the models when school-ing (Figure 1). In contrast, sticklebacks from benthic lake
habitats spend significantly less time with the model school
(Wark et al. 2011). When benthicfish attempt to school,
they are less capable of performing this complex behavior,
exhibiting an inefficient body position characterized by a
significantly less parallel angle with the modelfish (Figure
1). Thus, this assay recapitulates the reduced schooling be-havior observed in wild benthic sticklebacks, which is likely an adaptation to the abundant shelter in their highly vegetated lake
environment (Larson 1976; Vamosi 2002; Warket al.2011).
Copyright © 2016 by the Genetics Society of America doi: 10.1534/genetics.116.188342
Manuscript received February 29, 2016; accepted for publication March 31, 2016; published Early Online April 4, 2016.
Supplemental material is available online atwww.genetics.org/lookup/suppl/doi:10. 1534/genetics.116.188342/-/DC1.
Our previous genome-wide linkage mapping of schooling
behavior in a benthic3marine F2intercross demonstrated
that the ability to school and the motivation to school map to distinct genomic regions. Schooling ability, as measured by body position when schooling with the models, shows
signif-icant linkage to a region on chromosome 4 (Greenwoodet al.
2013). Interestingly, this genomic region is also genetically linked to the presence of bony armor and the patterning of
the sensory neuromasts of the lateral line (Warket al.2012).
Both of these phenotypes are controlled by the Eda gene,
which is contained within the schooling locus on
chromo-some 4 (Colosimoet al.2005; Millset al.2014).
Here, we tested whether variation inEdamight also
con-tribute to differences in schooling ability between marine and
benthic sticklebacks by manipulatingEdaexpression in
ben-thic sticklebacks. Benben-thics have significantly lower
expres-sion ofEdathan marine sticklebacks in the developingflank
(Mills et al. 2014; O’Brown et al. 2015) and in the brain
(Supplemental Material,Figure S1). We had previously
gen-erated transgenic benthic sticklebacks that express the
ma-rine allele of theEdacomplementary DNA (cDNA) under the
control of a cytomegalovirus (CMV) promoter, which should
drive constitutive expression of Eda throughout the fish
(Millset al.2014). Here, we bred six CMV:Eda founder
indi-viduals to wild-type benthics to establish six independent stable benthic CMV:Eda transgenic lines. These crosses yield-ed a mix of wild-type and transgenic offspring. We then tested the offspring in the model school assay, comparing the body position of wild-type and CMV:Eda benthic siblings.
As predicted, the CMV:Eda benthicfish exhibited a signifi
-cantly more marine-like schooling position compared with
their wild-type siblings (Figure 1; Mann–Whitney–Wilcoxon
test,W= 256,P= 0.0296). The magnitude of this effect is
consistent with the fact that schooling position is a complex
trait and that the Eda locus had a relatively small effect
(13% variance explained) in our previous mapping study
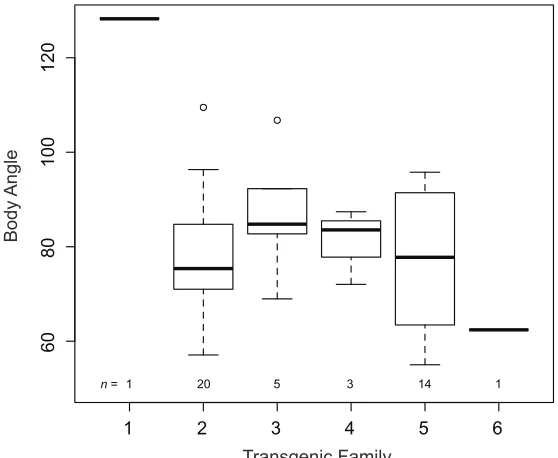
(Greenwood et al. 2013). There were no founder effects
on schooling behavior among the transgenic lines (Figure
S2; Kruskal–Wallis test,x2= 2.25,P= 0.521). Consistent
with the fact that the motivation to school is not genetically
linked to chromosome 4 (Greenwood et al. 2013, 2015),
there was no difference between wild-type and transgenic
fish in the latency to join the model school (Mann–Whitney–
Wilcoxon test,W= 317,P= 0.22). These results reveal that
Edacontributes to variation in the ability to school between
marine and benthic sticklebacks and provide one of the only examples in which the manipulation of a single gene can recapitulate behavioral differences seen in wild vertebrate species.
Consistent with the known effects ofEdaon morphological
traits (Colosimo et al. 2005; Mills et al. 2014), CMV:Eda
Figure 1 Edatransgene alters schooling behavior of benthic sticklebacks. The average body angle of marine (dark gray), benthic (light gray), and CMV:Eda transgenic benthicfish (medium gray) when schooling with a fixed school of stickleback models (open silhouettes). Graph depicts the mean6SEM body angle of marine (n= 8), benthic (n= 18), and CMV: Eda benthic (n= 44) sticklebacks. Marines have a significantly more
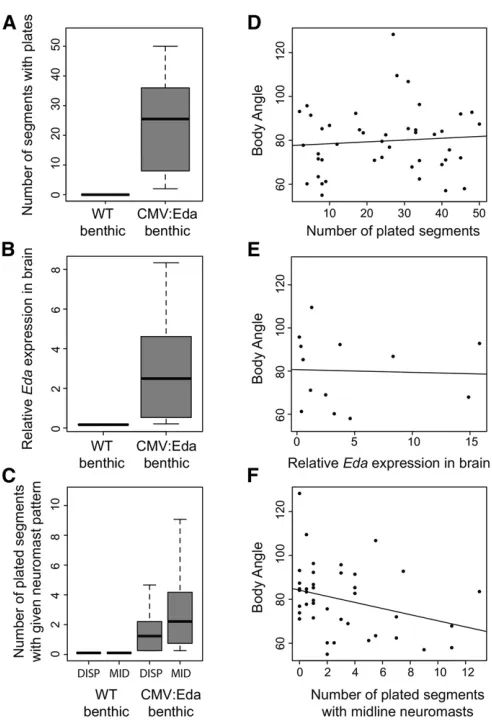
transgenic benthics also have differences in bony plates and
neuromast pattern, as well asEdaexpression in the
dienceph-alon (Figure 2). However, only variation in posterior lateral
line patterning, but not bony plates orEdaexpression in the
diencephalon, predicted schooling body angle in the CMV:
Eda benthics (Figure 2). Specifically, the number of plates
with midline neuromasts showed an association with school-ing ability in the CMV:Eda benthics (Figure 2; multiple
re-gression,b=20.311,P= 0.048). These data suggest that
the effects ofEdaon schooling behavior may be mediated by
its effects on lateral line patterning. However, manipulating lateral line phenotypes by physical or chemical ablations had no effect on schooling behavior in marines, benthics, or CMV: Eda transgenics (data not shown). Furthermore, it is possible
thatEdaaffects schooling behavior through expression at a
specific time or in a specific tissue not examined here. Thus,
extensive future work is required to reveal the precise
mech-anism by whichEdaaffects schooling behavior.
Our combined approach of forward genetic mapping and
transgenic analysis demonstrates for thefirst time thatEdais a
gene that shapes evolutionary differences in behavior,
thereby adding to a small list of genes known to influence
behavioral variation in the wild (Bendesky and Bargmann
2011; Martin and Orgogozo 2013). Identification of
addi-tional genes and mechanisms that underlie behavioral varia-tion in natural populavaria-tions will ultimately provide key insights into the genetic changes that mediate the evolution of behavioral differences among individuals or species.
Materials and Methods
Transgenicfish
All experiments were conducted in accordance with the guidelines of the Fred Hutchinson Cancer Research Center Institutional Animal Care and Use Committee (protocol
1575). Mosaic CMV:Eda benthicfish were generated as
pre-viously described (Millset al.2014). Briefly, a transgene
con-sisting of a CMV promoter driving expression of a marine
allele of theEdacDNA was incorporated into single-cell
ben-thic embryos using Tol2 transgenesis (Kawakami 2007). Pre-vious work has shown that regulatory but not coding
differences in Eda are responsible for the development of
bony plates (O’Brown et al. 2015). Individuals mosaic for
transgene incorporation were identified by screening for
presence of ectopic plates. For the current study, mosaic
foun-ders were crossed with wild-type benthicfish (derived from
fish caught in Paxton Lake, British Columbia) to yield stable
lines, comprising a mix of transgenic and wild-type progeny.
Wild-type and transgenic identity was confirmed by
pheno-typing for presence of plates and PCR genopheno-typing to identify
the transgene [forward primer (in CMV): 59-AGG CCT CTT
CGC TAT TAC G-39; reverse primer (inEda): 59-ATT GTA TCC
CGC TTC TGG TG-39]. Some phenotypically wild-type fish
(i.e., no ectopic plates) were positive for the transgene and
were excluded from the study. Thefinal data set consisted of
n= 44 CMV:Eda benthics andn= 18 genotypically wild-type
benthic siblings. The transgenics were from six independent
stable lines from six different founders (family 1,n= 1; family
2,n= 20; family 3,n= 6; family 4,n= 3; family 5,n= 13;
family 6,n= 1). The single transgenicfish from family 1 and
family 6 were included in statistical comparisons of wild-typevs.
transgenicfish but were excluded from analyses of the effect of
Figure 2 Associations between individual variation in bony plates,Eda brain expression, lateral line pattern, and schooling behavior among CMV:Eda benthic transgenics. CMV:Eda fish have phenotypes signifi -cantly different from their wild-type (WT) siblings, including (A) more plates (Mann–Whitney–Wilcoxon test,W= 0,P= 5.2e-10; WT,n= 18; CMV:Eda,n= 44); (B) higherEdamRNA expression in the diencephalon (Mann–Whitney–Wilcoxon test,W= 0,P= 7.4e-05; WT,n= 6; CMV:Eda, n= 13); and (C) more plates with dispersed neuromasts (DISP: Mann–
“founder”on phenotypes due to a sample size of one. Wild-type
marine sticklebacks (n= 8; derived from fish caught in the
Bekanbeushi River, Japan) were also tested in the model school assay for comparison in Figure 1.
Behavioral testing
Fish were tested in the model school assay as previously
described (Warket al.2011). Briefly, the assay consists of a
61-cm diameter circular white tank in which a school of eight
plastic sticklebacks (cast from a benthic-marine F2hybrid
in-dividual) is moved in a counterclockwise circle. Transgenic
and wild-type individuals were tagged withfluorescent
elas-tomer (Northwest Marine Technologies, Shaw Island, WA), and individuals from the same family were housed together and tested on the same day. Fish were captured from their home tank and placed into 950-ml isolation chambers for 1.5 hr. Fish were then placed into the assay chamber and given 5 min to acclimate. The motor controlling the model school
was then switched on remotely and fish were videotaped
interacting with the model school for 5 min. Videos were then
digitized, and when the model school was in a predefined
position in the tank, frames were extracted for analysis of body angle. We then calculated the median body angle for
eachfish. Note that the circular configuration of the tank and
the counterclockwise movement of the model school act to
bias the direction of body-angle deviation. Specifically, the
body angle tends to deviate from parallel with the models (90 degrees; marine-like) to an acute angle directed toward the center of the tank (benthic-like). Videos were also scored for the latency to join the school, which measures the moti-vation to school, a behavior that is unlinked to schooling body
position (Greenwoodet al.2013).
Bony plate and lateral line phenotyping
Fish were treated with calcein to visualize bony armor plates
and DASPEI (2-(4-(dimethylamino)styryl)-N-ethylpyridinium
Iodide) to visualize lateral line neuromasts as previously
de-scribed (Mills et al. 2014). Sticklebacks have plates in two
developmentally separable regions on theirflank: the anterior
trunk comprises thefirst seven trunk segments and the
poste-rior trunk is found in posteposte-rior body segments (Colosimoet al.
2004). We counted the number of segments containing plates
in the posterior and anterior trunk. Following Mills et al.
(2014), we quantified the number of plated and unplated
segments in the posterior trunk that had dispersed (dorsal and ventral to the midline) or midline neuromasts. We also counted the number of neuromasts in the anterior and
poste-rior trunk lateral line (Warket al.2012). All counts were
per-formed on both the left and right sides of thefish, and counts
from the two sides were combined for analyses. Somefish (n=
3 transgenics) died prior to DASPEI staining.
Quantitative PCR
We performed quantitative PCR (qPCR) to compare levels of
Edaexpression in the brain of larval and juvenile benthic and
marinefish. We also comparedEdaexpression in a subset of
adult transgenic CMV:Eda benthics. Benthic and marine lar-val brains were collected on the day after hatching. Brains
were removed from 24fish from each population, and three
brains were pooled for each sample (n= 8 marine andn= 8
benthic samples). Larval brains were placed directly into Trizol (Life Technologies, Carlsbad, CA) and were homogenized immediately. For juveniles and transgenics, we removed whole
brains of marines (n= 8), benthics (n= 8), CMV:benthic
trans-genics (n= 13), and matched wild-type benthic siblings (n=
6). Brains were placed into RNA later (Life Technologies) and
stored at220 C. Brains were then dissected into three portions:
the telencephalon; the diencephalon and rostral midbrain; and the caudal midbrain, cerebellum, and hindbrain. For simplicity, we refer to these regions as the telencephalon, diencephalon, and hindbrain. Brain regions were homogenized in Trizol as above. For qPCR in the marine and benthic brain regions, total RNA was isolated using Trizol, and samples were DNAse-treated and subjected to cDNA synthesis as previously described (Mills
et al.2014). For qPCR in the CMV:Eda transgenics and wild-type siblings, we used only the diencephalon and performed an additional isolation of messenger RNA (mRNA) from total RNA
using Dynabeads mRNA Purification kit (Life Technologies) to
eliminate the possibility of amplifying the transgenic copy of the
EdacDNA present in genomic DNA. qPCR forEdawas performed
in triplicate as previously described, using 17.5 ng of cDNA (RNA
equivalent) in each reaction andEef1bas a reference gene (Mills
et al.2014). Data are reported as relativeEdaexpression as
a percentage ofEef1blevels (Figure 2 andFigure S1).
Statistical analyses
We first used histograms and normal quantile plots in R
(http://www.r-project.org/) to examine whether the data
fit a normal distribution (Whitlock and Schluter 2015). All
traits except body angle showed departures from normality, even after log transformation. Thus, we conservatively used
the nonparametric Mann–Whitney–Wilcoxon test in R for
pairwise comparisons of all trait differences between trans-genics and wild-type siblings and for analyses of qPCR data.
However, all significant results reported remain significant
when parametric mixed linear models that use population
as afixed effect and family as a random effect are used (data
not shown). We used a nonparametric Kruskal–Wallis test in
R to test for the effect of transgenic founder on body angle; similar results are observed with a parametric linear model (data not shown). We used multiple regression in SPSS 13.0 software (SPSS, Chicago) to test the effect of the following independent variables on body angle in CMV:Eda benthic transgenics: total plates in the anterior and posterior trunk region, numbers of plated and unplated segments with dis-persed or midline neuromasts, and total numbers of neuromasts in anterior and posterior trunk region. Regression does not re-quire that predictor variables are normally distributed as long as
the residuals in the response variable (i.e., body angle) are
nor-mally distributed (Whitlock and Schluter 2015); visual inspec-tion of the residuals with histograms and normal quantile plots
performed on a subset of transgenic individuals; thus the
re-lationship betweenEdamRNA levels and behavior was not
in-cluded in the multiple regression but was analyzed in R using
Spearman’s correlation.
Data availability
All behavioral, morphological, and qPCR data for CMV:Eda benthic transgenics and behavioral and morphological data
for wild-type benthics and marines are provided inFile S1. All
qPCR data for wild-type benthics and marines are provided in File S2.
Acknowledgments
We thank Kim Hughes, David Kingsley, Harmit Malik, and Dolph Schluter for thoughtful comments on the manuscript
and Shaugnessy McCann for fish care. This research was
supported by National Science Foundation grant IOS 1145866 (to A.K.G. and C.L.P.).
Author contributions: A.K.G., A.R.W., and C.L.P. designed the experiments; A.K.G., M.G.M., A.R.W., and S.L.A. performed experiments; A.K.G., S.L.A., and C.L.P. analyzed data; A.K.G.
and C.L.P. wrote the manuscript. All authors gave final
approval for publication.
Literature Cited
Bendesky, A., and C. I. Bargmann, 2011 Genetic contributions to behavioural diversity at the gene-environment interface. Nat. Rev. Genet. 12: 809–820.
Boake, C. R. B., S. J. Arnold, F. Breden, L. M. Meffert, M. G. Ritchie
et al., 2002 Genetic tools for studying adaptation and the evo-lution of behavior. Am. Nat. 160: S143–S159.
Colosimo, P. F., C. L. Peichel, K. Nereng, B. K. Blackman, M. D. Shapiroet al., 2004 The genetic architecture of parallel armor plate reduction in threespine sticklebacks. PLoS Biol. 2: e109. Colosimo, P. F., K. E. Hosemann, S. Balabhadra, G. Villarreal, Jr., M.
Dicksonet al., 2005 Widespread parallel evolution in stickle-backs by repeatedfixation ofEctodysplasinalleles. Science 307: 1928–1933.
Di-Poi, C., J. Lacasse, S. M. Rogers, and N. Aubin-Horth, 2014 Extensive behavioural divergence following colonisation
of the freshwater environment in threespine sticklebacks. PLoS One 9: e98980.
Greenwood, A. K., A. R. Wark, K. Yoshida, and C. L. Peichel, 2013 Genetic and neural modularity underlie the evolution of schooling behavior in threespine sticklebacks. Curr. Biol. 23: 1884–1888.
Greenwood, A. K., R. Ardekani, S. R. McCann, M. E. Dubin, A. Sullivan et al., 2015 Genetic mapping of natural variation in schooling tendency in the threespine stickleback. G3 (Bethesda) 5: 761–769.
Hoekstra, H. E., 2010 In search of the elusive behavior gene, pp. 192–210 in In Search of the Causes of Evolution: From Field Observations to Mechanisms, edited by P. Grant, and R. Grant. Princeton University Press, Princeton, NJ.
Kawakami, K., 2007 Tol2: a versatile gene transfer vector in ver-tebrates. Genome Biol. 8: S7.
Krause, J., and G. D. Ruxton, 2002 Living in Groups. Oxford Uni-versity Press, New York.
Larson, G., 1976 Social behavior and feeding ability of two phe-notypes ofGasterosteus aculeatusin relation to their spatial and trophic segregation in a temperate lake. Can. J. Zool. 54: 107– 121.
Martin, A., and V. Orgogozo, 2013 The loci of repeated evolution: a catalog of genetic hotspots of phenotypic variation. Evolution 67: 1235–1250.
Mills, M. G., A. K. Greenwood, and C. L. Peichel, 2014 Pleiotropic effects of a single gene on skeletal development and sensory system patterning in sticklebacks. Evodevo 5: 5.
O’Brown, N. M., B. R. Summers, F. C. Jones, S. D. Brady, and D. M. Kingsley, 2015 A recurrent regulatory change underlying al-tered expression and Wnt response of the stickleback armor plates geneEDA. eLife 4: e05290.
Pitcher, T. J., 1983 Heuristic definitions offish shoaling behavior. Anim. Behav. 31: 611–613.
Vamosi, S. M., 2002 Predation sharpens the adaptive peaks: sur-vival trade-offs in sympatric sticklebacks. Ann. Zool. Fenn. 39: 237–248.
Wark, A. R., A. K. Greenwood, E. M. Taylor, K. Yoshida, and C. L. Peichel, 2011 Heritable differences in schooling behavior among threespine sticklebacks revealed by a novel assay. PLoS One 6: e18316.
Wark, A. R., M. G. Mills, L.-H. Dang, Y. F. Chan, F. C. Joneset al., 2012 Genetic architecture of variation in the lateral line sen-sory system of threespine sticklebacks. G3 (Bethesda) 2: 1047– 1056.
Whitlock, M. C., and D. Schluter, 2015 The Analysis of Biological Data. Roberts and Company, Greenwood Village, CO.
GENETICS
Supporting Information
www.genetics.org/lookup/suppl/doi:10.1534/genetics.116.188342/-/DC1
Evolution of Schooling Behavior in Threespine
Sticklebacks Is Shaped by the
Eda
Gene
Anna K. Greenwood, Margaret G. Mills, Abigail R. Wark, Sophie L. Archambeault, and Catherine L. Peichel
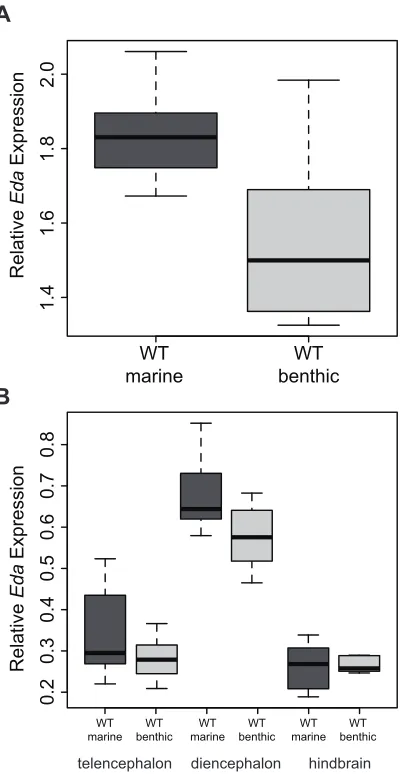
Figure S1
(A) Box plot showing
Eda
expression levels in pooled brain samples of larval marine
(
n
= 8 pools of 3 individuals each) and benthic (
n
= 8 pools of 3 individuals each) sticklebacks.
Eda
expression is significantly higher in larval marine brains (Mann-Whitney-Wilcoxon test,
W
= 54,
P
= 0.021). (B) Box plot shows
Eda
expression levels in three brain regions of juvenile
marine (
n
= 8) and benthic (
n
= 8) sticklebacks. There was a trend for
Eda
to be expressed at
higher levels in the diencephalon (Mann-Whitney-Wilcoxon test,
W
= 50,
P
= 0.065). There was
no significant difference in
Eda
expression in the telencephalon (Mann-Whitney-Wilcoxon test,
W
= 33,
P
= 0.32) or hindbrain (Mann-Whitney-Wilcoxon test,
W
= 32,
P
= 1.0). Box plots show
the median and 25% and 75% quartiles, and whiskers show the 1.5x interquartile range.
WT marine
1.4
1.6
1.8
2.0
0.2
0.3
0.4
0.5
0.6
0.7
0.8
Relative
Eda
Expression
Relative
Eda
Expression
telencephalon diencephalon hindbrain WT benthic
WT
marine benthicWT marineWT benthicWT marineWT benthicWT
A
Figure S2
Box plot showing body angle in CMV:Eda transgenic fish as a function of founder or
“family”. Box plots show the median and 25% and 75% quartiles, whiskers show the 1.5x
interquartile range, and open circles show points that fall outside the 1.5x quartile range.
1 2 3 4 5 6
60
80
100
120
Transgenic Family
Body
Angle
1 20 5 3 14 1