| INVESTIGATION
Detecting Rare Mutations with Heterogeneous Effects
Using a Family-Based Genetic Random Field Method
Ming Li,*,1Zihuai He,†,1Xiaoran Tong,‡John S. Witte,§and Qing Lu‡,2 *Department of Epidemiology and Biostatistics, Indiana University at Bloomington, Indiana 47405,†Department of Biostatistics, Columbia University, New York, New York 10032,‡Department of Epidemiology and Biostatistics, Michigan State University, East Lansing, Michigan 48824, and§Department of Epidemiology and Biostatistics, University of California at San Francisco, California 94143 ORCID ID: 0000-0002-7943-966X (Q.L.)
ABSTRACTThe genetic etiology of many complex diseases is highly heterogeneous. A complex disease can be caused by multiple mutations within the same gene or mutations in multiple genes at various genomic loci. Although these disease-susceptibility mutations can be collectively common in the population, they are often individually rare or even private to certain families. Family-based studies are powerful for detecting rare variants enriched in families, which is an important feature for sequencing studies due to the heterogeneous nature of rare variants. In addition, family designs can provide robust protection against population stratification. Nevertheless, statistical methods for analyzing family-based sequencing data are underdeveloped, especially those accounting for heterogeneous etiology of complex diseases. In this article, we introduce a randomfield framework for detecting gene-phenotype associations in family-based sequencing studies, referred to as family-based genetic randomfield (FGRF). Similar to existing family-based association tests, FGRF could utilize within-family and between-family information separately or jointly to test an association. We demonstrate that FGRF has comparable statistical power with existing methods when there is no genetic heterogeneity, but can improve statistical power when there is genetic heterogeneity across families. The proposed method also shares the same advantages with the conventional family-based association tests (e.g., being robust to population stratification). Finally, we applied the proposed method to a sequencing data from the Minnesota Twin Family Study, and revealed several genes, including SAMD14, potentially associated with alcohol dependence.
KEYWORDSfamily-based association study; rare variants; genetic heterogeneity; population stratification; alcohol dependence
N
EXT generation sequencing technologies, such ashigh-throughput exome sequencing and whole-genome se-quencing, are being used increasingly in human genetics research. Sequencing-based studies hold great promise for the identification andfine mapping of new genetic variants, especially rare variants, associated with complex human diseases (Raychaudhuriet al.2011; Kiezunet al.2012). De-spite such promise, detecting disease-susceptibility rare var-iants remains a great challenge because of the heterogeneous nature and their low frequencies. Multiple rare mutations
within the same gene can independently influence the
dis-ease (i.e., allelic heterogeneity), and rare variants in different genes can also be involved in related pathways
underly-ing complex human diseases (i.e., locus heterogeneity)
(McClellan and King 2010). Each casual rare mutation may be present in only one or a small number of individuals or families, making them hard to detect in a general population. For example, a number of genes harbor high penetrance mu-tations for breast cancer; but any woman carrying such a mutation generally only has one (McClellan and King 2010). Another challenge raised by sequencing studies is how to adequately control for potential confounding by pop-ulation stratification. Although statistical methods, such as the principal component method, can capture population structure, it remains unclear how well they capture the underlying population substructure for rare variants (Mathieson and McVean 2012). Moreover, these
popula-tion-based methods can control for population stratifi
ca-tion only at a global level. Because the level of populaca-tion stratification at a particular locus could vary due to factors
Copyright © 2018 by the Genetics Society of America doi:https://doi.org/10.1534/genetics.118.301266
Manuscript received April 4, 2018; accepted for publication July 29, 2018; published Early Online August 13, 2018.
Supplemental material available at Figshare:https://doi.org/10.25386/genetics.6108551.
1These authors contributed equally to this work.
2Corresponding author: Department of Epidemiology and Biostatistics, Michigan State
such as natural selection, using principle components to adjust population stratification at a locus-specific level
could be either insufficient or overly adjusted (Marchini
et al.2004).
Family-based studies provide a natural way to address the issue of population stratification. In a family-based association study, a typical transmission disequilibrium test (TDT) com-pares the alleles that are transmitted to an affected child from parents to the alleles that are not transmitted. Therefore, it matches ancestral background of samples within families, and provides robustness against population stratification at a locus-specific level. In addition, family-based studies can offer a unique opportunity for considering genetic heteroge-neity due to rare variants. Individuals in the same family tend to have a more homogeneous profile of disease risk (e.g., sharing similar environment). Rare mutations involved in the same etiological process are also likely to aggregate within families, which could increase the chance of detec-tion. The idea of using families to consider genetic hetero-geneity can be traced back to the era of linkage. In a linkage study, analytical methods, such as the ordered subset anal-ysis, are used to consider genetic heterogeneity among fam-ilies (Hauseret al.2004).
Several statistical methods have been developed recently for
family-based sequencing data. These methods can be briefly
categorized into two categories: TDT-based and correlated data modeling-based, such as generalized estimating equations (GEE) and linear mixed models (LMM). The conventional TDT constructs test statistics within a family (e.g., comparing transmitted and nontransmitted alleles), and therefore pro-vide robustness against population stratification (Ionita-Laza
et al.2013; Heet al.2014a). Nonetheless, because the TDT only uses within-family information, but not between-family information, it can have lower power than GEE- or LMM-based methods, which integrate both within-family and
between-family information (Chen et al. 2013; Schaid et al. 2013;
Wanget al.2013). However, GEE or LMM-based methods do not provide protection against population stratification be-cause of the use of between-family information.
To facilitate the family-based association analysis of se-quencing data, while addressing the issues of genetic
hetero-geneity and population stratification, we have developed a
family-based genetic randomfield method (FGRF). The
method combines both within-family and between-family information to optimize the power of the association test, but modifies the between-family information by conditioning the genotype of family members on the average genotype scores within each family. Therefore, FGRF removes the dif-ference of allele frequencies across families and provides robustness to population stratification. Another feature of FGRF is being able to consider genetic heterogeneity, such as locus heterogeneity and allelic heterogeneity. Because FGRF is a gene-based approach, it can capture allelic hetero-geneity by aggregating information across all variants in a gene. FGRF can also capture locus heterogeneity by construct-ing a test statistic for each family and then summarizconstruct-ing
statistics across all families. This is important because of the heterogeneous nature of rare variants. Through simula-tions, we compare the performance of FGRF with that of a GEE-based kernel association test, referred to as GSKAT
(Wang et al.2013), and a Burden test that first collapses
the rare variants and then applies the GEE method. Finally, we illustrated the proposed method by applying it to a genome-wide gene-based analysis of alcohol dependence (AD).
Methods
We and others have recently proposed random-field-based asso-ciation tests for genetic assoasso-ciation analysis of unrelated individ-uals (He et al. 2014b; Li et al. 2014a). A random field is a stochastic process that takes values in a Euclidean space, where two observations tend to share similar outcomes if they are spa-tially close to each other (Berg et al.1989; Adler and Taylor
2007). Under the genetic random field framework, a genetic
space can be constructed by using individuals’genetic data. Each individual can be mapped to a location in the genetic space by using his/her genetic profile as coordinates. When there is a gene-phenotype association, we expect two individuals would have similar phenotypes if their genetic profiles are similar (i.e., close in genetic space). In this article, based on the randomfield framework, we develop a FGRF method to address the issues of genetic heterogeneity and population stratification.
The overall test of the family-based genetic random field (FGRF-O)
Assume we havemfamilies withnimembers from thei-th
family. The study population has a total ofNindividuals with
N¼P
m
i¼1
ni:Each individual is sequenced forKvariants within
a genomic region (e.g., a gene or a linkage
disequilib-rium (LD) block), and measured forHadditional nongenetic
covariates, such as age and gender. Let yi;j be the
pheno-typic value for the j-th member of the i-th family;
Gi;j¼ ðgi;j;1;gi;j;2;. . .;gi;j;KÞ9be the genotypes for Kvariants within the region, coded as the minor allele counts; and
Xi;j¼ ðxi;j;1;xi;j;2;. . .;xi;j;HÞ9be the covariates. We use a con-ditional auto-regressive model to describe the relationship between phenotypes and genotypes considering the covari-ates and familial correlation:
E
yi;jjy2ði;jÞ
¼mi;jþ X
l6¼j
1#l#ni
vi;j;lðhÞðyi;l2mi;lÞ
þg X
ði;jÞ6¼ði9;j9Þ sði;jÞ;ði9;j9Þ
yi9;j92mi9;j9
(1)
fðxÞ ¼logðx=ð12xÞÞ for binary phenotypes; vi;j;lðhÞ is the covariance term that models the correlation of phenotypes among family members (see Appendix for details); and
sði;jÞ;ði9; j9Þ is the genetic similarity between two individuals (i.e., thej-th member of thei-th family and thej9-th member of thei9-th family). We define the genetic similarity by
sði;jÞ;ði9;j9Þ¼X K
k¼1
gi;j;k2qk
gi9;j9;k2qk
;where qk¼
1 N
Xm
i¼1 Xni
j¼1
gi;j;k: (2)
This similarity metric is proportional to the genetic
relation-ship used by GCTA for heritability estimation (Yang et al.
2011), and is also a centered version of the linear kernel function used in sequence kernel association test and its ex-tensions (Wuet al.2011; Leeet al.2012).
Thus, the conditional auto-regressive model (Equation 1) adjusts for covariates and correlation among family mem-bers, and predicts the phenotype of an individual (i.e.,yi;j) from the phenotypes of all of the other individuals (i.e. y2ði;jÞ), where the contribution of another individual’s phenotype (i.e.,yi9;j9) is proportional to the genetic similarity (i.e.,sði;jÞ;ði9;j9Þ) of two individuals. The parametergthus mea-sures the magnitude of the joint association between genetic variants and the phenotype. Under the null hypothesis of no association, an individual’s phenotype cannot be predicted by the phenotypes of the others. Therefore, the gene–phenotype association can be tested as:H0 :g¼0:
Equation 1 can be written in a simplified matrix form as
follows:
EYjY2¼mþ fVðhÞ þgSgY2m; (3)
whereY¼y1;1;. . .:;y1;n1;y2;1;. . .:;y2;n2;. . .:ym;1;. . .:;ym;nm
is the phenotype vector of all individuals from all families in a sequential order;fðmÞ ¼Xb;VðhÞis aN3Nblock diagonal matrix in which thei-th block is ani3nimatrix with theðj;lÞ element asvi;j;lðhÞ;Sis aN3Nmatrix for pairwise genetic
similarity amongNindividuals.
We propose a generalized score test forH0:g¼0 through the following estimating equations: (Liang and Zeger 1986).
Ugb;h;g¼@E
YjY2 @g
T
fY2EYjY2g
¼Y2mTSfI2VðhÞ2gSgY2m¼0: (4)
A generalized score statistic can thus be defined as (Boos
1992):
QO¼Ugb^;h^;0¼Y2m^9SfI2Vðh^ÞgðY2m^Þ; (5)
wheregðm^Þ ¼Xb^and^hare estimated under the null hypoth-esis ofg¼0:In the Appendix, we show that the above esti-mating equation is unbiased, and that the score statistic
1=mQO follows asymptotically a mixture of Chi-square
distributions.
Between-family and within-family tests of FGRF (FGRF-B and FGRF-W)
The family-based randomfield model proposed in Equation 1
is based on the genetic similarity among all individuals, both within the same families and between different families. To account for the possible genetic heterogeneity, we further decompose the model into two components: a within-family component and a between-family component,
E
yi;jjy2ði;jÞ
¼mi;jþ X
l6¼j
1#l#ni
vi;j;lðhÞ
yi;l2mi;l
þgw X
l6¼j
1#l#ni
sði;jÞ;ði;lÞ
yi;l2mi;l
þgbX
i96¼i
Xni9
j9¼1
s*
ði;jÞ;ði9;j9Þ
yi9;j92mi9;j9
: (6)
Intuitively, the within-family component predicts the pheno-type of the individualði;jÞbased on the phenotypes of mem-bers in the same family; the between-family component
predicts the phenotype of the individual ði;jÞ based on
the phenotypes of individuals from all the other families.
Correspondingly, parameters gw and gb measures the joint
association based on withfamily and between-family
in-formation, respectively. The gene–phenotype association
can thus be evaluated by testing the null hypothesis:
H0 :gw¼gb¼0:
Assuming family members share the same genetic ancestry, the within-family component is not susceptible to population stratification bias. To account for this possibility across fam-ilies, we modify the genetic similarity for the between-family component as:
s* ði;jÞ;ði9;j9Þ¼
XK
k¼1
gi;j;k2qi;k
gi9;j9;k2qi9;k
;where qi;k¼
1 ni
Xni
j¼1
gi;j;k: (7)
The genetic similarity score in Equation 7 is centered within each family, removing the differences of allele frequencies across families. Therefore, the between-family component is adjusted for population stratification.
For statistical inference, we rewrite Equation 6 in a matrix form:
EðYjY2Þ ¼mþ fVðhÞ þgwSwþgbSbgðY2mÞ; (8)
whereSwis a block diagonal matrix in whichi-th block is a
ni3nimatrix with theðj;lÞelement assði;jÞ;ði;lÞ;Sbis aN3N matrix for pairwise genetic similarity of individuals from dif-ferent families, as described in Equation 7.
generalized score test based on between-family information (FGRF-B) through the following estimating equations,
Ugwðb;h;gÞ ¼@EðYjY2Þ @gw
T
fY2EðYjY2Þg
¼ ðY2mÞTSwfI2VðhÞ2gwSw2gbSbgðY2mÞ
¼0
Ugbðb;h;gÞ ¼
@EðYjY2Þ @gb
T
fY2EðYjY2Þg
¼ ðY2mÞTSbfI2VðhÞ2gwSw2gbSbgðY2mÞ
¼0;
8 > > > > > > > > > > > > > > > > < > > > > > > > > > > > > > > > > : (9)
The generalized score statistics can thus be defined as (Boos 1992):
(
Qw¼Ugw
^
b;h^;0¼ ðY2m^Þ9SwfI2Vðh^ÞgðY2m^Þ
Qb¼Ugbb^;^h;0¼ ðY2m^Þ9SbfI2Vðh^ÞgðY2m^Þ; (10)
where gðm^Þ ¼X^b and ^h are estimated under the null
hypothesis H0:gw¼gb¼0. In the appendix, we show
that the 1ffiffiffi
m
p Qw follows asymptotically a normal
dis-tribution, while 1=mQb follows asymptotically a mixture
of Chi-square distributions.
Fisher’s combined probability test of FGRF (FGRF-F)
The within-family and between-family tests of FGRF (i.e.,
FGRF-W and FGRF-B) evaluate the gene–phenotype
associa-tion separately. We can combine these two sources of infor-mation in a single test, for example, using Fisher’s combined probability test (Fisher 1925). In particular, letpwandpbbe the P-values of FGRF-W and FGRF-B, respectively. Fisher’s combined test gives the following test statistic:
QF¼ 22logepw22logepb: (11)
FGRF-W and FGRF-B utilize two sources of information (i.e., within-family and between-family) that are independent. Therefore, QF follows asymptotically a chi-square distribu-tion with four degrees of freedom.
Data availability
The authors state that all data necessary for confirming the conclusions presented in the manuscript are represented fully within the manuscript. Supplemental material available at
Figshare:https://doi.org/10.25386/genetics.6108551.
Results
Simulation studies
We conducted simulation studies to evaluate the performance of FGRF, and compared it to two commonly used methods: GSKAT and Burden test. In the simulations, we compared all
methods for type I error rates and statistical power. The type I error rates were evaluated in the absence or presence of population stratification. The statistical power was evaluated under various disease scenarios with regard to genetic het-erogeneity. Rare causal mutations underlying complex phe-notypes may fall into two categories: (1) rare variants that remain polymorphic in one or more major human populations; and (2) private variants that are restricted to probands and immediate relatives (Cirulli and Goldstein 2010). Corre-spondingly, we considered three scenarios in terms of genetic heterogeneity: (1) No genetic heterogeneity, representing a scenario that “all unhappy families are alike”; (2) Genetic heterogeneity caused by rare but not private mutations,
rep-resenting a scenario that “each unhappy population is
un-happy in its own way”; (3) Genetic heterogeneity caused by
private mutations, representing a scenario that “each
un-happy family is unun-happy in its own way.”
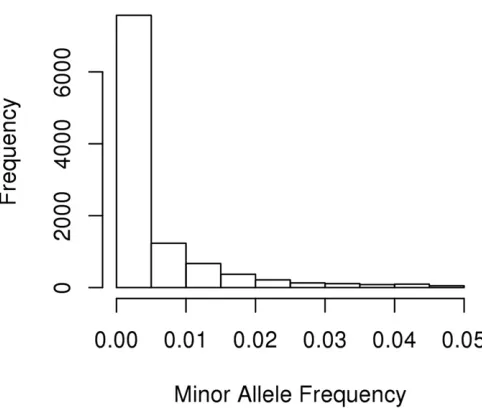
To represent the actual structure of sequencing data (e.g., LD patterns and allele frequencies), we used real sequencing data of 1092 individuals from the 1000 Genomes Project as our founder population (The 1000 Genomes Project Consor-tiumet al.2010). In particular, we randomly selected a 1 MB
region from the genome (i.e., Chromosome 17: 7344328–
8344327) as our analytical genetic data in the simulations. We focused on genetic variants with less common frequen-cies, and removed common variants with a minor allele
fre-quency of$5%. The 1 MB regions covered 10,527 variants
after we removed all common variants, and their minor allele frequencies are illustrated in Figure 1. The variants were
pre-dominantly rare with a minor allele frequency,1%. In each
simulation replicate, a 10 kb segment was randomly selected from the 1 MB region as a candidate gene, within which single nucleotide polymorphisms (SNP) were tested as a SNP-set for joint association with the simulated phenotypes (described below). The median number of variants within the 10 kb segments in all simulations was 103.
We also considered three types of family structures in the simulations: (1) nuclear families with four members (i.e., father, mother and two offspring); (2) three-generation ilies with eight members; and (3) a mixture of nuclear fam-ilies and three-generation famfam-ilies. The family structures are illustrated in Figure 2. The founders of each family were randomly selected from the founder population. The off-spring genotypes were then generated by randomly trans-mitting one allele from each parent at each locus. In each
simulation replicate, we fixed our sample size at 1280,
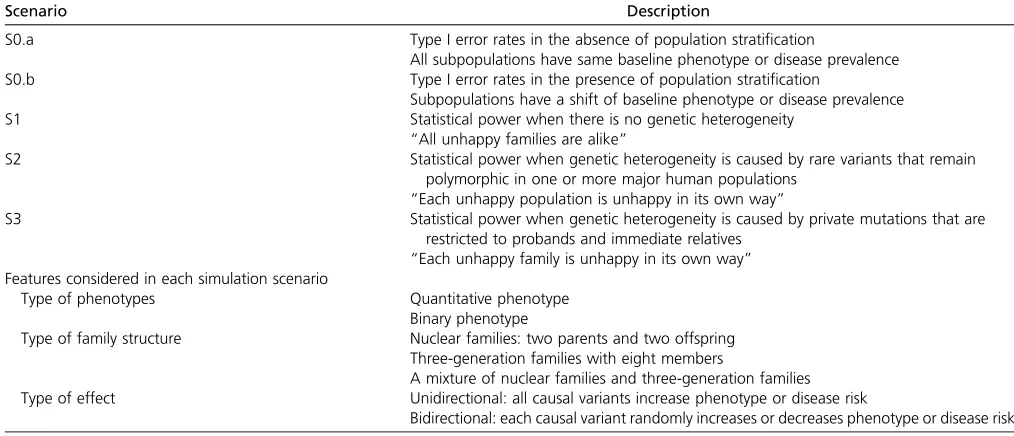
which was equivalent to 320 nuclear families, 160 three-generation families, or a mixture of 160 nuclear families and 80 three-generation families. The simulation scenarios are summarized in Table 1. The phenotype of each individ-ual was simulated according to the following disease scenarios.
Type I error rates in the absence of population stratifica-tion:Wefirst evaluated all methods for type I error rates when
simulated independently from the genotypes. We considered both quantitative phenotypes and binary phenotypes. The
quantitative phenotypes for the i-th family were simulated
based on a multivariate normal distribution,
Y13ni ¼ ðyi;1;yi;2; ::::::;yi;niÞ Nð0;Sni3niÞ; where
Sni3ni¼Kinni3niþCSni3niþIni3ni: (12)
In the above equation, the variance-covariance matrix (i.e.,
Sni3ni) of the phenotypes was modeled by a mixture of cor-relation structure: a corcor-relation component due to kinship coefficients (i.e.,Kinni3ni), a correlation component due to shared environment (i.e.,CSni3ni;compound symmetric) and an independent component due to random errors (Ini3ni). For binary phenotypes of the i-th family, wefirst simulated the disease liability by a multivariate normal distribution:
h13n
i¼ ðhi;1;hi;2::::::;hi;niÞ Nð0;Sn9i3niÞ;where
Sn9i3ni¼Kinni3niþCSni3ni: (13)
The disease phenotypes were then simulated by a Bernoulli distribution based on disease liability,
yi;j Bernoulliðpi;jÞ;
pi;j¼logitðb0þhi;jÞ ¼
expðb0þhi;jÞ
1þexpðb0þhi;jÞ
; (14)
where b0is afixed parameter to ensure the disease
preva-lence was20%.
Type I error rates in the presence of population stratifi-cation: The participants of the 1000 Genome Project were
selected from diverse ethnic backgrounds, including 14 sub-populations. The ethnicity groups are described in Table 2. To evaluate the type I error rates in the presence of population stratification, we simulated the phenotypes, allowing a shift of distribution among 14 ethnicity groups. For quantitative phenotypes, each subpopulation had a baseline phenotype level randomly selected from a uniform distribution,
Unif½0;10. For binary phenotypes, each subpopulation had
a disease prevalence randomly selected from a uniform dis-tribution, Unif½1%;40%: The phenotypes were then simu-lated following the same strategy described in Equations 12, 13, and 14.
Statistical power when there is no genetic heterogeneity:
In such a scenario, we assumed that all subpopulations had the
same causal variants influencing the phenotypic variation,
representing a scenario that“all unhappy families are alike.”In particular, we used a linear regression model and a logistic regression model to simulate quantitative and binary pheno-types, respectively.
yi;j¼b0þ
XK
k¼1
bkxi;j;kþei;j;k (15)
logit Pyi;j¼1
¼b90þ
XK
k¼1
b9kxi;j;kþe9i;j;k; (16)
where the random errors (ei;j;kore9i;j;k) are independent across families, but had the correlation structure among family members as described in Equation 12 or 13;xi;j;kis the geno-type of the k-th variant for the j-th member from the i-th family, coded as the minor allele count. We further assumed that 5% of the totalKvariants were causal variants, and their effect sizes were proportional to the logarithm of minor allele frequencies.
jbkj ¼
2clogðMAFÞ if var a int k is causal
0 if otherwise 1#k#K;
wherecwas a constant to ensure the statistical power was in a reasonable range. We also evaluated the statistical power Figure 2 Family structures used in the simulations. Left: a nuclear family with four members. Right: a three-generation family with eight members.
by varying the directionality of the effect. For unidirectional scenarios, all effect sizes were assumed to be positive, while for bidirectional scenarios, a sign factor 1 or21 was selected randomly for eachbkwith a probability of 0.5.
Statistical power when genetic heterogeneity is caused by rare but not private mutations: In such a scenario, we assumed that the causal variants were the same within each subpopulation, but varied across 14 subpopulations,
repre-senting a scenario that“each unhappy population is unhappy
in its own way.”Within each subpopulation, 5% of the totalK
variants were selected randomly as causal variants. For each subpopulation, Equations 15 and 16 were used to simulate quantitative phenotypes and binary phenotypes, respectively. Under such a scenario, we also evaluated the statistical power for both unidirectional and bidirectional effect sizes.
Statistical power when genetic heterogeneity is caused by private mutations:In such a scenario, we assumed that the
causal variants were the same within each family, but varied
across families, representing a scenario that “each unhappy
family is unhappy in its own way.”Within each family, 5% of
the totalKvariants were randomly selected as causal
vari-ants. For each family, Equations 15 and 16 were used to simulate quantitative phenotypes and binary phenotypes, re-spectively. Similar to previous scenarios, we also evaluated the statistical power for both unidirectional and bidirectional effect sizes.
Simulation results
We applied all statistical methods, including FGRF-O, FGRF-B, FGRF-W, FGRF-F, GSKAT and Burden test, to each simulation replicate evaluating their performance. All simu-lations were conducted in R version 3.1.1. Both FGRF and GSKAT used the generalized estimating equation for statistical inference, while the Burden testfirst collapsed all rare variants
and then applied the “gee”function in R. Each simulation
scenario was repeated 10,000 times to evaluate type I error Table 1 Summary of simulation scenarios
Scenario Description
S0.a Type I error rates in the absence of population stratification
All subpopulations have same baseline phenotype or disease prevalence S0.b Type I error rates in the presence of population stratification
Subpopulations have a shift of baseline phenotype or disease prevalence
S1 Statistical power when there is no genetic heterogeneity
“All unhappy families are alike”
S2 Statistical power when genetic heterogeneity is caused by rare variants that remain polymorphic in one or more major human populations
“Each unhappy population is unhappy in its own way”
S3 Statistical power when genetic heterogeneity is caused by private mutations that are restricted to probands and immediate relatives
“Each unhappy family is unhappy in its own way”
Features considered in each simulation scenario
Type of phenotypes Quantitative phenotype
Binary phenotype
Type of family structure Nuclear families: two parents and two offspring Three-generation families with eight members
A mixture of nuclear families and three-generation families Type of effect Unidirectional: all causal variants increase phenotype or disease risk
Bidirectional: each causal variant randomly increases or decreases phenotype or disease risk
Table 2 Fourteen ethnicity groups in the simulation to mimic population admixture
Abbreviation Subpopulation No. of Samples
ASW African ancestry in Southwest USA 61
CEU Utah residents with Northern and Western European ancestry 85
CHB Han Chinese in Beijing, China 97
CHS Southern Han Chinese 100
CLM Colombians from Medellin, Colombia 60
FIN Finnish in Finland 93
GBR British in England and Scotland 89
IBS Iberian population in Spain 14
JPT Japanese in Tokyo, Japan 89
LWK Luhya in Webuye, Kenya 97
MXL Mexican ancestry from Los Angeles 66
PUR Puerto Ricans from Puerto Rico 55
TSI Tuscans in Italy 98
rates at various levels (i.e., 0.05, 0.01, and 0.001), and re-peated 1000 times to evaluate statistical power.
Type I error rates in the absence of population stratifica-tion:The results are summarized in Table 3. When
popula-tion stratification was absent, FGRF-O, FGRF-B, and GSKAT
had well-controlled type I error rates. FGRF-W showed con-servative type I error rates, which also led to slightly conser-vative type I error rates for FGRF-F. On the other hand, the Burden test showed slightly inflated type I error rates. The results were highly consistent for quantitative phenotypes and binary phenotypes.
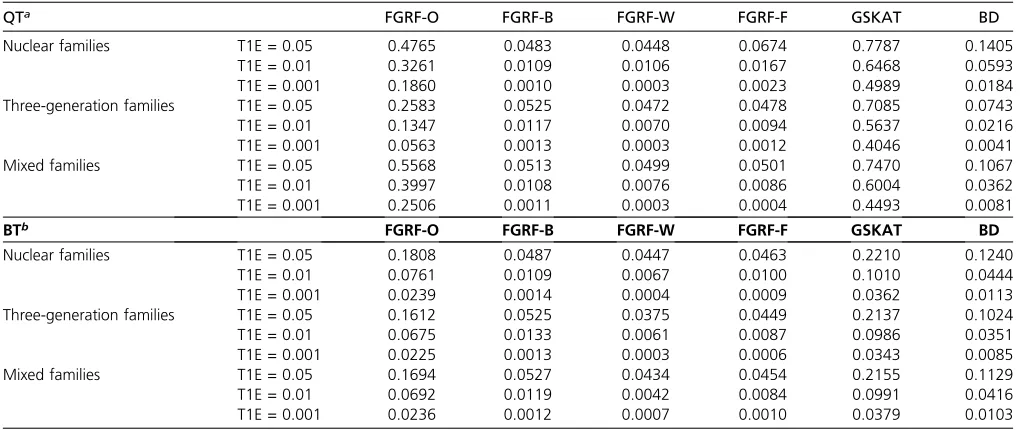
Type I error rates in the presence of population stratifi-cation:The results are summarized in Table 4. In the presence
of population stratification, FGRF-O, GSKAT and the Burden
test had inflated type I error rates. Their type I error rates were significantly higher than the intended threshold for both quan-titative and binary phenotypes. On the other hand, the type I error rates of FGRF-W, FGRF-B, and FGRF-F were robust to population stratification, which were similar to those in the ab-sence of population stratification. FGRF-B had well-controlled type I error rates, while FGRF-W and FGRF-F showed slightly conservative type I error rates. The results were highly consistent for quantitative and binary phenotypes.
Table 3 Simulation S0.a: type I error rates in the absence of population stratification
QTa FGRF-O FGRF-B FGRF-W FGRF-F GSKAT BD
Nuclear families T1E = 0.05 0.0447 0.0505 0.0422 0.0468 0.0453 0.0551
T1E = 0.01 0.0098 0.0079 0.0057 0.0073 0.0097 0.0133
T1E = 0.001 0.0013 0.0005 0.0007 0.0008 0.0015 0.0021
Three-generation families T1E = 0.05 0.0530 0.0482 0.0373 0.0427 0.0505 0.0586
T1E = 0.01 0.0104 0.0101 0.0049 0.0080 0.0111 0.0135
T1E = 0.001 0.0008 0.0011 0.0003 0.0008 0.0008 0.0024
Mixed families T1E = 0.05 0.0515 0.0465 0.0421 0.0437 0.0522 0.0565
T1E = 0.01 0.0106 0.0109 0.0069 0.0083 0.0111 0.0132
T1E = 0.001 0.0012 0.0013 0.0002 0.0004 0.0011 0.0023
BTb FGRF-O FGRF-B FGRF-W FGRF-F GSKAT BD
Nuclear families T1E = 0.05 0.0503 0.0492 0.0398 0.0440 0.0515 0.0548
T1E = 0.01 0.0129 0.0100 0.0051 0.0072 0.0128 0.0136
T1E = 0.001 0.0021 0.0014 0.0002 0.0004 0.0022 0.0008
Three-generation families T1E = 0.05 0.0551 0.0539 0.0354 0.0443 0.0559 0.0571
T1E = 0.01 0.0152 0.0120 0.0042 0.0086 0.0147 0.0135
T1E = 0.001 0.0025 0.0018 0.0002 0.0010 0.0017 0.0016
Mixed families T1E = 0.05 0.0527 0.0503 0.0408 0.0432 0.0529 0.0554
T1E = 0.01 0.0122 0.0089 0.0057 0.0065 0.0115 0.0126
T1E = 0.001 0.0020 0.0012 0.0001 0.0011 0.0022 0.0012
a
Quantitative phenotype.
bBinary phenotype.
Table 4 Simulation S0.b: type I error rates in the presence of population stratification
QTa FGRF-O FGRF-B FGRF-W FGRF-F GSKAT BD
Nuclear families T1E = 0.05 0.4765 0.0483 0.0448 0.0674 0.7787 0.1405
T1E = 0.01 0.3261 0.0109 0.0106 0.0167 0.6468 0.0593
T1E = 0.001 0.1860 0.0010 0.0003 0.0023 0.4989 0.0184
Three-generation families T1E = 0.05 0.2583 0.0525 0.0472 0.0478 0.7085 0.0743
T1E = 0.01 0.1347 0.0117 0.0070 0.0094 0.5637 0.0216
T1E = 0.001 0.0563 0.0013 0.0003 0.0012 0.4046 0.0041
Mixed families T1E = 0.05 0.5568 0.0513 0.0499 0.0501 0.7470 0.1067
T1E = 0.01 0.3997 0.0108 0.0076 0.0086 0.6004 0.0362
T1E = 0.001 0.2506 0.0011 0.0003 0.0004 0.4493 0.0081
BTb FGRF-O FGRF-B FGRF-W FGRF-F GSKAT BD
Nuclear families T1E = 0.05 0.1808 0.0487 0.0447 0.0463 0.2210 0.1240
T1E = 0.01 0.0761 0.0109 0.0067 0.0100 0.1010 0.0444
T1E = 0.001 0.0239 0.0014 0.0004 0.0009 0.0362 0.0113
Three-generation families T1E = 0.05 0.1612 0.0525 0.0375 0.0449 0.2137 0.1024
T1E = 0.01 0.0675 0.0133 0.0061 0.0087 0.0986 0.0351
T1E = 0.001 0.0225 0.0013 0.0003 0.0006 0.0343 0.0085
Mixed families T1E = 0.05 0.1694 0.0527 0.0434 0.0454 0.2155 0.1129
T1E = 0.01 0.0692 0.0119 0.0042 0.0084 0.0991 0.0416
T1E = 0.001 0.0236 0.0012 0.0007 0.0010 0.0379 0.0103
aQuantitative phenotype. b
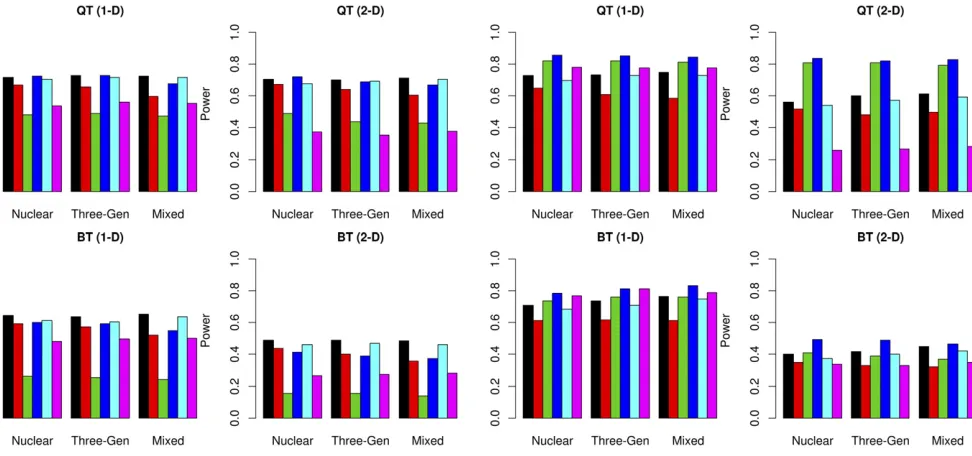
Statistical power when there is no genetic heterogeneity:
The results are summarized in Figure 3. When there is no genetic heterogeneity, FGRF-O (black) and GSKAT (cyan) had comparable power, which were higher than other meth-ods. FGRF-F (blue) had comparable power to FGRF-O or GSKAT for quantitative phenotypes, and but had a slightly reduced power for binary phenotypes. The power of FGRF-F
and FGRF-B were comparable, both of which were signifi
-cantly higher than that of FGRF-W and the Burden test. This result indicates that the power of FGRF-F was driven largely by the power of FGRF-B (red) under this scenario. GSKAT and all the FGRF-based tests were robust to the directionality of effect sizes, while the Burden test (magenta) had a substan-tial power loss when the effect sizes were bidirectional. When there is no genetic heterogeneity, FGRF-W tended to have the lowest power among all methods. The power of the Burden test was also substantially reduced compared to that of FGRF-O, FGRF-F, or GSKAT. The family structure did not have a major impact on the performance of the different tests. The power of all methods remained consistent for nuclear families, three-generation families, and a mixture of both nuclear and three-generation families.
Statistical power when genetic heterogeneity is caused by rare but not private mutations:The results are summarized in Figure 4. The power of all methods remained similar across three family structures. When there is genetic heterogeneity among subpopulations, FGRF-F had the highest power among all methods. In such a scenario, FGRF-F borrowed strength from both FGRF-B and FGRF-W, and attained an improved power over both of them. The power of FGRF-W
was slightly lower than that of FGRF-F, but was substantially higher than that of FGRF-B in all simulations. The power of the Burden test was comparable to that of FGRF-W when the effect sizes were unidirectional, but was the lowest among all methods when the effect sizes were bidirectional. FGRF-O and GSKAT still had comparable power in all simulations, and tended to have power in between those of FGRF-B and FGRF-W.
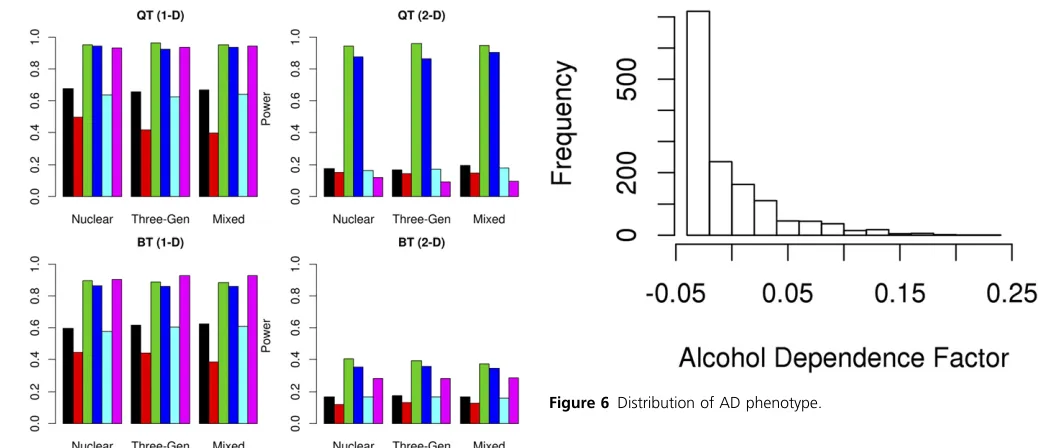
Statistical power when genetic heterogeneity is caused by private mutations:The results are summarized in Figure 5. The power of all methods remained similar across three family structures. When there is genetic heterogeneity by family, FGRF-W tend to have the highest power among all methods. The Burden test may have a power comparable to that of FGRF-W when the effect sizes were unidirectional, but suffered from a substantial power loss when the effect sizes were bidirectional. The power of FGRF-W was closely
fol-lowed by that of FGRF-F, which integrated the significance
levels of FGRF-B and FGRF-W. This result indicated that the power of FGRF-F was driven largely by FGRF-W in such a scenario. FGRF-O and GSKAT still had similar performance,
but the power of both methods was significantly lower than
that of FGRF-W and FGRF-F. In the simulations, the power of FGRF-B tended to be the lowest among all methods.
Application to an AD sequencing dataset
We further applied the proposed methods to the enrichment sample of the Minnesota Twin Family Study (MTFS). MTFS is a longitudinal study of twins born in the state of Minnesota between 1972 and 1984. MTFS was initiated in 1989 with 1400 pairs of identical and same-sex fraternal twins and Figure 3 Simulation S1: Statistical power of all methods when there is no
genetic heterogenerity. QT: Quantitative Trait; BT: Binary Trait. 1-D: Effect of causal variants is unidirectional; 2-D: Effect of causal variants is bidi-rectional. Black: FGRF-O; Red: FGRF-B; Green: FGRF-W; Blue: FGRF-F; Cyan: GSKAT; Magenta: Burden test.
their parents (Iaconoet al.1999). So far, over 9800 individu-als have participated in MTFS. Since 2000, the enrichment sample of MTFS was established to enhance the representa-tion of twins at high risk for the development of substance use. MTFS participating families were selected into the en-richment sample only if at least one twin member exhibited
symptoms of childhood disruptive disorders (Keyes et al.
2009). A detailed description of MTFS and the MTFS
enrich-ment sample can be found elsewhere (Iacono et al. 1999;
Keyeset al.2009).
Our study population comprised a total of 1431 individuals from 681 families, including 321 singletons, 59 two-member families, 212 three-member families, and 89 completed nu-clear families with four members. Each individual was assessed for various substance-related phenotypes, such as alcohol, nicotine and other illicit drug dependence. The phenotypic measures were based on protocols of the Sub-stance Abuse Module (SAM) of the Composite International Diagnostic Interview. The detailed description of the pheno-types and diagnostic criteria can be found elsewhere (Hicks
et al.2011). In our study, we focused on an AD factor, which summarized various aspects of problematic alcohol use, such as social and occupational problems, withdrawal and toler-ance, and compulsive drinking and impairment in major life activities. The AD factor was quantitative in its original scale. Its distribution is illustrated in Figure 6.
Each individual was whole-genome sequenced. Similar to our simulations, we focused on rare variants and removed common variants with a minor allele frequency of 5% or larger. The number of rare variants varied largely across genes. After we removed common variants, a total of 18,127 genes
har-bored two or more genetic variants. We then evaluated the association between the AD factor and each of these 18,127 genes by using the FGRF-based methods, GSKAT, and the
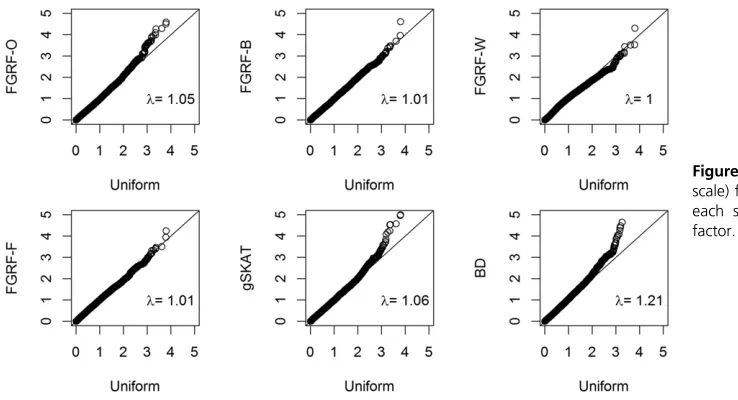
Burden test. Figure 7 shows the quantile–quantile (Q–Q)
plots of the observed P-values from gene-level analyses vs.
the expectedP-values under the null hypothesis of no asso-ciation (i.e., uniform distribution). The observedP-values by
using GSKAT and all FGRF-based tests showed no significant
deviation from the null distribution, indicating that
popula-tion stratification was not a major concern in our data.
FGRF-O and GSKAT had similar genomic inflation factor
(i.e., l = 1.05 and l = 1.06, respectively). However, the
observedP-values from the Burden test showed some infl
a-tion (i.e.,l= 1.21).
The top genes identified by either FGRF or GSKAT are
summarized in Table 5. The results showed that a total
of 10 genes were identified using a significance level of
P,0.0001. The results of GSKAT and FGRF-O were highly
consistent with very similar P-values. Four genes (i.e., C9,
PNP,RPLP2, andPTCHD2) were significant in both methods. One gene (i.e.,OR10H2) and four genes (i.e.,LOC100133267,
ANHX,ZNF268, andUNC5B) were significant only by using FGRF-O or GSKAT, respectively. However, theP-values of these
five genes were very close by using both methods, all of which were at least marginally significant at a level of 1.0e204. For thefirst nine genes listed in Table 5, FGRF-W gaveP-values. 0.1. We hypothesize that there is no genetic heterogeneity for these nine genes. Interestingly, we found that one gene (i.e.,
SAMD14) was only significant when using FGRF-W. FGRF-F also achieved marginal significance for this gene. We hypoth-esize that there is genetic heterogeneity within this gene. In such a scenario, FGRF-W or FGRF-F would have a substantial power improvement over FGRF-O or GSKAT.
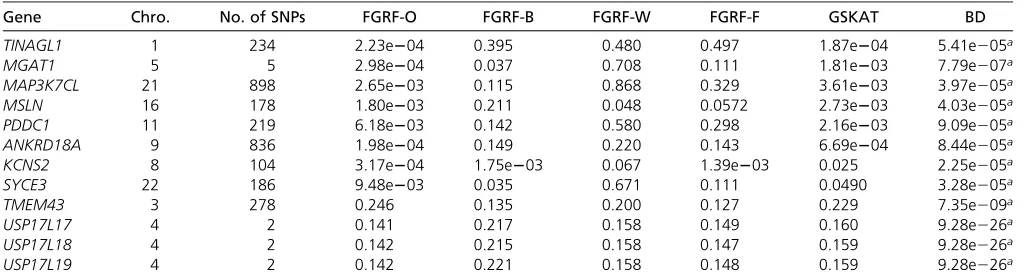
The top genes identified by the Burden test are summarized in Table 6. A total of 12 genes were identified using a thresh-old of 1.0e204 as the significant level. None of these 12 genes
overlapped with those 10 genes identified by FGRF or
Figure 5 Simulation S3: statistical power of all methods when genetic heterogenerity is caused by private mutations. QT, Quantitative Trait; BT, Binary Trait. 1-D: Effect of causal variants is unidirectional; 2-D: Effect of causal variants is bidirectional. Black: O; Red: B; Green: FGRF-W; Blue: FGRF-F; Cyan: GSKAT; Magenta: Burden test.
GSKAT. Three genes (i.e., USP17L17, USP17L18, and
USP17L19) appeared to be false positives due to the limited number of rare variants within these genes. The collapsed variant remained rare in the population, leading to incorrect inference based on the asymptotic test. This could also be the main reason for the early departure from the null hypothesis observed in the Q–Q plot of the Burden test (i.e., genomic
inflation factorl= 1.21). Among the remaining nine genes
in Table 6, eight (i.e.,TINAGL1,MGAT1,MAP3K7CL,MSLN,
PDDC1,ANKRD18A,KCNS2,SYCE3) were marginally signif-icant either in FGRF-O or GSKAT. We hypothesize that there is no genetic heterogeneity within these genes, and that the causal variants within these genes had unidirectional effect sizes. In such a scenario, the Burden test may achieve a com-parable or higher power than FGRF-O and GSKAT.
Discussion
We have proposed a randomfield framework, referred to as
FGRF, for detecting gene–phenotype association in
family-based sequencing studies. FGRF leads to a comprehensive group of tests suitable for various disease scenarios in terms of genetic heterogeneity and population stratification, in-cluding an overall test (FGRF-O), a between-family test (FGRF-B), a within-family test (FGRF-W), and a Fisher’s
com-binational probability test (FGRF-F). Although the four tests
(i.e., FGRF-O, FGRF-W, FGRF-B, and FGRF-F) are developed
under the random field framework, they are essentially
different tests that utilize different sources of information or different strategies to build test statistics. Therefore, their performances could vary according to the underlying sce-nario (e.g., presence of genetic heterogeneity). When there is no genetic heterogeneity, FGRF-O, which has a similar per-formance with existing methods such as the GSKAT, would be the best option. When there is genetic heterogeneity, FGRF-W, and FGRF-F would be good options as both can use the within-family information to consider genetic hetero-geneity. In the presence of population stratification, caution should be taken before applying FGRF-O, GSKAT, or the Bur-den test, all of which would have inflated type I error rates. Under such a scenario, FGRF-W and FGRF-F utilize within-family information to provide robustness against population
stratification. In reality, when one does not know whether
genetic heterogeneity or population stratification exists, we recommend FGRF-F. In our simulations, FGRF-F rarely has the highest power among all methods, but it is usually very close to the method with the highest power, and can be sub-stantially better than methods with the lowest power.
The proposed FGRF is suitable for multi-locus association tests in family-based studies. A number of multi-locus tests Figure 7 Q–Q plots of P-values (logarithm scale) for gene-based association tests by using each statistical method. l: Genomic inflation factor.
Table 5 Top genes identified by using the FGRF and the GSKAT (threshold of 1e204)
Gene Chro. No. of SNPs FGRF-O FGRF-B FGRF-W FGRF-F GSKAT BD
C9 5 842 7.93e205a 0.361 0.933 0.714 2.93e205a 0.074
PNP 14 122 4.97e205a 0.031 0.282 0.056 2.61e205a 0.068
RPLP2 11 149 3.16e205a 0.033 0.218 0.049 5.64e205a 2.58e203
PTCHD2 1 584 5.33e205a 0.308 0.235 0.259 6.55e205a 0.058
OR10H2 19 95 2.56e205a 5.57e203 0.977 0.020 6.54e204 1.43e203
LOC100133267 8 29 1.25e204 0.587 0.103 0.227 2.90e205a 0.258
ANHX 12 217 1.11e204 0.223 0.303 0.262 9.81e206a 0.73
ZNF268 12 352 1.03e204 0.358 0.857 0.668 1.08e205a 2.58e203
UNC5B 10 846 5.86e204 0.030 0.299 0.0531 8.25e205a 0.020
SAMD14 17 202 0.340 0.539 4.92e205a 3.12e204 0.334 0.670
a
were previously proposed by considering the LD and linkage
information (Louet al.2005; Li and Wu 2009),
demonstrat-ing the strength of family-based designs. Family-based design also has a unique advantage for investigating genetic imprint-ing. A number of statistical methods have been developed
and applied to the fields of human and plant genetics
(Weinberget al.1998; Weinberg 1999; Liet al.2014b; Sui
et al. 2014; Sun et al. 2015; Zhu et al. 2015). While the current version of FGRF does not model parent-of-origin fects, it can be extended to consider genetic imprinting ef-fects. This is an interesting topic worth further investigation in future work.
We have used our new approach to search for disease-susceptibility genes underlying AD. Several genes were
iden-tified, includingSAMD14, which was identified by FGRF-W
alone. This indicates potential genetic heterogeneity of
SAMD14across families.SAMD14is located on chromosome region 17q21.33, and its function is not completely
under-stood. Previous studies indicatedSAMD14might be a
puta-tive tumor suppressor gene. The DNA methylation within
SAMD14is associated with silencing of its expression leading
to lung cancer and its malignant progression (Sun et al.
2008). FGRF-O and GSKAT gave consistent association re-sults for a number of genes, includingC9,RPLP2,PTCHD2,
OR10H2,LOC100133267,ANHX,ZNF268, andUNC5B. Gene
C9, complement component 9, was located on chromosome
region 5p14-p12. It encodes thefinal component of the
com-plement system, and mutation within this gene is found to
be associated with complement component 9 deficiency,
age-related macular degeneration, and chronic kidney disease (Köttgenet al.2010; Seddonet al.2013). GenePNP, purine nucleoside phosphorylase, was located on chromosome 14q13.1. It encodes an enzyme that reversibly catalyzes the phosphorolysis of purine nucleosides. Mutations within gene
PNPmay lead to nucleoside phosphorylase deficiency, which
is often characterized by autoimmune disorders, lupus eryth-ematosus, and neurological symptoms, such as developmen-tal decline, hypotonia, and mendevelopmen-tal retardation (Markert 1991; Walkeret al.2011; Kariukiet al.2015). GeneRPLP2, ribosomal protein lateral stalk subunit P2, was located on chromosome 11p15.5. It encodes a ribosomal
phosphotein playing an important role in the elongation step of
pro-tein synthesis. GeneRPLP2was suggested to be involved in
the development of systemic lupus erythematosus (Rhyner
et al.2011). GenePTCHD2, also known as dispatched RND
transporter family member 3 orDISP3, was located on
chro-mosome 1p36.22. It is highly expressed in neural tissues, and implicated with neural differentiation (Zikováet al.2014). Gene OR10H2, olfactory receptor family 10 subfamily H member 2, was located on chromosome 19p13.1. Olfactory receptors initiate the odor perception by interacting with odorant molecules in the nose, resulting a neuronal response that triggers the perception of a smell (Malnicet al.2004). GeneZNF268, zincfinger protein 268, was located on chro-mosome 12q24.33. Previous studies have indicated that gene
ZNF268may be involved in fetal liver development, hemato-logical diseases, cervical cancer. and ovarian cancer (Sun
et al. 2004; Wang et al. 2012; Hu et al. 2013). Gene
UNC5B, unc-5 netrin receptor B, was located on chromosome 10q22.1. This gene encodes a member of the netrin family of receptors. The encoded protein also belongs to a group of dependence receptors suggested to be involved in
embryo-genesis (Dakouane-Giudicelliet al.2011), and development
of various types of cancers, such as bladder (Liuet al.2013), colorectal (Okazakiet al.2012), prostate, and kidney (Kong
et al.2013; Zhanet al.2013).
Furthermore, the Burden test identified 12 additional genes. Considering the fact that the Burden test may have an inflated type I error rate, we limited our discussion to the eight genes (i.e.,TINAGL1,MGAT1,MAP3K7CL,MSLN,PDDC1,ANKRD18A,
KCNS2, and SYCE3) showing at least nominal significance
level by using FGRF-O or GSKAT. GeneTINAGL1,
tubulointer-stitial nephritis antigen like 1, was located on chromosome
1p35.2. It was suggested that TINAGL1was related to lung
cancer, and could be a possible candidate for drug compounds
(Umeyamaet al.2014). GeneMGAT1, mannosyl (alpha-1, 3)–
glycoprotein beta-1,2-N-acetylglucosaminyltransferase, was
located on chromosome 5q35. GeneMGAT1was suggested
to be associated with multiple sclerosis and obesity. (Jacobsson
et al.2012; Yuet al.2014) GeneMSLNwas located on chro-mosome 16p13.3. It encodes the protein of mesothelin, which a differentiation antigen highly expressed in several human Table 6 Top genes identified by using the Burden test (threshold of 1e204)
Gene Chro. No. of SNPs FGRF-O FGRF-B FGRF-W FGRF-F GSKAT BD
TINAGL1 1 234 2.23e204 0.395 0.480 0.497 1.87e204 5.41e205a
MGAT1 5 5 2.98e204 0.037 0.708 0.111 1.81e203 7.79e207a
MAP3K7CL 21 898 2.65e203 0.115 0.868 0.329 3.61e203 3.97e205a
MSLN 16 178 1.80e203 0.211 0.048 0.0572 2.73e203 4.03e205a
PDDC1 11 219 6.18e203 0.142 0.580 0.298 2.16e203 9.09e205a
ANKRD18A 9 836 1.98e204 0.149 0.220 0.143 6.69e204 8.44e205a
KCNS2 8 104 3.17e204 1.75e203 0.067 1.39e203 0.025 2.25e205a
SYCE3 22 186 9.48e203 0.035 0.671 0.111 0.0490 3.28e205a
TMEM43 3 278 0.246 0.135 0.200 0.127 0.229 7.35e209a
USP17L17 4 2 0.141 0.217 0.158 0.149 0.160 9.28e226a
USP17L18 4 2 0.142 0.215 0.158 0.147 0.159 9.28e226a
USP17L19 4 2 0.142 0.221 0.158 0.148 0.159 9.28e226a
a
cancers, including pancreatic, ovarian, and lung cancers (Arganiet al.2001; Ordóñez 2003; Hassanet al.2005). Gene
ANKRD18A, ankyrin repeat domain 18A, was located on chro-mosome 9p13.1. It was suggested that hypermethylation and consequent mRNA alterations might be an important
mecha-nism leading to the development of lung cancer (Liu et al.
2012). GeneSYCE3, synaptonemal complex central element
protein 3, was located on chromosome 22q13.33. During mei-osis, the synaptonemal complex mediates synapsis of homol-ogous chromosomes. As evidenced by animal models, gene
SYCE3could be functional related to fertility (Schrammet al.
2011).
We hypothesized that the identified genes may have
dis-tinct mechanisms in terms of genetic heterogeneity. Our pro-posed method is especially advantageous when there is genetic heterogeneity across families. While it is biologically plausible that these genes could play essential roles in the development of AD, these interpretations are speculations based on our simulation studies. Further studies are necessary to replicate or validate thesefindings.
Acknowledgments
We thank Scott Vrieze, Matt Mc Gue, and S. Alexandra Burt for helping us access the whole-genome sequencing data from the Minnesota Twin Study. This research was sup-ported, in part, by the National Institute on Drug Abuse under award number R01DA043501, the National Library of Medicine under award number R01LM012848, the National Heart, Lung and Blood Institute under award number
K01HL140333, theEunice Kennedy ShriverNational Institute
of Child Health and Human Development under award number R03HD092854, and the National Center for Ad-vancing Translational Sciences through Indiana Clinical and Translational Sciences Institute under award number UL1TR001108. The content is solely the responsibility of authors and does not necessarily represent the official views of the National Institutes of Health.
Literature Cited
Adler, R. J., and J. E. Taylor, 2007 Random Field and Geometry. Springer, New York.
Argani, P., C. Iacobuzio-Donahue, B. Ryu, C. Rosty, M. Goggins
et al., 2001 Mesothelin is overexpressed in the vast majority of ductal adenocarcinomas of the pancreas: identification of a new pancreatic cancer marker by serial analysis of gene expres-sion (SAGE). Clin. Cancer Res. 7: 3862–3868.
Berg, K. A., J. A. Astemborski, J. A. Boughman, and C. Ferencz, 1989 Congenital cardiovascular malformations in twins and triplets from a population-based study. Am. J. Dis. Child. 143: 1461–1463.
Boos, D. D., 1992 On generalized score tests. Am. Stat. 46: 327–333. Chen, H., J. B. Meigs, and J. Dupuis, 2013 Sequence kernel asso-ciation test for quantitative traits in family samples. Genet. Epi-demiol. 37: 196–204.https://doi.org/10.1002/gepi.21703
Cirulli, E. T., and D. B. Goldstein, 2010 Uncovering the roles of rare variants in common disease through whole-genome
se-quencing. Nat. Rev. Genet. 11: 415–425. https://doi.org/ 10.1038/nrg2779
Dakouane-Giudicelli, M., N. Alfaidy, P. Bayle, A. Tassin de Nonne-ville, V. Studeret al., 2011 Hypoxia-inducible factor 1 controls the expression of the uncoordinated-5-B receptor, but not of netrin-1, in first trimester human placenta. Int. J. Dev. Biol. 55: 981–987.https://doi.org/10.1387/ijdb.103276md
Fisher, R. A., 1925 Statistical Methods for Research Workers. Oliver and Boyd, Edinburgh.
Hassan, R., R. J. Kreitman, I. Pastan, and M. C. Willingham, 2005 Localization of mesothelin in epithelial ovarian cancer. Appl. Immunohistochem. Mol. Morphol. 13: 243–247.https:// doi.org/10.1097/01.pai.00000141545.36485.d6
Hauser, E. R., R. M. Watanabe, W. L. Duren, M. P. Bass, C. D. Langefeldet al., 2004 Ordered subset analysis in genetic link-age mapping of complex traits. Genet. Epidemiol. 27: 53–63.
https://doi.org/10.1002/gepi.20000
He, Z., B. J. O’Roak, J. D. Smith, G. Wang, S. Hooker et al., 2014a Rare-variant extensions of the transmission disequilibrium test: application to autism exome sequence data. Am. J. Hum. Genet. 94: 33–46.https://doi.org/10.1016/j.ajhg.2013.11.021
He, Z., M. Zhang, X. Zhan, and Q. Lu, 2014b Modeling and test-ing for joint association ustest-ing a genetic random field model. Biometrics 70: 471–479.https://doi.org/10.1111/biom.12160
Hicks, B. M., B. D. Schalet, S. M. Malone, W. G. Iacono, and M. McGue, 2011 Psychometric and genetic architecture of sub-stance use disorder and behavioral disinhibition measures for gene association studies. Behav. Genet. 41: 459–475.https:// doi.org/10.1007/s10519-010-9417-2
Hu, L., W. Wang, J. Cai, J. Luo, Y. Huanget al., 2013 Aberrant expression of ZNF268 alters the growth and migration of ovar-ian cancer cells. Oncol. Lett. 6: 49–54.https://doi.org/10.3892/ ol.2013.1318
Iacono, W. G., S. R. Carlson, J. Taylor, I. J. Elkins, and M. McGue, 1999 Behavioral disinhibition and the development of sub-stance-use disorders:findings from the Minnesota Twin Family Study. Dev. Psychopathol. 11: 869–900.https://doi.org/10.1017/ S0954579499002369
Ionita-Laza, I., S. Lee, V. Makarov, J. D. Buxbaum, and X. Lin, 2013 Family-based association tests for sequence data, and comparisons with population-based association tests. Eur. J. Hum. Genet. 21: 1158–1162. https://doi.org/10.1038/ ejhg.2012.308
Jacobsson, J. A., M. Rask-Andersen, U. Riserus, G. Moschonis, A. Koumpitskiet al., 2012 Genetic variants near the MGAT1 gene are associated with body weight, BMI and fatty acid metabolism among adults and children. Int. J. Obes. 36: 119–129.https:// doi.org/10.1038/ijo.2011.11
Kariuki, S. N., Y. Ghodke-Puranik, J. M. Dorschner, B. S. Chrabot, J. A. Kellyet al., 2015 Genetic analysis of the pathogenic mo-lecular sub-phenotype interferon-alpha identifies multiple novel loci involved in systemic lupus erythematosus. Genes Immun. 16: 15–23.https://doi.org/10.1038/gene.2014.57
Keyes, M. A., S. M. Malone, I. J. Elkins, L. N. Legrand, M. McGue
et al., 2009 The enrichment study of the Minnesota twin fam-ily study: increasing the yield of twin families at high risk for externalizing psychopathology. Twin Res. Hum. Genet. 12: 489– 501.https://doi.org/10.1375/twin.12.5.489
Kiezun, A., K. Garimella, R. Do, N. O. Stitziel, B. M. Nealeet al., 2012 Exome sequencing and the genetic basis of complex traits. Nat. Genet. 44: 623–630.https://doi.org/10.1038/ng.2303
Kong, C. Z., J. Liu, L. Liu, Z. Zhang, and K. F. Guo, 2013 Interactional expression of netrin-1 and its dependence receptor UNC5B in prostate carcinoma. Tumour Biol. 34: 2765– 2772.https://doi.org/10.1007/s13277-013-0834-8
kidney disease. Nat. Genet. 42: 376–384. https://doi.org/ 10.1038/ng.568
Lee, S., M. J. Emond, M. J. Bamshad, K. C. Barnes, M. J. Rieder
et al., 2012 Optimal unified approach for rare-variant associa-tion testing with applicaassocia-tion to small-sample case-control whole-exome sequencing studies. Am. J. Hum. Genet. 91: 224–237.https://doi.org/10.1016/j.ajhg.2012.06.007
Li, M., Z. He, M. Zhang, X. Zhan, C. Weiet al., 2014a A general-ized genetic random field method for the genetic association analysis of sequencing data. Genet. Epidemiol. 38: 242–253.
https://doi.org/10.1002/gepi.21790
Li, Q., and R. Wu, 2009 A multilocus model for constructing a linkage disequilibrium map in human populations. Stat. Appl. Genet. Mol. Biol. 8: Article 18. https://doi.org/10.2202/1544-6115.1419
Li, X., Y. Sui, T. Liu, J. Wang, Y. Li et al., 2014b A model for family-based case-control studies of genetic imprinting and epis-tasis. Brief. Bioinform. 15: 1069–1079.https://doi.org/10.1093/ bib/bbt050
Liang, K. Y., and S. L. Zeger, 1986 Longitudinal data analysis using generalized linear models. Biometrika 73: 13–22.https:// doi.org/10.1093/biomet/73.1.13
Liu, J., Z. Zhang, Z. H. Li, and C. Z. Kong, 2013 Clinical signifi -cance of UNC5B expression in bladder -cancer. Tumour Biol. 34: 2099–2108.https://doi.org/10.1007/s13277-012-0532-y
Liu, W. B., F. Han, X. Jiang, L. J. Yang, Y. H. Li et al., 2012 ANKRD18A as a novel epigenetic regulation gene in lung cancer. Biochem. Biophys. Res. Commun. 429: 180–185.
https://doi.org/10.1016/j.bbrc.2012.10.116
Lou, X. Y., G. Casella, R. J. Todhunter, M. C. Yang, and R. Wu, 2005 A general statistical framework for unifying interval and linkage disequilibrium mapping: toward high-resolution mapping of quantitative traits. J. Am. Stat. Assoc. 100: 158– 171.https://doi.org/10.1198/016214504000001295
Malnic, B., P. A. Godfrey, and L. B. Buck, 2004 The human olfac-tory receptor gene family. Proc. Natl. Acad. Sci. USA 101: 2584– 2589 (erratum: Proc. Natl. Acad. Sci. USA 101: 7205).https:// doi.org/10.1073/pnas.0307882100
Marchini, J., L. R. Cardon, M. S. Phillips, and P. Donnelly, 2004 The effects of human population structure on large ge-netic association studies. Nat. Genet. 36: 512–517.https://doi. org/10.1038/ng1337
Markert, M. L., 1991 Purine nucleoside phosphorylase deficiency. Immunodefic. Rev. 3: 45–81.
Mathieson, I., and G. McVean, 2012 Differential confounding of rare and common variants in spatially structured populations. Nat. Genet. 44: 243–246.https://doi.org/10.1038/ng.1074
McClellan, J., and M. C. King, 2010 Genetic heterogeneity in hu-man disease. Cell 141: 210–217. https://doi.org/10.1016/j. cell.2010.03.032
Okazaki, S., T. Ishikawa, S. Iida, M. Ishiguro, H. Kobayashiet al., 2012 Clinical significance of UNC5B expression in colorectal cancer. Int. J. Oncol. 40: 209–216. https://doi.org/10.3892/ ijo.2011.1201
Ordóñez, N. G., 2003 Application of mesothelin immunostaining in tumor diagnosis. Am. J. Surg. Pathol. 27: 1418–1428.
https://doi.org/10.1097/00000478-200311000-00003
Raychaudhuri, S., O. Iartchouk, K. Chin, P. L. Tan, A. K. Taiet al., 2011 A rare penetrant mutation in CFH confers high risk of age-related macular degeneration. Nat. Genet. 43: 1232–1236.
https://doi.org/10.1038/ng.976
Rhyner, C., I. Daigle, and R. Crameri, 2011 Auto-reactive IgE re-sponses to acidic ribosomal P(2) protein in systemic lupus er-ythematosus. Allergy 66: 1127–1129.https://doi.org/10.1111/ j.1398-9995.2011.02581.x
Schaid, D. J., S. K. McDonnell, J. P. Sinnwell, and S. N. Thibodeau, 2013 Multiple genetic variant association testing by collapsing
and kernel methods with pedigree or population structured data. Genet. Epidemiol. 37: 409–418.https://doi.org/10.1002/ gepi.21727
Schramm, S., J. Fraune, R. Naumann, A. Hernandez-Hernandez, C. Hooget al., 2011 A novel mouse synaptonemal complex pro-tein is essential for loading of central element propro-teins, recom-bination, and fertility. PLoS Genet. 7: e1002088. https://doi. org/10.1371/journal.pgen.1002088
Seddon, J. M., Y. Yu, E. C. Miller, R. Reynolds, P. L. Tan et al., 2013 Rare variants in CFI, C3 and C9 are associated with high risk of advanced age-related macular degeneration. Nat. Genet. 45: 1366–1370.https://doi.org/10.1038/ng.2741
Sui, Y., W. Wu, Z. Wang, J. Wang, Z. Wanget al., 2014 A case-control design for testing and estimating epigenetic effects on complex diseases. Brief. Bioinform. 15: 319–326. https://doi. org/10.1093/bib/bbs085
Sun, L., X. Zhu, Q. Zhang, and R. Wu, 2015 A unifying experi-mental design for dissecting tree genomes. Trends Plant Sci. 20: 473–476.https://doi.org/10.1016/j.tplants.2015.05.012
Sun, W., T. Iijima, J. Kano, H. Kobayashi, D. Li et al., 2008 Frequent aberrant methylation of the promoter region of sterile alpha motif domain 14 in pulmonary adenocarcinoma. Cancer Sci. 99: 2177–2184. https://doi.org/10.1111/j.1349-7006.2008.00965.x
Sun, Y., H. Shao, Z. Li, J. Liu, L. Gaoet al., 2004 ZNF268, a novel kruppel-like zinc finger protein, is implicated in early human liver development. Int. J. Mol. Med. 14: 971–975.
The 1000 Genomes Project ConsortiumAbecasis, G. R., D. Altshu-ler, A. Auton, L. D. Brooks, R. M. Durbinet al., 2010 A map of human genome variation from population-scale sequencing. Na-ture 467: 1061–1073 [corrigenda: Nature 473: 544 (2011)].
https://doi.org/10.1038/nature09534
Umeyama, H., M. Iwadate, and Y. H. Taguchi, 2014 TINAGL1 and B3GALNT1 are potential therapy target genes to suppress me-tastasis in non-small cell lung cancer. BMC Genomics 15: S2.
https://doi.org/10.1186/1471-2164-15-S9-S2
Walker, P. L., A. Corrigan, M. Arenas, E. Escuredo, L. Fairbanks
et al., 2011 Purine nucleoside phosphorylase deficiency: a mu-tation update. Nucleosides Nucleotides Nucleic Acids 30: 1243– 1247.https://doi.org/10.1080/15257770.2011.630852
Wang, W., M. Guo, L. Hu, J. Cai, Y. Zenget al., 2012 The zinc finger protein ZNF268 is overexpressed in human cervical can-cer and contributes to tumorigenesis via enhancing NF-kappaB signaling. J. Biol. Chem. 287: 42856–42866. https://doi.org/ 10.1074/jbc.M112.399923
Wang, X., S. Lee, X. Zhu, S. Redline, and X. Lin, 2013 GEE-based SNP set association test for continuous and discrete traits in family-based association studies. Genet. Epidemiol. 37: 778– 786.https://doi.org/10.1002/gepi.21763
Weinberg, C. R., 1999 Methods for detection of parent-of-origin effects in genetic studies of case-parents triads. Am. J. Hum. Genet. 65: 229–235.https://doi.org/10.1086/302466
Weinberg, C. R., A. J. Wilcox, and R. T. Lie, 1998 A log-linear approach to case-parent-triad data: assessing effects of disease genes that act either directly or through maternal effects and that may be subject to parental imprinting. Am. J. Hum. Genet. 62: 969–978.https://doi.org/10.1086/301802
Wu, M. C., S. Lee, T. Cai, Y. Li, M. Boehnke et al., 2011 Rare-variant association testing for sequencing data with the se-quence kernel association test. Am. J. Hum. Genet. 89: 82–93.
https://doi.org/10.1016/j.ajhg.2011.05.029
Yang, J., S. H. Lee, M. E. Goddard, and P. M. Visscher, 2011 GCTA: a tool for genome-wide complex trait analysis. Am. J. Hum. Genet. 88: 76–82. https://doi.org/10.1016/j. ajhg.2010.11.011
epistatic effects between MGAT1 and three other polymor-phisms. Genes Immun. 15: 218–223.https://doi.org/10.1038/ gene.2014.7
Zhan, B., C. Kong, K. Guo, and Z. Zhang, 2013 PKCalpha is in-volved in the progression of kidney carcinoma through regulat-ing netrin-1/UNC5B signalregulat-ing pathway. Tumour Biol. 34: 1759– 1766.https://doi.org/10.1007/s13277-013-0714-2
Zhu, X., F. Xu, S. Zhao, W. Bo, L. Jianget al., 2015 Inferring the evolutionary history of outcrossing populations through
com-puting a multiallelic linkage–linkage disequilibrium map. Meth-ods Ecol. Evol. 6: 1259–1269. https://doi.org/10.1111/2041-210X.12428
Ziková, M., J. Koniˇrová, K. Ditrychová, A. Corlett, M. Kolaˇret al., 2014 DISP3 promotes proliferation and delays differentiation of neural progenitor cells. FEBS Lett. 588: 4071–4077.https:// doi.org/10.1016/j.febslet.2014.09.036