ANALYSIS OF HOUSEHOLD FOOD INSECURITY AND
THE IMPLICATION OF MEASUREMENT ERROR,
MANDERA COUNTY, KENYA
MWENJERI G WAITHAKA. (BSC, MSC)
A99/22787/2011
A Research Thesis Report Submitted In Fulfillment of the
Requirement for the Degree of Doctor of Philosophy in Agricultural
Economics,
Kenyatta University
DECLARATION
This thesis report is my original work and has not been presented for a degree in any other university.
Signature………Date……….. Mwenjeri Gabriel Waithaka (A99/22878/2011)
Department of agribusiness management and trade Kenyatta University
SUPERVISORS
We confirm that the work reported in this thesis was carried out by the candidate under our supervision and has been submitted with our approval as the university supervisors.
Signature………Date……….. Prof. Bernard Njehia
Department of agribusiness management and trade Kenyatta University, Nairobi
Signature………Date……….. Prof. Samuel Mwakubo
Department of agricultural Economics and Resource Management Moi University, Eldoret
DEDICATION
ACKNOWLEDGEMENTS
Even though the PhD. corridor is a solo march; I have benefited enormously from the guidance and support of several people along the way.
I am especially indebted to the 325 respondents who willingly and freely gave me their time and needed information. Special thanks to my field assistants, Halkano Jarso, Charles Mwangi and the rest of the team for their selfless effort during the process of data collection.
I wish to acknowledge with gratitude the guidance of my University supervisors, Prof Bernard Njehia, Department of Agribusiness management and Trade, Kenyatta University and Prof. Samuel Mwakubo of Moi University, Department of Economics and Agricultural Resource Management.
I also wish to acknowledge my wife Safia, children Philip, James and Frances whom without their love, patience and understanding, I would never have come this far. Thank you for your continued support.
TABLE OF CONTENTS
Title page i
Declaration ii
Dedication iii
Acknowledgements iv
Table of contents v
List of Tables viii
List of Text Boxes ix
List of Figures x
List of Appendices xi
Abbreviations xii
Abstract xiii
Chapter 1: Introduction 1
1.0 Preamble 1
1.1. Background Information 1
1.2 Problem Statement 6
1.3 General Objectives 7
1.4 Specific Objectives 7
1.5 Hypothesis 7
1.6 Significance of the study 8
1.7 Study Area 9
Chapter 2: Literature review 11
2.0 Introduction 11
2.1 Concept of food insecurity measurement 11
2.2 Estimation of consumer demand and household expenditure 13
2.3 Empirical measurement of food insecurity 16
2.4 Research Gaps 20
Chapter 3: Methodology 22
3.0 Introduction 22
3.2 Theoretical Framework 25 3.3 Instrumental variable in General Method of Moments (IV-GMM) 28
3.4 Cost of Basic Needs Method (CBN) 32
3.4.1 Surplus/Shortfall Index 33
3.4.2 Adult equivalent factors 34
3.5 Food insecurity depth analysis 35
3.6 Data collection 36
3.6.1 Sampling Design and Sample size determination 36
3.6.2 Data collection methods 37
3.6.3 Data types and sources 38
3.7 Data Analysis 39
Chapter 4: Results and Discussion 41
4.0 Introduction 41
4.1 Sex of household head 42
4.2 Major sources of Food 44
4.3 Major Household Income sources 45
4.4 Food budget for households in Mandera County 46
4.5 Relationship between food share and Household expenditure –
Non Parametric analysis 48
4.6 Food insecurity Levels for Mandera households 48
4.7 Food insecurity estimates with measurement error-
Standard OLS regression results 52
4.8 Food insecurity measurement with corrected Measurement Error-
IV-GMM Estimates 53
4.9 Measurement error in household insecurity analysis 57
4.9.1 Food insecurity gap for Households in Mandera 59
4.10 Responsiveness of the household food expenditure estimates 60
4.11 Implication to Food security Policy 62
5.0 Introduction 69
5.1 Summary of findings 69
5.2 Conclusions 71
5.3 Policy Recommendations 72
LIST OF TABLES
Table 3.1 Adult-equivalent conversion factors 34
Table 3.2 Data Design 38
Table 4.1 Gender of the household head 41
Table 4.2 Household food sources 42
Table 4.3 Household Income sources 43
Table 4.4 Food expenditure for household in Mandera County 44
Table 4.5: Cost of Basic needs for Mandera households 48
Table 4.6 Household food insecurity indices for the Mandera County 49 Table 4.7 Food insecurity estimates with measurement error –
OLS robust regression estimates 52
Table 4.8 Food insecurity estimates with corrected measurement error
-IV -GMM regression estimates 54
LIST OF TEXT BOXES
LIST OF FIGURES
Figure 3.1 Conceptual frameworks of food access and consumption 24 Figure 4.1 Relationship between food budget and household expenditure- Non-
LIST OF APPENDICES
Appendix 1: Map of Mandera County 83
ABBREVIATIONS
AIDS Almost Ideal Demand System
CBN Cost of Basic Needs
FAO Food and Agriculture Organization
GMM Generalised Method of Moments
GoK Government of Kenya
HES Household Expenditure Survey
IV Instrumental variable
LES Linear Expenditure System
MDG Millennium Development Goals
OLS Ordinary Least Squares
PRSP Poverty reduction strategy paper
UK United Kingdom
UNICEF United Nations International Children Educational Fund
US United States
USAID United States of America International Development USDA United states department of Agriculture
ABSTRACT
The objective of this study was to analyze food insecurity, underlining the significance of accurate measurement to formulate the required policies for addressing food deprivation. The need for accurate measurement of food requirement is essential to generate adequate information to support decision making especially in areas vulnerable to food shortages and famine.
Using random sampling techniques and employing Fisher’s formula, a total of 323 households were selected for the study. Informed by demand theory as articulated by Engel’s law of inverse relationship between total household income and the expenditure on food, plus adding a quadratic term in the equation, the study sought to estimate the magnitude of food insecurity in Mandera County. The cost of basic needs (CBN) method was employed to provide preliminary estimate for the households’ food expenditure level. In order to deal with the problem of measurement error econometric models including ordinary least squares and using instrumental variable in generalized method of moment (IV-GMM) techniques were applied to quantitatively analyze data on quadratic Engel curve.
The study established that Mandera County experiences food deprivation of significant magnitude. The study has revealed that, observed household expenditure is not a perfect measure of the actual food insecurity situation. This is because microeconomic data are contaminated by measurement error which reduces reliability of parameters and if not addressed will result to erroneous conclusion in economic analysis. The results show negative and significant quadratic coefficients for both OLS and IV-GMM. Accordingly the results shows that for the estimator that corrects for measurement error 81% of the households are food insecure as opposed to 64%. In this study it is observed that measurement error reduces parameter reliability by 32% which leads to underestimation of food insecurity by about 17%.
CHAPTER ONE: INTRODUCTION
1.0. Preamble
This chapter provides background information on food insecurity analysis, highlights the analytical approaches and briefly expound on challenges on policy formulations emanating from these analysis. Section 1.2 presents the problem statement on information gaps on which this study is anchored, and the objectives guiding the study are presented in sections 1.3 and 1.4. Section 1.5 states the hypothesis of the study. Lastly, the chapter presents the significance of the study and describe the study area in sections 1.6 and 1.7 respectively.
1.1 Background Information
people were living on less than US$1.25 a day per capita, with almost half the world’s
population on less than US$2 a day (World Bank, 2010a). Similar reports in Kenya indicate that about a third (10 million) of the population suffer from chronic food insecurity based on dietary energy supply (GoK, 2008). As pointed out by Keyzer et al (2006), many governments and organizations such as FAO, derive their estimates from aggregate consumption data, based on food production and international trade balances, a practice that has been criticized as being sensitive to assumptions. This kind of data contains a number of gaps that compromise the results thereby resulting to interventions that are inapt. Surprisingly the situation has not provoked the required expert attention. Certainly, the problem of food insecurity requires better customized interventions that are well grounded on accurate information to address it. Unfortunately, such strategies cannot be designed when they are based on wrong targets, insufficient information or both. Reliable information is critical in answering the following essential questions in addressing food insecurity, as pointed out by Smith (2006);
• Who are the hungry?
• How many people are hungry? • What are the causes of hunger?
In Kenya, food security interventions have been directed towards improving the supply side through food production in pursuit by the government to ensure food availability primarily at the national level (GoK, 2007). The government has employed enormous resources in enhancing productivity through technological advances such as improved farm inputs including seeds, fertilizers etc, and improving access to credit and market information to enhance production. Paradoxically, these efforts have not been successful in ensuring food security for all citizens. The country continues to bear large proportion of the hungry afflicted population especially in arid and semi-arid areas which are characterized by low and inefficient production systems. Many households are continuously supported by the government and development partners through relief aid. Amatya Sen in his seminal work on food entitlements and deprivation, (Sen, 1981), sought to characterize food security as access to food (demand side) rather than food availability. He argued that food availability at the national level does not directly translate to food security both at household and individual levels. This brought to the forefront the fundamental indicator of food insecurity as the inability of the households to access food. This necessitates for paradigm shift in the approaches that the policy makers needs to adopt to contain hunger among the affected in the population. There is need to think outside the supply-based box and include the demand based policies in order to solve the problem of food insecurity in the population.
Household expenditure and consumption have widely been used in economic and poverty analysis as indicators of welfare of households as well as inform on food policies. Analogous to the Sen’s observations, food consumption data from expenditure
food demand is influenced by policies due to changes in prices and income levels (Dunne and Edkins, 2005). Food consumption data is particularly important in developing countries where the budget allocation on food is comparatively larger to other household expenditures. Ironically, household expenditure surveys in Kenya for example, have been undertaken (though not so frequent) specifically to provide a basis for poverty and welfare analysis among the population (GoK, 2001; 2003; 2007). However, food insecurity assessments continue to rely on aggregate estimates on prevailing situations in different areas through food security committees at district level (Kamau et al, 2011). This includes information on food available at the national stores, at farm levels and expected food supply from crop harvests.
Box 1: The role of district steering committee in food insecurity assessments
Source: GoK, 2005. Capacity building manual for district steering groups
District Food security steering committee is a Multi-disciplinary team from the Technical District Steering Group (DSG) under the leadership of the office of the president. It is composed of government ministries and other stakeholders related to food security at the district level.
The committee verifies existing information on the current food security situation and immediate prospects. They arrive at consensus when food security information/interventions are disputed. Food steering committees collate information on food security at the district level including:
Food available at farm levels
Expected supply from crop harvests
Food available in national stores
Food available in the market and prices
Crop condition.
livestock condition
Pests and diseases.
This information is passed to the government decision making component to form the basis for food security interventions. Nevertheless, these aggregate estimates do not shed light on households’ access to food, and therefore presents a major drawback in
formulating food security policies.
While microeconomic data is important in assessing food access, they are often contaminated by mis-measured variables that lead to biased and inconsistent parameter estimates resulting to erroneous conclusions in economic analysis (Cameron et al, 2005). Groves (1989) highlights that, cross-sectional expenditure data collected from surveys usually suffers from limitations such as interviewer's errors, errors due to respondents, and so on. This underlines the significance of correcting for such errors while answering the above questions for the development of appropriate policy instruments. However, it should be noted apriori that this study is not focused on eliminating measurement error, but highlights the importance of its correction in the analysis of demand studies to minimize biases in variable estimations.
1.2 Problem Statement
Eradicating food insecurity continues to be a socio-economic public policy mirage in many countries. This challenge is complicated by insufficient diagnostic approaches to provide accurate information on severity, magnitude and underlying causes of food insecurity. Currently, the approaches applied in determining food insecurity raise a number of concerns (Smith et al, 2006). The method most widely employed for measuring food consumption is aggregate data on food availability based on the supplies at the national level as opposed to the information indicating people’s access to food. This method’s reliability has been the subject of considerable debate (Smith et al, 2006).
1.3 General Objective
The objective of this study was to analyze food insecurity situation in Mandera County using quadratic Engel curve and households expenditure data, to highlight the importance of accurate measurement and derive policy implications required to counter food poverty.
1.4 Specific Objectives
a) To estimate the magnitude, level and extent of food insecurity problem among the households in Mandera County.
b) To determine the variance caused by the measurement error in the total household expenditure.
c) To assess the implications of measurement error on household food insecurity estimation for policy formulation.
1.5 Hypotheses
a) The degree of food insecurity experienced by households in Mandera County is not significant.
b) The variance caused by measurement error in the estimation of household food demand is not significant.
1.6 Significance of the study
In Kenya the methods of assessing food insecurity are based on the availability of food supplies in the country (national level) without due regard on accessibility at the households and individual levels. However, food availability at national level does not guarantee food security and households or individual levels. This has led to a large population being ignored in food security decisions as a result of inapt assessment. Accurate understanding of the extent of food insecurity is critical for situational analysis and to guide policy response.
policy discussions that are led by economic considerations that are prerequisite to food security.
The study provides a solid reference point in food security analysis by highlighting the effect of measurement error when using microeconomic data. It presents another milestone in applying quadratic Engel curves in measuring food insecurity and makes valuable contribution in understanding non-linear relationships in household expenditure.
1.7 The study area
Mandera County is one of the two counties in the north eastern province and it makes the northern part of the province. It lies between latitude 20 11’ north and 40 17’ and longitude 390 47’ east and 410 48’ east. The county shares international borders to the Ethiopia to the north, Somalia to the east and south east and border Wajir County to south and south west (GoK, 2004). It covers an area of 25,871 km2. The population in the district stood at 250, 372 according to 1999 population census (NB: The 2009 population census figure was disputed due to malpractices).
Water and pasture determine the population distribution and density. The county is characterized by low lying rocky hills between 400 and 700 above sea level which are located on plains from the south to the north. The river Daua passes over half of the county border with Ethiopia as it flows to the east to Somalia. The county is characterized by ‘Lagas’ (dry river beds) which get filled up by run off during the rainy season.
Rainfall is scanty and erratic with an average of 25mm. Mandera is usually very hot with mean annual temperature of 28.30c with hottest average at 38 0 c.
unreliable rainfall and very high temperatures. Most of the district is rangeland except for a strip potential for irrigation along the river Daua. The rangeland is used widely for supporting of livestock (cattle, camel, goats and sheep) which is the main economic activity in the county (GoK, Mandera district PRSP report 2001-2004).
CHAPTER TWO: LITERATURE REVIEW 2.0Introduction
The chapter on literature review is centered on three sections related to food insecurity analysis with household as the central unit for measurement. The three sections are presented as follows; detailed background information on food insecurity analysis; theoretical background involving food insecurity analysis based on household expenditure and analysis of empirical work on methods employed in food insecurity analysis. The chapter concludes with a summary highlighting the gaps that the study endeavors to address.
2.1Concepts of food insecurity measurement
Food security is an essential, universal measurement of household and personal welfare. Its absence demonstrated by food insecurity and hunger is detrimental to the wellbeing and also is potential antidotes to nutritional, health, and developmental problems.
for own-consumption; food commercialization schemes; public distribution systems with subsidized prices; or institutionalized food aid. Social access refers to acceptable food products supplied for consumption by population groups based on their cultural preferences.
Correspondingly, food insecurity refers to limited or uncertain availability and/or uncertain ability to acquire acceptable foods in socially acceptable ways (Bickel et al, 2000). Manifested through breakdown or inefficiency of food supply systems leading to food poverty, and marked by the inability of the households to access their food requirements.
Hunger is a persistent predicament especially in developing countries, worsening people’s wellbeing, productivity and often their continued existence (Smith et al, 2006).
For instance, the 2007/2008 food price crisis and subsequent global economic recession, have pushed the number of hungry to historical levels; exceeding one billion people worldwide (FAO & WFP, 2009). Surprisingly, some schools of thought indicate that world food production per capita has constantly increased since the beginning of sixties and will continue doing so till at least 2030 (FAO, 2002). However, world poverty and income inequality have unambiguously fallen over the last three decades (Sala-i-Martin, 2006), and thereby posing serious challenges in addressing food insecurity.
food deficiencies and to identify the sections of population who are food insecure and their locations to enhance interventions.
Paradoxically, accurate data and information on the magnitude of food insecurity is hard to achieve especially in developing countries where it is needed most. In Kenya for instance, food insecurity information is generated through estimates based on unstructured observations of extension workers rather than formal statistical process and survey techniques (GoK, 2011). However, these aggregate estimates do not shed light on access to food by households, and therefore presents a major drawback in formulating food security policies. This puts the country on precarious position as far as addressing food insecurity problem is concerned. The present study highlights the significance of sound diagnostic actions that are essential to policy analysts as they seek to solidify their resolve on addressing food insecurity.
2.2 Estimation of consumer demand and household expenditure
Demand theory has widely been applied to model individuals’ or households’ consumption behavior. Household expenditure is one of the important aspects of aggregate demand used to model household consumption behavior. It can be broken down to specific categories of major spending such as food, clothing or fuel consumption, to model the expenditure trend of the households.
He observed that the proportion of income spent on food declines as income increases, implying that "food is a necessity whose consumption rises less rapid than does income" (Nicholson, 1992). Engel curve describes the relationship between a household's expenditure on food and the total household expenditure. Particularly, this study is guided by the principle of consumer demand theory, whereby the consumer will arrange his pattern of expenditure in a rational manner to maximize his satisfaction (Nicholson, 1992).
luxuries and necessities at different levels of income. This is important for policy makers in food insecurity measurement since food being a necessity, it is imperative to understand the level at which household income is not enough to guarantee economic food access.
Analogous to consumption expenditures, measurement errors have been recognized in the estimation of Engel-curves (Hasegawa and Kozumi, 2001). The significance of measurement error on the implications of economic theories can be traced back to the theory of consumption advanced by Milton Friedman (Friedman, 1957). In his theory of permanent income hypothesis, indicated that consumption and income are composed of two components, namely; permanent and transitory, this can result from measurement error or a valid variation. He argued that both permanent consumption and income components are associated with marginal propensity to consume (MPC). He showed that attenuation bias causes the slope coefficient of a regression of observed income to lead to underestimation of the marginal propensity to consume (Chen, 2012).
Likewise, Lewbel (1996), observed that in a regression equation if total expenditure (independent variable) is measured with error, there is high probability that the share of individual good (dependent variable) is also likely to be measured with error. i.e. measurement errors in the dependent and independent variables need not to be independent.
estimating demand relationships from cross sectional survey data, accounting for measurement error is of paramount interest.
2.3 Empirical measurement of food insecurity
Reducing food insecurity in the developing world remains an important economic challenge, and one that is complicated by scarcity of information on the location, severity, and causes of food insecurity (Smith et al, 2006). Numerous approaches have been put forward in attempt to provide the necessary information on which to anchor food security policies.
The indicator for measuring the degree of food insecurity that is most widely employed by policymakers is the measure of “undernourishment,” or the percentage of a country’s population that does not consume sufficient dietary energy, by the Food and
Agriculture Organization of the United Nations (FAO). This approach focus on food supplies at the national level as opposed to the information indicating food accessibility at either individual or household levels. This mostly have been necessitated by lack of reliable information at the household or individual level in national surveys, however concerns have been raised that has led to action gaps in policymaking and program planning (smith et al, 2006).
household energy requirement, will be presenting inaccurate estimation. The FAO method of undernourishment relies on mean energy requirement in estimating the depth of hunger in a country or region. However, this population group approach disregards the individual own requirement which makes it inappropriate to conclude if an individual is consuming adequate dietary energy. In so doing, this method may lead to overestimation of food insecurity in some regions or underestimate others.
The report by the Central bureau of statistics of Sudan (2010) shows that though the national average is 2180 Kilo calories, rural and urban areas had different levels of 2140 and 2270 daily Kilo calories respectively. Any food insecurity measurement based on the national average would present inaccurate depth of hunger in some regions. Similar observation by Smith et al (2006) in their study on food insecurity in sub-Saharan Africa, found that methods based on aggregate food availabilities have limited use for understanding the magnitude of food insecurity and exclude information on the degree of food accessibility.
Turning to body conditions, anthropometric indicators have been widely used to give an indication of food insecurity situation. This includes measuring body tissues with an objective to assess the impact of hunger and malnutrition. This can only be measured at an individual level as opposed to household level (Thompson et al, 1998). This method is commonly applied in children and amongst the most vulnerable adults in the society. On account of food policy, anthropometric indicators poses a big challenge, in that it is difficult to determine whether the problem indicated by the body tissues is actually a food insecurity problem or from another source such as public health or diseases not related to nutrition.
On the contrary, smith et al (2006) advocates for household expenditure surveys which they argue provide reliable information and the indicators of quantity and access can be measured. The study further observed that there are discrepancies between HESs and FAO estimates, whereby the estimates of the former are found to be more strongly associated with other MDG indicators of food insecurity such as poverty than the later estimates. One major advantage of the Household Expenditure Survey (HES) method is due to the fact that food security decisions are taken at household level and the data collected represents both food choices and the extent to which households enjoy physical and economic access.
technical skills. Similarly, though household expenditure surveys are reliable in estimating food insecurity; they are prone to bias due to errors of measurement.
As pointed out by Smith et al (2006), non-sampling errors in the measurement of household food acquisition arise especially during the data collection. They identified two important types of systematic bias that may arise during data collection; first the inability of respondents recalling their food acquisition over the survey period and the second bias is as a result of telescoping i.e. whereby a respondent include events that occurred before the recall period, thus inflating estimates of the household food acquisition. Also Lewbel (1996) reported that discrepancy due to storage and wastage resulting from the time of acquiring food to consumption is a form of measurement error. Studies recognize various sources of measurement error, but this study will focus on the respondents’ inadequate ability to accurately recall their consumption levels, telescoping
bias and discrepancy due to storage and wastage as the major sources of measurement error. This is according to Sudman and Bradburn (1973) who observed that recall errors in survey expenditure are based on omission and telescoping errors generated by respondents forgetting what they consume and incorrect remembrance when they actually consume.
Lewbel (1996), in an empirical application for fuel consumption in the United Kingdom, observed that correcting measurement error changed parameter estimates by more than 15%. The instrumental variable estimation for polynomial errors-in-variable due to Hausman et al (1991, 1995) is one approach used to deal with measurement error. However, this approach corrects for measurement error on the right hand side (Independent variable) of the demand equation thereby disregarding the left side (dependent). However, as alluded by Lewbel (1996), if the independent variable (sum of goods consumed) is measured with error, subsequently the dependent variable (one or more individual goods) is also affected, since their measurement is dependent of each other.
2.4 Research gaps
Food insecurity measurement is effectively realized when anchored on the three pillars of food availability, access and stability. The above review highlights a number of drawbacks in the quest for researchers and policy makers to gauge the magnitude of food insecurity experienced by the population. First the literature presents a grim picture of inadequate information that is not based on sound statistical and analytical approaches as antidotes for making sound policy and programming decisions. On the contrary, food insecurity analysis requires solid information on which to built interventions, as exemplified by the present study.
strong lens through which prognosis of food insecurity problem can be achieved (Smith et al, 2006). However, due to the microeconomic nature of the data involved, the accuracy of the method is compromised by the problem of measurement error. Furthermore, the literature above reveals that consumer demand is typically measured with error, which means that when estimating demand models, measurement error is either neglected or it can be dealt with by using models that correct for measurement error (Lewbel 1996). Consequently, to fill this analytical gap, this study employed a model that correct for measurement error both at dependent and independent variables to eliminate biased estimation in the context of food insecurity measurement.
Finally, the review further revealed that a number of studies usually adopt the use of linear associations between food expenditure and household income and so they tend to ignore the non-linearity relationship that exists which is associated with consumer behavior. In contrast, this study endeavors to typify demand for food by households by taking advantage of quadratic Engel curves that employ non-linear variable estimators to understand and characterize household’s food demand economics in their quest to reduce
CHAPTER THREE: METHODOLOGY 3.0Introduction
The chapter presents both conceptual and theoretical frameworks underpinning the present study. Section 3.1 explains the conceptual framework on the consumption and access to food at household level. Section 3.2 examines the theory of consumer demand with reference to Engle’s law. The chapter further expounds on quadratic Engle curve and its application to
food demand analysis along with the problem of measurement error. The section also discusses the cost of basic needs approach in analyzing food insecurity. Lastly, the chapter details the process of data collection including data types and sources, methods of data collection, sampling and sample size determination and concludes with data analysis.
3.1. Conceptual framework
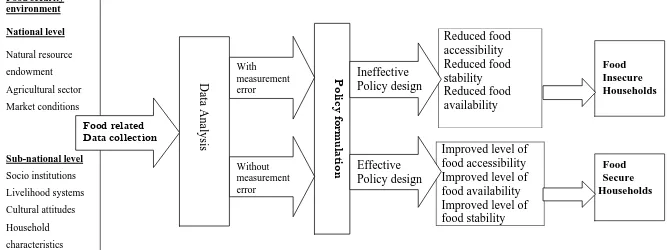
In this section the study focuses on description and definition of food security concepts and functional relationship that exist in food systems. The definitions of food security focus on processes as well as outcomes. They define not only the outcomes of food security that are useful for formulating policies and guiding actions, but the processes that lead to expected outcomes as well (FAO, 2000).The framework described below (figure 3.1) offers a holistic approach to food security processes and outcomes. The performance of these processes is essential in determining the probability of achieving food security.
production and distribution which leads to outcomes related to food security including food availability, food access and food stability.
Food availability focuses on the supply side of food security, which mainly depends on food production and exchange (trade) that boosts the stock levels that household can depend on. In food security analysis information of household productive capacity is essential in determining the degree of food availability. The amounts of food items that a household produces are expected to give an indication of the capability to meet food availability.
Accessibility to food is characterized by the economic capacity of the household and convenience of food distribution points such as markets. Insufficient food accessibility has led to shift policy focus to incomes, expenditure, markets and prices in achieving food security objectives (IFPRI, 2012). Adequate information on production based entitlement will provide the factors for policy development.
The concept of stability refers to both the availability and access dimensions of food security (FAO, 2006). Aspects that influence economic factors including expenditure, income and food prices are of major concern. Insufficient understanding of these factors in food security system, will lead to inadequate access to food at all times. Food security estimates are measured on the three pillars of availability, accessibility and stability.
Source: Modified from FAO 2000
Figure 3.1: Conceptual framework of food access and consumption
Reduced food accessibility Reduced food stability Reduced food availability
Figure 3.1 presents a process that provides statistical strategies that enables generation of information to guide policy development. Discreet data analysis will result to sound policies that lead food secure households through ensuring food availability, accessibility and stability. Measurement error is inherently associated with microeconomic data and its correction will lead to solid background to anchor the necessary food related policies. On the contrary, disregarding the problem of measurement error will lead to deficient food related policies resulting to reduced food availability, accessibility and stability thereby causing households to be food insecure. The framework provides a better understanding of how food security processes can be used for policy-making and intervention planning. It highlights the relationship of how food data collection and analysis can be improved to obtain more reliable, consistent and appropriate food security information. Data collection and analysis will always guide the policy formulation that determine the households being food secure or food insecure.
3.2 Theoretical Framework
The Neoclassical consumer demand theory holds that a negative relationship exists
between the quantity demanded for a particular product and that product's price. The
basic axiom of the utility maximization process is that a rational consumer will always
choose a most preferred bundle of goods from the feasible set of consumption bundles
allowed by his budget. Neoclassical demand theory holds that individual consumer’s
rank-order their preferences from a set of options for what to purchase and select the
combination of goods and services that will bring them the greatest amount of utility
(Nicholson, 2008). Consumer demand, then, is driven in part by what individual
demand function for food, keeping the prices constant, to depict the consumption behavior of households with different levels of total expenditure. In line with demand theory, this study was anchored on two principles. The first is Engle’s law which describes the non-linear relationship between household food expenditure and total household expenditure. The second is the classical test theory of measurement that is concerned about the accuracy of observed variables which important in decision making.
Engel’s law describes how household expenditure of a good varies with household income. According to Engel (1857) “the poorer the family, the greater the proportion of its total expenditure that must be devoted to the provision of food” i.e. as income
increases, the share of expenditure for food declines, demonstrating the shares of income spent on food are inversely related to income levels (Chen and Wallace, 2009). The theory does not imply that food budget decreases with increase in income, but rather that the proportion of income devoted to food increases at a slower rate than increase in income. Informed by this theory, this study employed household expenditure data to put forward a case for Mandera County in Kenya in estimating the extent of food insecurity. Until recently many studies have used linear functions of budget shares based on working-Lesser specification (Deaton 1980, Mwenjeri, 2009), however studies using linear relationships in budget share specifications are being done especially in non-food items (Hausman et al, 1995, Lewbel, 1991).
Skoufias (2003) have suggested that non-linearity characteristic of the income elasticity on calories intake is important in understanding the relationship in a household.
The study was also guided by the classical test theory of measurement which states that an observed variable is composed of a true value and an error value (Kane, 2010). That is, an individual observed variable is modeled as composed of the true value of the unit of measurement and a measurement error. This is an important characteristic to the study of Engel curves which is subject to problems of measurement errors, given that measuring household income/expenditure is difficult and is subject to errors. Errors in variables induce non-zero correlation between the contaminated regressors and the equation disturbances, so that OLS estimates are biased and inconsistent (Fuller, 1987). In the present study measurement errors are due to non-sampling errors in the measurement of household food acquisition that arise especially during the data collection. These include inability of respondents recalling their food acquisition over the survey period and telescoping bias i.e respondent include events that occurred outside the recall period, thus inflating estimates of the household food acquisition. The discrepancy due to storage and wastage resulting from the time of acquiring food to consumption is also as source of measurement error.
3.3. Instrumental Variable in General Method of Moments (IV-GMM)
Application of the demand theory of the household can be specified as follows; qi = ƒn (x,p)……….3.1
I = 1, 2 ….n
Where qi is the quantity demanded, p is the price; x is total household expenditure (income). Suppose the true model underlying the data analysis is the working-lesser equation of the form:
wih = ai + bi ln xh + uih ………3.2
where the share of the food item (wih) is linear function of the log of the total household expenditure per adult equivalent (xh)
According to classical test theory, the observed variable X in the above model is composed of a true value and a measurement error. That is:
x= x* + v (measurement error)………….………..3.3 Where X is observed variable; X*- true measurement; v - measurement error The framework used in the in the study is the Engel curve estimation, which is: xh = ƒn (yh)………...3.4
where Xh is monthly expenditure of food by the household hth, yh denotes monthly total household expenditure.
From equation 3.4 let yh* and xh* represent the correct total consumption expenditure and expenditure on food items respectively for household h=1……., H.
Likewise, let yh and xh be the measured values of yh* and xh* respectively. Therefore the measurement error in xh, denoted as vh can be given as;
In log terms yields to
ln vh = ln xh – lnxh* ………...3.6
Likewise according to Lewbel, (1996) if the total expenditure (Independent variable) is measured with error food expenditure share (dependent variable) is also measured with error; Therefore, the correct and measured food expenditure is
Wh* = xh*/yh*……….……….………3.7
The observed food expenditure,
Wh = xh/yh……….………...3.8
Consequently, the measurement error in the observed food expenditure is given by,
ωh = wh – wh* ………..………...3.9
Applying budget shares that are higher than first degree polynomial, equation 3.2 is replaced by the following quadratic food share model
Wh* = β0+ β1ln xh* +β2 (ln xh*) 2 + µh………..………3.10 µh error term of mean zero,
This according to Hausman et al (1995), who suggest that for some goods equation 3.10 (quadratic), is adequate specification than equation 3.2(linear).
Combining equation 3.10 with equations 3.6 and 3.9 leads to the estimating model as follows
Wh =β0 +β1 lnxh+β2 (ln xh) 2 + εh……….………...3.11
The compound error term εh is therefore expressed as
εh =ωh + µh –β1 ln vh +β2 (ln vh) 2 - 2β2 (ln vh ln xh)………...3.12
Assumption: E(µh) =E(ωh) = E(vh) = 0
both at dependent and independent variables of equation 3.11, since as measured food expenditure yh is part of total expenditure xh (Lewbel, 1996). Using Lewbel (1996) the study adopted a two step approach to arrive at consistent estimators for the demand model. Step one involved multiplying equation 3.11 by mis-measured regressor (xh) and then employed GMM estimation technique to obtain consistent estimates of the transformed model. The second step involved developing the relationship of the structural and the reduced model to recover consistent estimates of the former. This strategy was accomplished as follows:
Equation 3.11was multiplied by xh and using the household income, income squared and the interaction terms between income and log of income as instrumental variables, denoted as zh, results in the following moment conditions equation; to be estimated using GMM technique.
zh xhwh* = a0 E( zh xh)+ b1E(zh xh ln xh) +c2 E(zhxh ln xh)2 + vh...3.13 The following set of assumptions as identified by Lewbel (1996) provided the basis for the identification;
(i) E(x׀z) ≠ 0
(ii) E(εi׀z) = 0
(iii) E(vi) = 0
Assumptions (i) and (ii) ensure the validity of the instruments and (iii) implies that measurement errors are independent of total expenditure.
This means taking the conditional expectation with respect to z there is;
zh xhwh* = a0 E( zh xh)+ b1E(zh xh log xh) +c2 E(zhxh log xh)2 + ρ3E(xhηz)...3.14
instruments z in the following specification;
Log x = g(z) + η……….3.15
According to Battistin et al (2012), a GMM regression of equation 3.14, would consistently estimate the quadratic coefficient β2 (equation 3.11) being the coefficient of x
log x2. The linear curve of the above equation can be estimated by the following equation Battistin et al (2012),
zh xhwh* = a0 E( zh xh)+ b1E(zh xh log xh) + ρ3E(xhηz) ………..3.16
According to Battistin and Nadai (2012), instrumenting for endogeneity without adjusting for the non-linearities, introduced by measurement error will result to inconsistent parameters of interest as follows;
E[wi׀z] = α0 + bi0E[log x׀z]……….………3.17
The GMM regression of wi on log x using z instruments will result to biased estimate of b1 (equation 3.16). Therefore the parameters of the transformed model (3.13); a, b and c were estimated through GMM and the parameters of the Engel curve, equation 3.11 recovered by making the following relationships (Battistin et al, 2012).
β0 = a +b E (vh log vh) + c {[vh (logvh) 2]- 2E[vlogc]2} + ρicov(v, logv)…....3.18 β1 = b + 2cE [vhlog vh]……….…3.19 β2 = c………..……….…3.20
To estimate E (vh log vh) and E [vh (log vh) 2 moments the study adopted the following equations as suggested by Battistin et al (2012). Under log normality assumption and the fact that E [V] = 1 the following expression was used;
E(VlogV) = σ2v/2……….3.21
Assuming that v is log normally distributed, the ratio of 3.16 and 3.17 a method of moments estimate for the variance of log v(σ2v) is obtained through
σ2v = log (βi0/βi1)………..……….3.23
The values were then substituted back into the equations 3.18 and 3.19 for estimating a and b respectively. To estimate the magnitude of the bias the study exploited the following equation;
1 + var[V] = eσ2v ……….…3.24
Employing the argument of Battistin et al (2012), the magnitude of bias is approximately proportional to the variance of the measurement error. Therefore assuming the log normality of v, the variance of the measurement error was estimated as follows;
1 - eσ2v = var[v]……….….3.25
To evaluate the effect of measurement error the study examined the rate at which the rise in total household expenditure leads to a decrease in the budget share of food using the elasticity estimates for both OLS and GMM. The elasticity estimates were calculated as follows;
Β1 + 2β2X ………...3.26
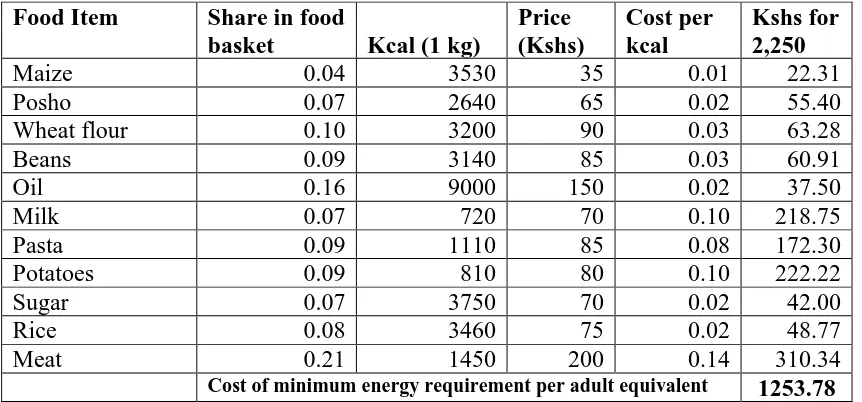
3.4. The Cost of Basic Needs Method
requisite prices The method is based on minimum nutritional requirement or threshold. An individual is considered food poor if the nutritional consumption is less than determined threshold. The cost of basic method was calculated based on the following steps.
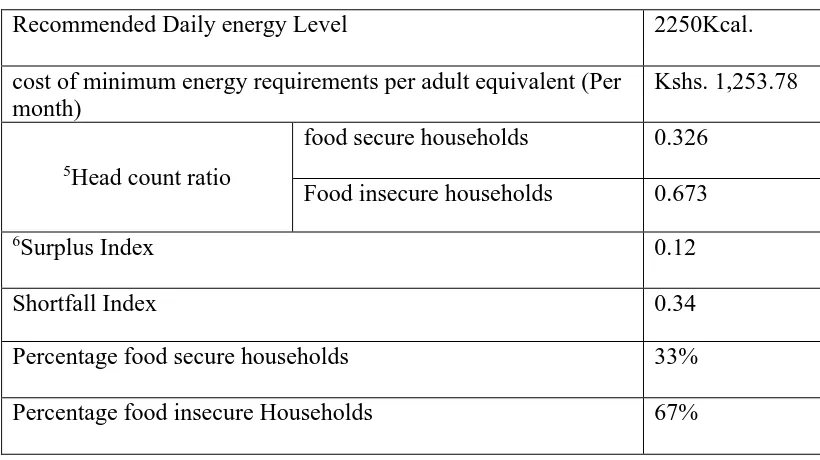
To begin with calorie requirement was defined based on the minimum intake of 2250 kilocalories, recommended by the FAO, which is also adopted by the Kenyan government (GoK, 2006). Secondly, a food bundle was determined using a diet that reflects the eating habits of Mandera households. Lastly, the cost of meeting the calorie requirement using that food bundle was estimated. The cost of buying the food bundle is the food poverty line, which is used to determine the proportion of the population that is food insecure.
3.4.1. Surplus/Shortfall Index The Index is given as:
Where
P = Surplus/Shortfall Index;
L = Recommended daily per capita requirements (2250Kcal.); Gj = Calorie deficiency faced by householdj;
Xj = Per capita food consumption available to householdj;
The tool was used to measure the extent to which a household is food secure or insecure. The households’ food security was defined based on the minimum intake of
2250 kilocalories, recommended by the FAO, which is also adopted by the Kenyan government (GoK, 2006). The nutrient composition of commonly eaten foods in Kenya was used to estimate the calorie intake of households using the National Public Health Laboratory Services (1993) report.
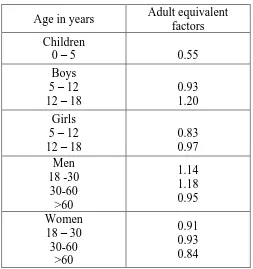
3.4.2. Adult-Equivalent Conversion Factors
To determine the adult-equivalent reference scale, the study estimated the mean calorie requirements for men and women from 0 to above 60 years of age, resulting from a reference value of 2,250 kilo calories. The fractions are presented in the table below. Table 3.1: Adult-Equivalent Conversion Factors
Age in years Adult equivalent
factors Children
0 – 5 0.55
Boys 5 – 12 12 – 18
0.93 1.20 Girls
5 – 12 12 – 18
0.83 0.97 Men 18 -30 30-60 >60 1.14 1.18 0.95 Women
18 – 30 30-60
>60
0.91 0.93 0.84
Source: Estimates by the author data 2012
between the calorie requirements (according to age and gender) and the estimated adult reference value (2,250kcal). The accessible daily energy for the households was estimated and adequacy of energy to meet the dietary needs of household members determined. The food quantities consumed by the household were identified (per individual food item) and converted to kilocalories by applying conversion tables (National Public Health Laboratory Services (1993) report). The kilocalories for all food items available to the household were summed-up and analyzed to obtain energy intake per household. This was achieved by dividing total calories for the household per day by the adult equivalent persons eating from the household. The extent of household food insecurity in the County was measured by estimating the surplus/shortfall index from the cost-of-calorie formula. The surplus index and shortfall index indicating the degree to which a household is food secure and insecure respectively.
3.5. Food Insecurity Depth Analysis
where Z = is the cut-off level of household expenditure per adult equivalent used to categorize a household as food secure or not, q is the number of households below the food security line, N is the total number of households in the sample, Yi is the food expenditure of household i, and P is the degree to which a household is food insecure (food insecurity gap short fall index).
3.6 Data Collection
3.6.1 Sampling Design and Sample Size Determination
Sampling was constructed based on the 2008 integrated households’ budget survey report. The target population being all households in the Mandera County, random sampling methodology was employed proportionately to select a study sample based on fisher’s formula (Fisher et al, 1998) as follows:
where nf is the desired sample when the population is less than 10,000; n is the sample when the total population is more than 10,000; and N is the estimated population of the households in Mandera county (40,599). In Fisher’s formula, n was determined as follows:
n = [1.962 x 0.70 x 0.30] = 323 0.052
The ratio of the households in each district to the total households in the county was used to define the sample sizes in all administrative districts as follows; Mandera west 73, Mandera Central 102 and Mandera east 148
3.6.2 Data Collection Methods
The study employed questionnaires, interviews and review of secondary data as the main tools of data collection. The selection of the tools was guided by the nature of data and the objectives of the study. The study employed personal interviews in which the household members were required to recall quantities acquired and/or expenditures made over a seven day recall period. Data on different foods consumed by the households was obtained to guide the analysis. Data on household’s income including sources and
amounts based on various household activities was collected.
3.6.3 Data Types and Sources
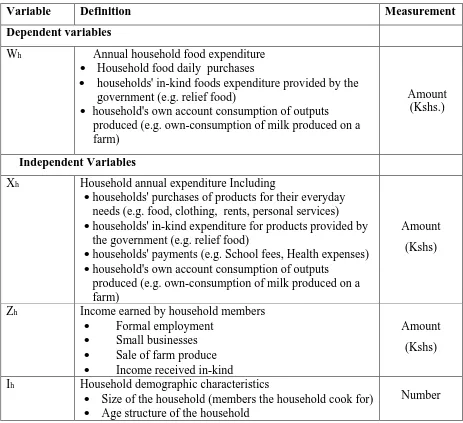
The study used both primary and secondary data. The primary data collected include household total expenditure both food and non-food expenditure, household income and household demographic characteristics as shown in table 3.2. Secondary data including background information on population and households’ budget profiles.
Table 3.2: Data Design
Variable Definition Measurement
Dependent variables
Wh Annual household food expenditure
Household food daily purchases
households' in-kind foods expenditure provided by the government (e.g. relief food)
household's own account consumption of outputs produced (e.g. own-consumption of milk produced on a farm)
Amount (Kshs.)
Independent Variables
Xh Household annual expenditure Including
households' purchases of products for their everyday needs (e.g. food, clothing, rents, personal services)
households' in-kind expenditure for products provided by the government (e.g. relief food)
households' payments (e.g. School fees, Health expenses)
household's own account consumption of outputs produced (e.g. own-consumption of milk produced on a farm)
Amount (Kshs)
Zh Income earned by household members
Formal employment
Small businesses
Sale of farm produce
Income received in-kind
Amount (Kshs)
Ih Household demographic characteristics
Size of the household (members the household cook for)
Age structure of the household
3.7 Data Analysis
The present study, undertakes an in-depth analysis to determine the magnitude of food insecurity in Mandera County highlighting the consequences of neglecting measurement error in household expenditure data. The study employed both quantitative and qualitative data analysis techniques.
Qualitative tools were used in the study to provide a necessary and detailed descriptive characterization of variables that affect food insecurity in Mandera County based on the selected sample. This analysis presents potential relationships that exist between food insecurity situation and household characteristics. Measures of central tendency were explicitly used in this study.
The cost of basic needs (CBN) was used to provide preliminary analysis of food insecurity situation including the magnitude and the extent of food insecurity of Mandera households. In addition, the method is normally used by the government in estimating the wellbeing of the Kenyan citizens and therefore provides a comparative basis for assessing measurement error.
To study the effect of measurement error the quadratic Engel curve equation 3.11 was analyzed using Ordinary Least squares (OLS) and instrumental variable approach of general method of moments (GMM).
(GMM) as proposed by Lewbel (1996) and Battistin and Nadai (2012). This involved two- step approach; first by transforming the structural model into a reduced form and secondly by developing a relationship between the structural and reduced model to obtain consistent estimators as explained by the Denadai (2005). Data analysis was done using STATA 12 software.
To exemplify the statistical difference of quadratic coefficients resulting from both GMM and OLS estimates, the Hausman test was conducted. The test was to assess the implication of measurement error in the estimation of household food demand. The test of over-identifying restriction was also carried out to assess the validity of the instruments.
To account for consumption levels due to different household compositions,
CHAPTER FOUR: RESULTS AND DISCUSSION 4.0. Introduction
This chapter presents descriptive and inferential statistics in the context of household food insecurity. First descriptive statistics results are presented. The results demonstrate the potential factors that directly or indirectly contribute to households experiencing food insecurity. These include sex of the household head, food sources, income sources, household age structure and household total expenditure. The findings of cost of basic needs method on the extent of food insecurity are presented in section 4.6. Lastly the chapter provides a discussion on the consequences of not accounting for measurement error and concludes with an in depth analysis of policy implication to inaccurate food insecurity measurement.
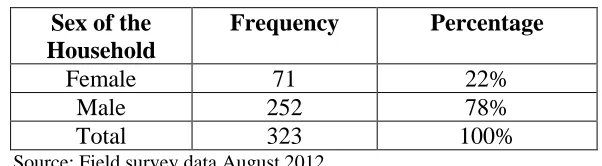
4.1. Sex of the Household Head
The sex of the household head goes hand in hand with decision making process in a household. For instance, it was observed that female headed households are biased towards purchasing certain food items for household consumption (Mwenjeri, 2009). In Mandera County, the distribution of the households with respect to sex of the household head is skewed towards males. About 78% and 22% of the sampled households are headed by male and female respectively (Table 4.1).
Table 4.1: Gender of the Household Head Sex of the
Household
Frequency Percentage
Female 71 22%
Male 252 78%
Total 323 100%
Source: Field survey data August 2012
These results concur with other studies undertaken in sub-Saharan Africa which supports the fact that family constructions are mainly patrilinear (Mwakubo et al., 2004; Akinleye. 2009; Mwenjeri, 2009). These strongly suggest that household decisions in Mandera County are mainly made by men. However, when it comes to food security decisions taken by men, households have been found to experience nutritional inadequacy (Mwenjeri, 2009).
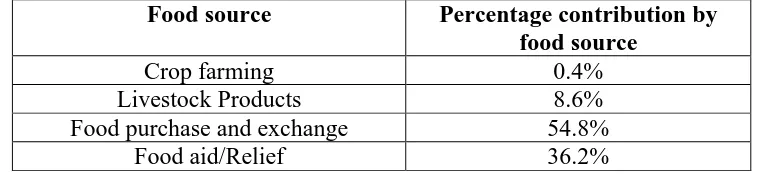
4.2: Major Sources of Food
Despite the importance of livestock to the national economy, pastoralists in Kenya are becoming poorer. A recent livelihood study by NGOs (SCUK, 2007)1 in North-eastern Kenya found a notable increase in poverty levels from 45-50% of the population to 50-60% in the last five years. Pastoralist communities continue to suffer chronic food insecurity in the country experiencing high malnutrition rates that are consistently above international emergency thresholds (AFDB, 2014). The table below (Table 4.2) shows household food sources and percentages of the sampled households in Mandera County.
Table 4.2: Household Food Sources
Food source Percentage contribution by food source
Crop farming 0.4%
Livestock Products 8.6%
Food purchase and exchange 54.8%
Food aid/Relief 36.2%
Source: field survey data August 2012
Table 4.2 shows that majority of households in Mandera County rely mainly on markets for their food requirements. This poses a clear challenge to the achievement of food security considering that Mandera County is classified as poor with a poverty index of 72% (GoK, 2007). This is not surprising considering that Mandera is characterized by very low and unreliable rainfall and comprising of rangeland type of climate that mainly supports pastoralism as the main economic activity. The region has been affected by recurrent droughts, which has in return led to a drastic and continuous decrease of economic assets, and an ever growing number of households that are dependent on external assistance (GOK, 2001). Following candid focus group discussions in the county it emerged that, normal market operations are frequently disrupted by insecurity mainly ignited across the border with Somalia and Ethiopia, ethnic conflicts, out migration of livestock and high transport costs which affects the inflow and outflow of food commodities. This explains the rationale of food aid contributing a substantial percentage of food sources for the households.
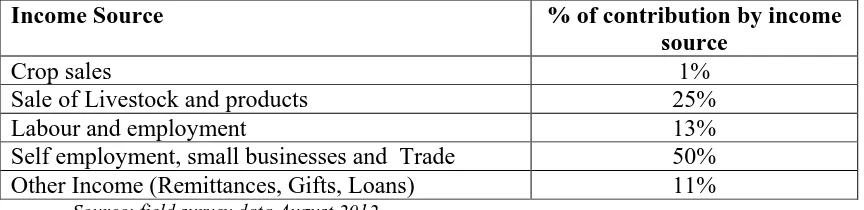
4.3: Major Household Income Sources
Table 4.3 presents the sources of cash income for the households in Mandera County. From the table it is observed that self employment contributes half of the income for the households followed by sale of livestock and livestock products.
Table 4.3: Household Income Sources
Income Source % of contribution by income
source
Crop sales 1%
Sale of Livestock and products 25%
Labour and employment 13%
Self employment, small businesses and Trade 50%
Other Income (Remittances, Gifts, Loans) 11%
Source: field survey data August 2012
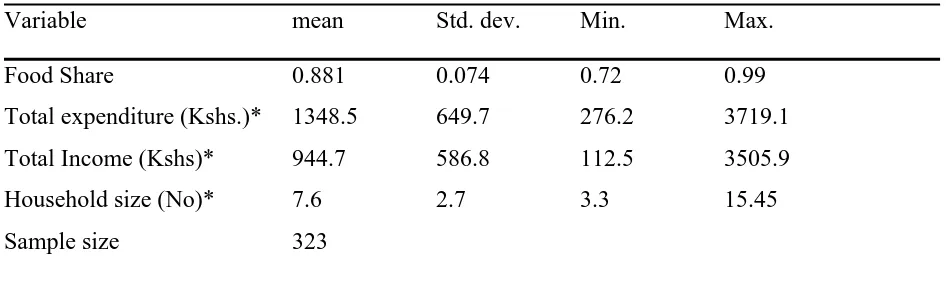
4.4 Food Budget for Households in Mandera County
Table 4.4 provides statistical summary of the household variables that were used in the study. On average the study shows that food share accounts for approximately 88% of the total household expenditure.
Table 4.4: Food Expenditure for households in Mandera County
Variable mean Std. dev. Min. Max.
Food Share 0.881 0.074 0.72 0.99
Total expenditure (Kshs.)* 1348.5 649.7 276.2 3719.1
Total Income (Kshs)* 944.7 586.8 112.5 3505.9
Household size (No)* 7.6 2.7 3.3 15.45
Sample size 323
Source: Field Survey data 2012; * Adult equivalent values
The household expenditure on food is observed at 88.1% this is comparable to GoK (2007) report that puts it at 80%. However, this level of food expenditure is high compared to the national average of 51.1%. In comparison to national statistics2, Mandera County differs in a number of ways. This can be attributed to a number of factors; high on the list is the high poverty levels. According to government reports, Mandera County is categorized as poor with a poverty index of 72% (GoK, 2007). This is consistent with the Engel’s law that low income households’ expenditure on food is
proportionally higher in the total household expenditure (Thompson and Metz, 1998). Secondly, Mandera County relies heavily on markets and food aid as the major food source which stands at 54.8% and 36.2% respectively. At national level, 53.9% of food
consumed in rural areas comes from purchases (GoK, 2007). Moreover, the situation has been compounded by inefficient markets mainly due to poor road infrastructure, insecurity disruptions and food aid dependency (SCUK, 2007). This has made the prices of various food commodities to increase. Thirdly, the sample also shows a higher household size averaging about 8.9 as compared to the national of 5.1 as per GoK report of 2007 (GoK, 2007). Besides, the county experiences a high dependency ratio, about 53% of the population aged between 0-14, compared to the national average of about 43% (GoK, 2007).
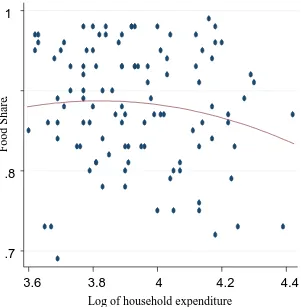
4.5: Relationship between Food Budget and Household Expenditure - Non Parametric Analysis
By way of varying the analysis, the study employed non-parametric regression analysis to enhance data description. Non parametric regression analysis is important since it permits the data to take a ‘local’ shape of the conditional mean relationship.
suffering from a negative income shock.
Figure 4.1: Relationship between food budget and household expenditure- Non- Parametric Analysis
This preliminary analysis supports the rationale of this study in employing quadratic analysis to estimate the relationship between household food expenditure and the total expenditure for Mandera households. Similar results were observed by Girma and Kedir (2002), in their study in Ethiopia thus signifying the importance of employing quadratic relationship in this study. In addition, the quadratic term3 in the regression results is significant which indicates an improvement of the model. Against the backdrop of low-income households incapable of meeting their nutritional requirements and
3 From table 4.7 the quadratic term β2 =-- 0.0713 (-2.18) is significant.
.7 .8 . 9 1
Food Share
3.6 3.8 4 4.2 4.4
spending almost all of their additional income on food, Hassan (2012) suggests that the food Engel curve is quadratic in developing countries.
Quadratic functional form provides analysis that is consistent with the observed consumer behavior, in which case the expenditure of food does not rise proportionately with household income. The food budget share increases at low income levels and declines at higher income levels (Nicholson et al, 2008). This characteristic allows food
to be classified as luxuries at low income levels and necessities at higher income levels. This is significant for policy formulation since it makes it possible to understand the economic levels at which poor households experience food insecurity thus necessitating the requisite interventions.
4.6: Food Insecurity Levels for Mandera Households
Food insecurity in a household can be analyzed from two dimensions namely: a problem of acquisition and a problem of utilization. The aspect of acquisition is based on the economic status of the household. Mandera County is categorized as one of the poorest in Kenya. With a poverty index of about 72%, the households in the county face an acute economic challenge of food acquisition.
Tables 4.5 and 4.6 presents the cost of minimum energy requirement and the extent of food insecurity estimates for Mandera County respectively. The cost of minimum energy requirement was calculated by analyzing the household food expenditure using Cost-of-basic needs (CBN) method proposed by Ravallion (1994, 1998).