A Comparative Study for Outlier Detection
Techniques in Data Mining
Zuriana Abu Bakar, Rosmayati Mohemad, Akbar Ahmad
Department of Computer Science Faculty of Science and Technology University College of Science and Technology
21030 Kuala Terengganu, Malaysia {zuriana, rosmayati}@kustem.edu.my,
Mustafa Mat Deris, Member IEEE
Faculty of Information Technology and Multimedia College University Technology Tun Hussein Onn
86400 Parit Raja, Batu Pahat Johor, Malaysia [email protected]
Abstract— Existing studies in data mining mostly focus on finding patterns in large datasets and further using it for organizational decision making. However, finding such exceptions and outliers has not yet received as much attention in the data mining field as some other topics have, such as association rules, classification and clustering. Thus, this paper describes the performance of control chart, linear regression, and Manhattan distance techniques for outlier detection in data mining. Experimental studies show that outlier detection technique using control chart is better than the technique modeled from linear regression because the number of outlier data detected by control chart is smaller than linear regression. Further, experimental studies shows that Manhattan distance technique outperformed compared with the other techniques when the threshold values increased.
Keywords—data mining, clustering, outlier
I. INTRODUCTION
Data mining is a process of extracting valid, previously unknown, and ultimately comprehensible information from large datasets and using it for organizational decision making [1]. However, there a lot of problems exist in mining data in large datasets such as data redundancy, the value of attributes is not specific, data is not complete and outlier [2].
An outlier is defined as data point which is very different from the rest of the data based on some measure. Such a point often contains useful information on abnormal behavior of the system described by data [3]. On the other hand, many data mining algorithms in the literature find outliers as a side-product of clustering algorithms. From the viewpoint of a clustering algorithm, outliers are objects not located in clusters of dataset, usually called noise [2].
Outlier detection problem is one of the very interesting problems arising recently in the data mining research. Recently, a few studies have been conducted on outlier detection for large datasets [3]. Many data mining algorithms try to minimize the influence of outliers or eliminate them all together. However, this could result in the loss of important hidden information since one person’s noise could be another person’s signal [4]. In other words, the outliers themselves may be of particular
interest, such as in the case of fraud detection, where outliers may indicate fraudulent activity [5]. Outlier detection or outlier mining is the process of identifying outliers in a set of data. The outlier detection technique finds applications in credit card fraud, network robustness analysis, network intrusion detection, financial applications and marketing [3]. Thus, outlier detection and analysis is an interesting and important data mining task.
This paper discussed about control chart, linear regression and Manhattan distance techniques for outlier data detection from data mining perspective. The main inherent idea is to compare those techniques to determine which technique is better based on the number of outlier data detected and threshold values. There are many types of data in outlier detection analysis such as binary variables, nominal and ordinal. However, in this outlier detection analysis, only numerical data will be considered.
The rest of this paper is organized as follows. Section 2 discuss related work on outlier data detection techniques. The framework and formulas (equations) for control chart, linear regression, and Manhattan distance techniques are presented in Section 3 and extensive performance evaluation is reported in section 4. Section 5 concludes with a summary of those outlier data detection techniques.
II. RELATEDWORK
Recently, a few studies have been conducted on outlier data detection for large datasets. Distribution based methods was previously conducted by the statistics community. In these techniques, the data points are modeled using a stochastic distribution, and points are determined to be outliers depending upon their relationship with this model. However, with increasing dimensionality, it becomes increasingly difficult and inaccurate to estimate the multidimensional distributions of the data points [6].
cluster algorithm to partition a dataset into several groups. Pruning and batch processing on these groups could improve efficiency for outlier detection [7]. On the other hand, Deviation-based outlier detection does not use statistical tests or distance-based measures to identify exceptional objects. Instead, it identifies outliers by examining the main charateristics of objects in a group. Objects that “deviate” from this description are considered outliers. Hence, in this approach the term deviations is typically used to refer to outliers [5].
Whilst, density based was proposed by Breunig et al. [2]. It relies on the local outlier factor (LOF) of each point, which depends on the local density of its neighborhood. Clustering-based outlier detection techniques regarded small clusters as outliers [8] or identified outliers by removing clusters from the original dataset [1].
Meanwhile Dangtong Yu et al. [1] proposed a new method which apply signal-processing techniques to solve important problems in data mining. They introduced a novel deviation (or outlier) detection approach, termed FindOut, based on wavelet transform. The main idea in FindOut is to remove the clusters from the original data and then identify the outliers. Although previous research showed that such techniques may not be effective because of the nature of the clustering, FindOut can successfully identify outliers from large datasets. Experimental results showed that the proposed approach is efficient and effective on very large datasets [1].
In addition, Aggarwal and Yu [3] introduced a new technique for outlier detection which is especially suited to very high dimensional data sets. The method works by finding lower dimensional projections which are locally sparse, and cannot be discovered easily by brute force techniques because of the number of combinations of possibilities. This technique for outlier detection has advantages over simple distance based outliers which cannot overcome the effects of the dimensionality curse. They illustrated how to implement the technique effectively for high dimensional applications by using an evolutionary search technique. This implementation works almost as well as a brute-force implementation over the search space in terms of finding projections with very negative sparsity coefficients, but at a much lower cost. The techniques discussed in this paper extend the applicability of outlier detection techniques to high dimensional problems; such cases are most valuable from the perspective of data mining applications [3].
While as Williams et. al [9], proposed replicator neural networks (RNNs)for outlier detection. They compared RNN for outlier detection with three other methods using both publicly available statistical datasets (generally small) and data mining datasets (generally much larger and generally real data). The RNN method performed satisfactorily for both small and large datasets. It was of interest that it performed well on the small datasets since neural network methods often have difficulty with such smaller datasets. Its performance appears to degrade with datasets containing radial outliers and so it is not recommended for this type of dataset. RNN performed the best overall on the KDD intrusion dataset [9]
Thus, from the several studies discussed above, we found that research in outlier detection can lead to the discovery of
truly unexpected knowledge in areas such as electronic commerce exceptions, bankruptcy and credit card fraud. Such knowledge can lead to new directions for future investment, marketing, and other purposes.
III. RESEARCH METHODOLOGY
Outlier detection approach can be categorized into three approaches which there are the statistical approach, the distance-based approach and the deviation-based approach. In this outlier analysis, we examine statistical approach because this approach is appropriate for one-dimensional samples. Therefore, this approach is applicable since this analysis is based on one-dimensional data. This analysis applied control chart and linear regression techniques for statistical approach. Besides that, we also examine distance-based approach in order to counter the main limitations imposed by statistical approach [9]. The Manhattan distance technique was applied for distance-based approach.
A. Statistical Approach
The statistical approach to outlier detection assumes a distribution or probability model for the given data set and then identifies outliers with respect to the model using a discordancy test [5]. In particular, an analysis for statistical approach is based on the five phases:
1) Data collection: This analysis is based on our
observation of the air pollution data taken in Kuala Lumpur on the August 2002. A set of air pollution data items consists of five major aspects that can cause the air pollution, i.e. {Carbon Monoxide (CO), Ozone (O3), Particulate Matter (PM 10), Nitrogen Dioxide(NO2 )and Sulfur Dioxide (SO2)}. The value of each item is with the unit of part per million (ppm) except PM10 iswith the unit of micro-grams (µgm). The data were taken for every one-hour every day. We present the actual data as the average amount of each data item per day.
2) Compute average value/Compute Linear Regression
equation: At this phase, average value was computed in order to gain the centre line for the control chart technique. Otherwise, linear regression equation also calculated to determine linear regression line.
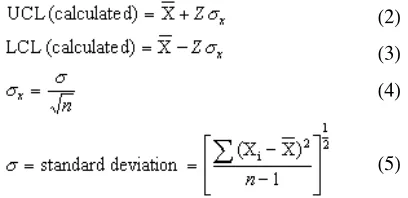
3) Compute upper and lower control limits/Compute
upper and lower bound value: Upper control limit (UCL) and
lower control limit (LCL) for control graph technique are based on the particular formula (refer equation (2) to (5) at B section). While as, upper and lower bound for linear regression technique is based on 95 percent from linear regression equation (line).
4) Data Testing: At this phase, actual data, centre line,
UCL and LCL are plotted on the control graph while as actual data, linear regression line, upper and lower bound are plotted linear regression graph. Outlier data could be identified from those graphs. Data that are plotted out from upper and lower control limits/bound are detected as outlier data.
5) Analysis and comparison the output: The output from
best technique in detecting outlier data based on statistical approach.
B. Control Chart Technique (CCT)
In this section, we study control chart technique for outlier data detection. Usually, CCT is used to determine whether your process is operating in statistical control. The purpose of a control chart is to detect any unwanted changes in the process. These changes will be signaled by abnormal (outlier) points on the graph [10]. Basically, control chart consists of three basic components:
1) a centre line, usually the mathematical average of all
the samples plotted.
2) upper and lower control limits that define the
constraints of common cause variations. 3) performance data plotted over time.
Firstly, calculate the average for data points to get a centerline of a control chart. The formula is,
where,
X
= mean/average valueXi = every data value (Xi … Xn) n = total number of data
Secondly, calculate the upper control (UCL) and lower control limit (LCL) by using formula below,
In a 3-sigma system, Z is equal to 3. The reason that 3-sigma control limits balance the risk of error is that, for normally distributed data, data points will fall inside 3-sigma limits 99.7% of the time when a process is in control. This makes the witch hunts infrequent but still makes it likely that unusual causes of variation will be detected [10].
Finally, data are plotted on the chart and data that are out from UCL and LCL and are detected as outlier data. Figure 1 shows an example of control chart that has one data outside UCL. This data is known as outlier data.
Figure 1. An example of control chart
C. Linear Regression Technique (LRT)
There have been many statistical concepts that are basis for data mining techniques such as point estimation, Bayes theorem and regression. Nevertheless, for this outlier detection analysis, LRT is being used because it is appropriate to evaluate the strength of a relationship between two variables.
In general, regression is the problem of estimating a conditional expected value. While as “linear” refers to the assumption of a linear relationship between y (response variable) and x (predictor variable). Thus, in statistics, linear regression is a method of estimating that linear relationship between the input data and the output data [11]. The common formula for a linear relationship used in this model is [5],
x
Y
=
α
+
β
where, the variance of Y is assumed to be constant, and α and β are regression coefficients specifying the Y-intercept and slope of the line, respectively.
Given s samples or data points of the form (x1, y1), (x2, y2)…, (xs, ys), then α and β can be estimated using this method with the following equations,
∑
∑
= =
−
−
−
=
si i
s
i i i
x
x
y
y
x
x
1
2 1
)
(
)
)(
(
β
x
y
β
α
=
−
where,
x
is the average of x1, x2, …, xs, andy
is the average of y1, y2, …, ys. The coefficients α and β often provide good approximations to otherwise complicated regression equations.D. Distance-based Approach
One of the statistical approach drawbacks is it requires knowledge about parameters of the data set, such as the data distribution. However, in many cases, the data distribution may not be known [5]. Therefore, a distance-based approach was introduced to overcome the problem arise from statistical approach. The criterion for outlier detection using this approach is based on two parameters, parameter (p) and distance (d), which may be given in advance using knowledge about the data, or which may be changed during the iterations
(2) (3) (4)
(5) (1)
(6)
(7)
to select the most representative outliers. In particular, an analysis for distance-based approach is based on nine phases below.
1) Data collection: As discussed in section A.
2) Compute the distances of each data (d1): The distance
between data was computed to yield distances of each data.
3) Identify maximum distance value of data (d2): The
maximum distance value was identified to determine a range for threshold distance value (d3).
4) Determine threshold distance value (d3): This value
was determined based on maximum distance value (d2). Threshold distance value (d3) should be smaller than maximum distance value (d2). Otherwise, comparison process could not be done.
5) Compare between d3 and d1 (p): At this phase,
parameter value (p) could be determine by comparing between d3 and d1 where p equal to d1 >= d3.
6) Determine threshold value (t): Threshold value (t) has to be assigned to indicates the research space.
7) Compare between t and p: At this phase, threshold
value will compare with the result at phase five.
8) Data testing: At this phase outlier data could be
identified.
9) Analysis and comparison the output: The output from
data testing will be used in order to compare and analysis this techniques.
E. Manhattan Distance Technique (MDT)
Commonly, the distances can be based on a single dimension or multiple dimensions. It is up to the researcher to select the right method for his/her specific application. For this outlier detection analysis MDT is used because the data are single dimension. The general formula for MDT is,
=
∑
=−
k
h ih jh
j
i
t
t
t
t
d
(
,
)
1|
(
)
|
where: ti = <ti1,…,tik> and tj = <tj1,…,tjk> are tuples in a
database.
IV. PERFORMANCE EVALUATION
In this section, firstly, we compared the efficiency of the linear regression and control chart techniques (statistical approach). The implementation of both algorithms is using Matlab 6.5 and Microsoft Access as its database. Through the performance evaluation, we are going to show that the control chart technique is better than linear regression due to the number of outlier data detection is smaller than linear regression technique.
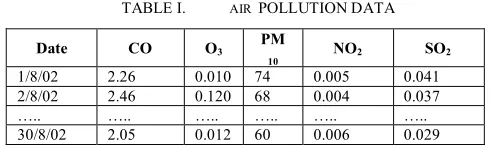
As mention in 3.3, this outlier analysis is based on air pollution data. The example of air pollution data is shows in Table I:
TABLE I. AIR POLLUTIONDATA
Date CO O3 PM
10 NO2 SO2
1/8/02 2.26 0.010 74 0.005 0.041
2/8/02 2.46 0.120 68 0.004 0.037
….. ….. ….. ….. ….. …..
30/8/02 2.05 0.012 60 0.006 0.029
Based on both techniques, outlier data was determined if the data was out of the control limits or boundaries. In control chart technique, UCL and LCL were determined based on the formulas (equations) discussed in section A. While as, upper and lower boundaries in linear regression techniques are based on 95 percent computation from liner regression equation that has been identified.
TABLE II. THERESULTFORCCTANDLRT
Data Outlier data
for CCT Outlier data for LRT
CO 16 25
O3 18 30
PM10 20 25
SO2 21 29
NO2 16 21
Figure 2. Graph for outlier data detection using CCT and LRT
As illustrated in Table II and Figure 2, outlier data that have been detected by control chart were lower than linear regression technique. This implies that, the lower the number of outlier data detected, the better the technique is. This is due to data plotted on control chart technique are more converged on the data average line. Thus, there are more useful data that could be used for analysis and further could acquire an accurate result.
Secondly, we analysis the MDT (distance-based approach). The implementation of this algorithm also using Matlab 6.5 and Microsoft Access as its database. In Manhattan distance technique, the threshold values (tv) have to be assigned. Besides that, outlier data also depends on the threshold distance values (d3). The d3 have to be smaller than maximum distance values (d2) that exist between each of the data. This is to ensure that d3 did not out of range and the comparison process could be done. We can get the parameter value (p) by comparing d3 and the distances of each data (d1). Further, we compare t with
Re sult Te sting: Comparison betwe e n Two O utlier De te ctionTe cnique s
0 10 20 30 40
CO PM1
0 NO2
Air Pollution Compone nt
Nu
m
be
r o
f O
ut
li
er
Da
ta Control
Chart T echnique Linear Regression T echnique
p to gain outlier data. From equation (9), we obtained d2, d3, tv and the number of outlier as in Table 3.
TABLE III. THERESULTFORMDT
Data Max. distance
value (d2)
Threshold distance value (d3)
Threshold
value (tv) Number of Outlier
2 15 4 13
CO 1.82 1.0
6 9 2 27 5 17
O3 0.08 0.01
7 11 2 7 3 5
PM10 81 50
4 2 4 21 5 12
SO2 0.07 0.003
6 11 6 12 7 7
NO2 0.028 0.010
8 5
Result Testing: Manhattan Disance Technique
0 5 10 15 20 25 30
Threshold
Nu
m
b
er
o
f O
u
tl
ie
r
CO O3 PM10 SO2 NO2
Figure 3. Graph for outlier data detection using MDT
Table III and Figure 3 show that when the threshold values increases, the number of outlier data detected decreased. This implies that, numbers of outliers are inversed with threshold value. This is due to the space of the useful data in the cluster becomes bigger.
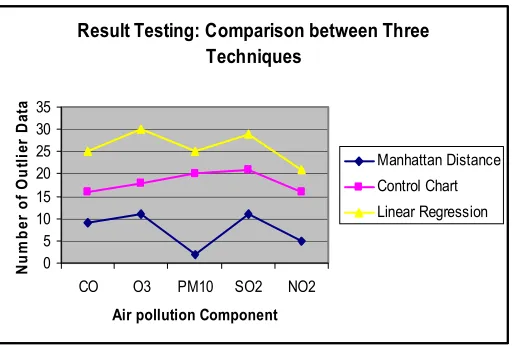
TABLE IV. THECOMPARISONRESULTFORTHREETECHNIQUES
Data Outlier data for
MDT
Outlier data for CCT
Outlier data for
LRT CO 9 16 25 O3 11 18 30
PM10 2 20 25
SO2 11 21 29
NO2 5 16 21
Result Testing: Comparison between Three Techniques
0 5 10 15 20 25 30 35
CO O3 PM10 SO2 NO2
Air pollution Component
Nu
m
b
er
o
f O
u
tl
ie
r
Da
ta
Manhattan Distance Control Chart Linear Regression
Figure 4. Graph for outlier data detection using three techniques
As illustrated in Table IV and Figure 4, outlier data that have been detected by Manhattan distance were lower than control chart and linear regression techniques. This is due the lower number of outlier data detected, the better the technique. This implies that, distance-based approach is more practical and reliable than statistical approach in outlier data detection.
V. CONCLUSON
This paper presented the result of an experimental study of some common outlier detection techniques. Firstly, we compare the two outlier detection techniques in statistical approach, linear regression and control chart techniques. The experimental results indicate that the control chart technique is better than that liner regression technique for outlier data detection. Next, we analyze Manhattan distance technique based on distance-based approach. The experimental studies shows that Manhattan distance technique outperformed the other techniques (distance-based and statistical-based approaches) when the threshold values increased.
REFERENCES
[1] Yu, D., Sheikholeslami, G. and Zang, “A find out: finding outliers in very large datasets”, In Knowledge and Information Systems, 2002, pp. 387 - 412.
[2] Breunig, M.M., Kriegel, H.P., and Ng, R.T., “LOF: Identifying density-based local outliers.”, ACM Conference Proceedings, 2000, pp. 93-104. [3] Aggarwal, C. C., Yu, S. P., “An effective and efficient algorithm for
high-dimensional outlier detection, The VLDB Journal, 2005, vol. 14, pp. 211–221.
[4] Knorr, E.M., Ng, R. T., Tucakov, V., “Distance-based outliers: algorithms and applications”, The VLDB Journal, 2000, vol. 8, pp. 237–253.
[5] Han, J. and Kamber, M., Data Mining Concepts and Techniques, USA: Morgan Kaufmann, 2001.
[6] S. Ramaswamy, R. Rastogi, and S. Kyuseok, “Efficient algorithms for mining outliers from large data sets”. In Proc. of the ACM SIGMOD International Conference on Management of Data, 2000, pp. 93-104. [7] Aggarwal, C. C., Yu, S. P., “Outlier detection for high dimensional
data”, SIGMOD’01, 2001, pp. 37-46.
[9] G.Williams, R. Baxter, H. He, S. Hawkins, L. Gu, “A comparative study of RNN for outlier detection in data mining”. Proceedings of the 2nd IEEE International Conference on Data Mining (ICDM02) Maebashi City, Japan, 2002, pp. 709-712.
[10] SkyMark: Control Chart, at
http://www.skymark.com/resources/tools/control_charts.asp
(accessed: 13 December 2005) [11] Wikipedia: Linear Regression, at