The Micro-unit Forage Inventory
Method1
M. C. SHOOP AND E. H. McILVAIN
Research Range Conservationist and Research Agrono- mist, Crops Research Division, Agricultural Research Service, U. S. Department of Agriculture, U. S. Southern Great Plains Field Station, Woodward, Oklahoma
Of all the measurements used in range research and range ad- ministration, none has been SO difficult and expensive to ob- tain and none so sorely needed for correct decision-making as weight of forage per acre. This paper describes a refined weight- estimate method used to deter- mine forage production and dis- appearance in pounds per acre on the Southern Plains Experi- mental Range near Woodward, Okla. The method was developed, tested, and modified from 1948 to 1952. Since then, it has been the primary tool for evaluating forage response in all phases of range research at Woodward.
In itself, the micro-unit forage inventory method offers only a
few new techniques and prin-
ciples. Primarily the method re- combines and modifies sampling
techniques proposed and used
by others, especially those of
Pechanec and Pickford (1937).
The recombination created a
simple, rapid, precise, low-cost method to determine the elusive
“pounds of each species per
acre.”
Description of Method
The micro-unit method uses
the objective principle of count- ing, or taking inventory of, esti- mated micro-units of range for- age by species within micro-plots. Definitions used in this article are: (1) micro-unit, an arbitrary small quantity of forage, usually
10 grams (field weight), (2)
micro-plot, a small quadrat 1.917 -
1 Cooperative investigation of the Crops Research Division, Agricul- tural Research Service, U. S. De- partment of Agriculture, and the Oklahoma Agricultural Experiment Station, Stillwater, Oklahoma.
square feet in area, and (3) for- age, current-year growth of grass and forbs above juncture of stem and root. In brief, an examiner delimits a micro-plot and counts the number of whole and frac- tional micro-units of each spe- cies.
Essence of the method is that the micro-unit to be estimated is
physically present within an
arm’s length, it can be seen and touched, and its weight can be checked by clipping and weigh- ing to the nearest gram within about 30 seconds. The time re- quired by a single examiner to delimit, estimate, and record one plot is usually 30 to 60 seconds. The only ability that must be developed is that of estimating a small weight unit of each spe- cies, and great accuracy can be developed rapidly by most will- ing technicians.
The remainder of this descrip- tion is concerned with the simple but exacting details that will permit technicians to use the method without redeveloping re- liable detailed procedures.
The Micro-unit and Estimate The micro-unit is estimated by a visual appraisal combined with the sense of touch. Factors to be taken into account when esti- mating a micro-unit include: (1) length, width, and thickness of leaves and stems; (2) inherent specific gravity of different spe- cies and phenotypes; (3) ratio of leaves to stems; (4) moisture content as reflected by turgidity, shape, and color; (5) presence of growth from previous years; and (6) degree and type of grazing by insects, rodents, wildlife, and livestock.
172
mate, among other character- istics, the compressed basal di-
ameter, compressed crown
diameter, and compressed leaf
length measurements shown to
be highly correlated with weight by Hickey (1961). But man’s eye, hand, and mind can determine and take into account numerous factors which relate to weight that cannot be readily measured. Furthermore, the examiner con- cerns himself only with the mi- cro-unit, not the entire plant. Stated another way, an experi- enced estimator carries in his mind and constantly uses numer- ous “regression formulas” of the effect of many plant character- istics on weight.
The learning process includes estimating, clipping, weighing, modifying the estimate, and re- weighing until the estimator be:
comes experienced and expert
with weights of range forage. On the sagebrush range type at
Woodward, a man who knows
the vegetation, but who has no
previous weight-estimating ex-
perience, can usually become
proficient with two days of in-
tensive practice. A man with
previous experience can usually regain his micro-unit concepts in half a day.
Micro-unit estimates are of ac- tual field weights which are con- verted later to air-dry or oven- dry values. During the training period, representative clippings of each major species are placed in moisture-tight plastic bags for
determination of percent dry
matter. If the survey lasts sev-
eral weeks, moisture samples
must be taken whenever a sig- nificant change occurs in plant moisture, usually at one- or two- week intervals.
Ssmbol Item Grams/Dlot
0
Micro-unit (10 grams), orfraction of unit ---
111 II*
~,,I,\' - Blue grama
*r--\
\.,./
Little bluestem: c--
\ 21-d
IJ
Side-oats gramaTotal
FIGURE 1. Method of counting tihole
ber of micro-units (Figures 1
40
16
3 ---
59
and fractional micro-units within a micro-plot.
and
2). Micro-plot totals can be
checked by clipping. Training efficiency can be gained by hav- ing the men estimate each other’s quadrats. If additional practice
is needed, the examiners can
work in pairs for the first few hours of the actual survey.
Size, shape, and delineation of plot are important factors which contribute to final accuracy of any survey method (Christidis,
1931; Pechanec and Stewart,
1940; Green et al., 1952; Brown, 1954). However, Jolly (in Brown,, 1954) stated, “Fortunately, size of unit is often much less critical than the experimenter imagines, and quite a large alteration in size of unit will sometimes pro- duce only a small effect on the final accuracy of his results (as- suming the total amount of sam-
pled material to remain con-
stant) .” Jolly also stated that for a given sampling method, more accurate results are usually ob- tained from a large number of small plots than from a small number of large ones.
After much field study at
Woodward, it became apparent
that small plots which could be delineated rapidly, and with all portions close to the observer’s eye and hand, were absolutely essential for accuracy and speed. A dominant consideration affect- ing this decision was the mental
fatigue associated with pro-
longed periods of estimating and counting micro-units in larger plots.
A rectangle with length about twice the width was selected as the best compromise on shape because (1) it could be delimited quickly and accurately, (2) it
retained some advantage of a
circle which has the least border- effect bias of all shapes, and (3) it had some linearity which in- creased sampling efficiency. In addition, the plot size was calcu- lated so that a constant of 50 could be multiplied by grams per plot to give pounds per acre.
Final measurements of the
quadrat were 11.5 by 24.0 inches. The quadrat was constructed of 1/d-inch milled steel rod, and all
measurements were made from
rod centers (Figure 3). Quadrats larger than those used at Wood-
ward may be desirable where
vegetation is sparse and smaller quadrats may be more efficient where vegetation is dense.
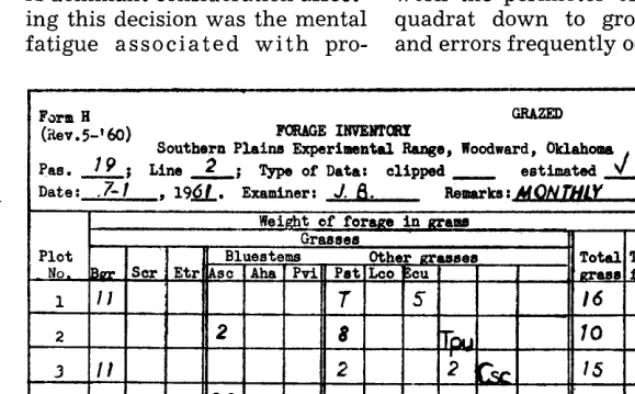
One end of the quadrat was left open and the resultant points were sharpened so they could be pushed through the basal por- tions of plants at ground line. Time and effort are required to work the perimeter of a closed quadrat down to ground line, and errors frequently occur. The
Fmn H
(iiev.5-‘60) FORAGEINVEliTORY
Southern Plains Experiassntal Range, Woodward, Oklahoma Pas. 19 ; Line 2 ; Type of Data: clipped eetimated 4 Date: -7-1 , 194t. Examiner: J. 8. harks:~ChV~~-
2
3 It 2 21Gjg: 15 T
4 38 T T 39
25 14 4 21
Total
1
open end of the quadrat is “closed” with a pencil, or short
rod, which is again pushed
through the basal portion of the
plants. Frequently, no plants
are located across the open end and no marker is needed.
Maintenance of Reliability
Concept of micro-units is
maintained during the survey by clipping about every tenth plot or by clipping micro-units from that plot. If vegetation on the plot to be clipped is sparse (three to five grams) the ex- aminer clips the next plot hav- ing more forage. If a quadrat falls on an area of extremely dense forage (80 to 200 grams) it is usually more accurate to clip the plot than to estimate it. The reason for this is explained later
under the subheading “Nature
of Variation Associated with Es- timates.”
Several reasons exist for the estimator to continually check his micro-unit concept by clip- ping rather than to use a double- sampling technique (Wilm et al., 1944). These include: (1) the time factor as shown under the sub- heading “ Tim e Comparisons”; (2) the need of having another
examiner clip and weigh the
plot, or the need of the examiner
carrying unweighed sacks of
clipped forage with him (to pre- vent introducing subconscious bias from the learning process); and (3) the necessity under sev- eral varied conditions of clipping sufficient plots to calculate valid correction constants. Then too, if a break of time were to occur during the inventory, the prob-
lem of obtaining sufficient
clipped samples to calculate cor- rection constants would be in- tensif ied.
Measuring Production and Disappearance
Forage production in pounds per acre can be measured on un- grazed areas with the micro- unit forage inventory method at any selected time by using an
appropriate area-sampling sys-
tem. Micro-plots can be com- pletely randomized, randomized in clusters, or mechanized along randomized stratum lines. All human bias must be eliminated when delimiting each micro-plot.
In a grazed pasture, weight of forage is measured under cages
to determine production. This
is usually done at end of sum- mer. An equal number of micro- plots is then measured in the
grazed portion of the pasture,
and the difference between
“grazed” and “ungrazed” yields is summerlong disappearance.
Winter-for age disappearance due to livestock grazing is ob- tained by caging the summer “grazed” micro-plots during the winter and re-inventorying them in the spring for comparison with an inventory of micro-plots
grazed during winter. Total
winter disappearance, grazing plus attrition, is obtained by comparing yield of micro-plots grazed during winter with end-
of-summer “ungrazed” yields.
Monthly production and dis-
appearance data are obtained by taking “grazed” and “ungrazed” measurements at monthly inter-
vals. After the “ungrazed”
micro-plot is inventoried, on
May 31 for example, a “May- grazed” micro-plot is located, in- ventoried, and then caged with
the cage from the “May-un-
grazed” micro-plot. The “May- grazed” micro-plot becomes the
“June-ungrazed” micro-plot
when it is inventoried on
June 30. Monthly production on the plot is obtained by subtrac- tion of the first-of-the-month
measurement from the end-of-
the-month measurement.
Precision and time are gained by leaving the micro-plot quad- rat in place under the cage from one reading to the next. Hall
(1959) showed that sampling
error of growth measurements in forests was reduced 25 per-
cent by remeasuring plots as
compared with subtracting re-
sults of successive inventories on different plots.
Equipment
FIGURE 4. Typical sand sagebrush range. Examiner is recording grams of a species within a micro-plot.
was purchased from the Ox-
wall Tool Co., Ltd., 133-10 32nd Avenue, Flushing 54, N. Y., at a cost of about $7.20.2 Inventory
equipment needed includes:
quadrat, shears, scale, field
forms, clipboard, kraft sacks and rubber bands for weighing for- age, pencils, plastic sacks, cages, and anchoring pins.
Testing the Method
The micro-unit method was
compared with clipping in three trials conducted on the Southern Plains Experimental Range. The experimental range is located on rolling, stabilized, sand dunes, and the predominant soil type is Pratt loamy fine sand. Annual precipitation averages 23 inches, but varies from ten to 43 inches. Native vegetation of the area is dominated by an overstory of sand sagebrush (Artemisia fili- folia Torr.) , with an average canopy cover of 38 percent. The understory of grasses and forbs
aMention of specific instrument and manufacturer is for identification and does not imply any endorse- ment by the U. S. Department of Agriculture.
produces an annual average of 1,050 pounds of oven-dry forage per acre. Average forage produc- tion consists of 20 percent sand
dropseed (Sporobolus cryptan-
drus (Torr.) A. Gray) ; ten per- cent sand lovegrass (Eragrostis trichodes (Nutt.) Wood) ; six percent blue grama (Bouteloua grucilis (H.B.K.) Lag. ex Steud.) ; 16 percent little blue-
stem (Andropogon scopurius
Michx.) , sand bluestem (A. hullii Hack.), and switchgrass (Pun- icum virgutum L.) ; 31 percent other grasses; and 17 percent forbs (Figure 4).
General procedure in the trials was to inventory a series of micro-plots by the micro-unit
method. Afterwards, the plots
were clipped. The quadrat
frames were pinned in place to
prevent movement. Examiners
were range technicians well ac- quainted with the vegetation and the micro-unit method. Order of
examining the plots was ar-
ranged so that each man made an equal number of first, second, and third inspections of each plot to equalize “examiner disturb- ance.”
Trial 1 was conducted in early winter on a one-acre area which was predominately blue grama.
Three examiners estimated the
forage weight of individual
species in 75 micro-plots, and then the vegetation was clipped and weighed in two categories,
blue grama and “all other
species.” Each examiner esti-
mated and clipped a non-test
plot located at every tenth
micro-plot to maintain his micro- unit concepts. A time record was kept of all operations.
Trial 2 was conducted in late summer on micro-plots located along a stratum line in a native
pasture. Vegetation varied
greatly since the stratum line
crossed numerous vegetative
sites. Two examiners estimated the forage on 25 plots on two successive days to measure the repeatability of the method.
Both the estimates and clips
were by individual species. Ex- aminers maintained reliability of micro-units by checking esti- mates outside the plots.
A third trial was conducted and the data were included in the averages of all trials. For the sake of conciseness, specific results from trial 3 were not re- ported because they were similar to those of trials 1 and 2. Addi-
tional data were obtained by
calculation of statistics from pas-
ture inventories made by the
micro-unit method.
All data were subjected to
t2s2tL2, where t is at five per-
cent level for infinite degrees of
freedom, s is standard deviation,
and L is allowable error (here,
ten percent of the mean).
Results
Estimated Versus Clipped Weights
Forage weights estimated by
the micro-unit method closely
approached the average weights
obtained by clipping. Estimated
average weights
varied with
each examiner from two to 13
percent less than the clip in
trial 1 and from nine percent
more to nine percent less than
the clip in trial 2 (Table 1). In
ten comparisons,
estimated
weights averaged eight percent
less than clipped weights. Two
reasons for these conservative-
type estimates are breakage of
mature foliage associated with
repeated “examiner disturbance”
and the tendency of examiners
to underestimate highiproducing
plots, as discussed in more de-
tail under the subheading “Na-
ture of Variation Associated with
Estimates.”
Estimated weights on individ-
ual micro-plots were highly cor-
related with clipped
weights.
Correlation coefficient of esti-
mated weights with clipped
weights averaged 0.87 in the ten
comparisons and ranged from
0.74 to 0.96.
Differences Between Examiners and Days
Differences between estimates
of the same plot by individual
examiners were relatively small.
Eight comparisons of estimates
showed an average difference
between men of only seven per-
cent with a range of one to 15
percent. Average correlation be-
tween estimates of examiners
was 0.86, and the range was from
0.81 to 0.92.
Repeat estimates of plots by
examiners on successive days
showed technicians were highly
consistent in their ability to es-
timate forage weights. Second-
day estimates were about 100
pounds per acre, or two grams
per plot, lower than first day es-
timates (Table 1). Repeat esti-
mates were expected
to be
slightly lower than first-day es-
timates since handling mature
vegetation to estimate its weight
by the sense of touch as well as
sight causes slight breakage and
loss. However, first- and second-
day estimates were highly cor-
related, 0.91, in three compari-
sons.
Time Comparisons
The micro-unit method was
approximately four times as fast
as the clip method in trial 1.
Average time required to esti-
mate the forage in a micro-plot
was 34 seconds when travel time
between plots spaced 15 feet
apart was included. An average
of 59 seconds per micro-plot was
required when one plot in ten
was checked by clipping.
Four minutes and ten seconds
was required to clip and weigh
the forage in a micro-plot and to
travel to the next plot. Clipping
and weighing each individual
species would have increased the
time requirement.
In grazed pastures, about two
minutes were required to esti-
mate a micro-plot. Much of this
time was used to move cages and
to travel between plots. Inven-
tory time was also influenced by
number of species, degree of spe-
cies intermixture,
quantity of
forage present, and number of
micro-plots read per cage.
Number of Plots Required
Number of plots required to
sample within ten percent of the
mean was calculated from actual
forage inventory data of two dif-
ferent pastures at Woodward,
one relatively uniform and one
highly variable. In a high-rain-
fall year, 1961, a valid estimate
of yield on a 25-acre seeded blue
grama pasture required 28 mi-
cro-plots. In the same year on
25 acres of sand sage rangeland,
a valid estimate required 193
plots. In a year of low forage
production, 1956, 36 and 73 plots
were required to sample the blue
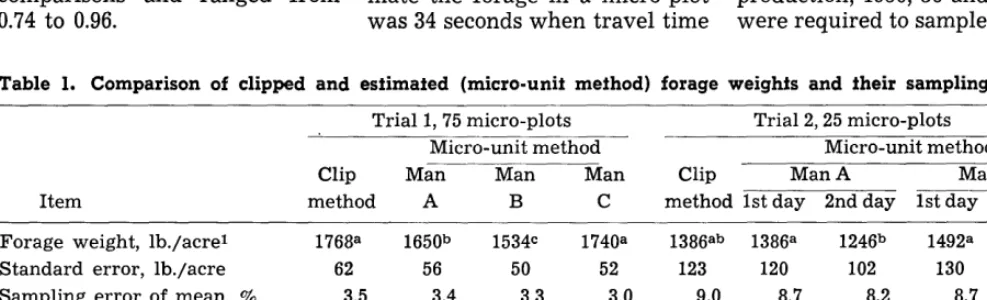
Table 1. Comparison of clipped and estimated (micro-unit method) forage weights and their sampling statistics
Trial 1, 75 micro-plots Trial 2,25 micro-plots A
Micro-unit method Micro-unit method Clip Man Man Man Clip Man A Man B Item method A B C method 1st day 2ndday 1st day 2ndday Forage weight, lb./acre1 1768= 1650b 1534c 1740= 1386ab 1386= 1246b 1492= 1382= Standard error, lb./acre 62 56 50 52 123 120 102 130 108 Sampling error of mean, % 3.5 3.4 3.3 3.0 9.0 8.7 8.2 8.7 7.8 Coeff. of variation, % 31 29 28 26 45 43 41 44 39 Plots needed (n) 36 33 30 26 77 72 65 73 58 Difference from clip, % --._ -7 -13 -2 .___ 1 -9 9 1 Correlation coeff.2 ___. .86 .74 .81 ____ .87 -88 .96 .87
1 Field weight. Comparable means with different letters are significantly different at the five percent level by the Duncan multiple range test.
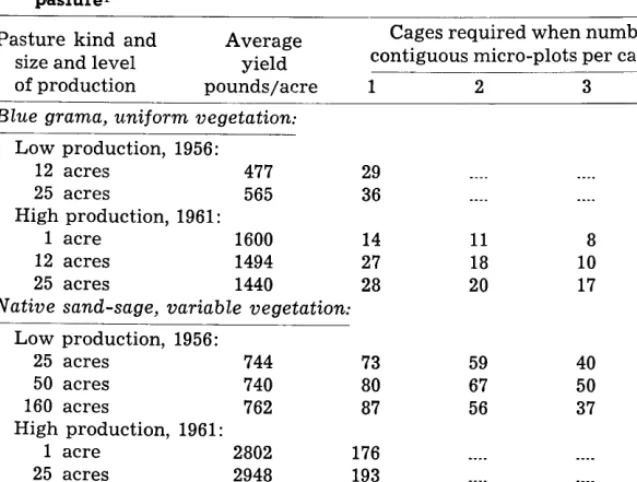
Table 2. Number of cages (n) required for a valid estimate of fofal perennial grass yield in relation fo number of contiguous micro-plots under a cage, fo uniformity of vegetation, to level of production. and fo size of pasture1
Pasture kind and Average Cages required when number of size and level yield contiguous micro-plots per cage is2 of production pounds/acre 1 2 3 4
Blue grama, wtiform vegetation:
Low production, 1956:
12 acres 477 29 .__. . . . . . . . . 25 acres 565 36 .._. . . . . .._. High production, 1961:
1 acre 1600 14 11 8 . . . . 12 acres 1494 27 18 10 . . . . 25 acres 1440 28 20 17 . . . . Native sand-sage, variable vegetation:
Low production, 1956:
25 acres 744 73 59 40 34 50 acres 740 80 67 50 38 160 acres 762 87 56 37 38 High production, 1961:
1 acre 2802 176 . . . . . . . . . . . . 25 acres 2948 193 . . . . . . . . . . . . 50 acres 2658 247 . . . . . . . . . . . . 160 acres 2844 233 140 123 95 IValid in this instance implies a 95 percent probability of being within 10 percent of the population mean. Yields are field weights measured in fall. 2Adjacent plots 1.917 square feet in size were combined to alter size of sample plot. Estimation of individual plots larger than 1.917 square feet is extremely tiring and soon becomes inaccurate.
grama pasture and the native range, respectively (Table 2).
Number of plots required for a valid estimate of yield was not directly proportioned to size of pasture or area. For instance, a valid estimate of yield in 1961 on a one-acre area of the seeded blue grama pasture required 14 plots; a la-acre area of the same pasture required 27 plots; and the entire 2%acre pasture re- quired 28 plots (Table 2) . Kling- man et al. (1943) also found that nearly as many plots were re- quired on small as on large areas. Number of plots required to sample production of an indi- vidual native range species with- in ten percent of its mean was
many times that required to
sample total forage. In a native pasture in which 240 quadrats were sufficient to sample total forage within ten percent of the mean, the number required to sample sand dropseed was 769, sand lovegrass 2,104, and blue
grama 7,606. Other investigators also found that large numbers of plots were required to secure low sampling errors for individ- ual species (Harris, 1951; Pech- anec and Stewart, 1941).
Cage requirements per pasture
were materially reduced when
more than one micro-plot was
read per cage. Cage numbers
were reduced about 30 percent by reading two plots per cage, about 50 percent by reading three, but only 57 percent by reading four (Table 2) .
Nature of Variation Associated with Estimates
In ten comparisons, estimated yields were eight percent smaller than clipped yields. Also, esti- mated yields varied less than clipped yields. There are at least three reasons for these discrep- ancies.
One reason is examiners tend to cluster yield estimates about the mean (Pechanec and Pick- ford, 1937). In the ten compari-
sons, coefficients of variation were 46 percent for clipped yields and only 41 percent for estimated yields. Clustering lowers the mean because a given percentage error multiplied by low yields influences the mean less than the same percentage error multiplied by high yields.
A second reason is that ex- aminers overestimated low-yield- ing plots by only about eight percent, and they underestimated high-yielding plots by about 16 percent. This discrepancy in ac- curacy of estimates is also shown by a correlation coefficient of 0.70 for estimated and clipped yields of high yielding plots and 0.82 for low-yielding plots (Table 3).
A third and minor source of error in estimating was the ten- dency of examiners to overlook small plants. This tendency be- came greater as size of plot in- creased.
Discussion
The prime consideration of an inventory method is its accuracy,
and the micro-unit method
proved acceptably accurate when compared with clipping in the tests at Woodward. Some other important advantages of the mi- cro-unit method are: estimates are based on a specific observa- tion of each plant, not on a gen- eralized view or concept of the mass; estimates can be rapidly verified by clipping; vegetation can be left in place for re-estima- tion later; growth from previous years can be eliminated; small plots permit economical caging; small plots which can be studied from one position increase speed and accuracy; and the small plots can be delimited rapidly and ac- curately with the open-end quad- rat frames.
tion is usually underestimated slightly; rank , high-producing vegetation cannot be estimated as accurately as sparse vegeta- tion; and highly variable vege- tation requires relatively large numbers of small sampling plots because larger plots cannot be estimated accurately. A minor disadvantage is that individual examiners vary slightly in their ability to estimate. To overcome this, all members of a crew should inventory a proportionate share of each pasture or experi- mental treatment.
a panacea, and it should be tested under local conditions before be- ing used extensively. There is still great need for a forage
measurement technique that is
completely objective and can be
used by inexperienced exam-
iners. Until such a method is de- veloped, the micro-unit method should have a place on many western ranges.
Summary
The reader should be fore- warned about the difference in precision of measuring forage production and forage disappear-
ance. Forage disappearance
when calculated as the differ-
ence between grazed and un-
grazed plots, is never measured as accurately as forage produc- tion, because variance of a dif- ference is greater than the vari-
ance of either parent mean
(Boyd, 1949). This is true
whether yields are obtained with
the micro-unit method or by
clipping. The use of paired plots (Klingman et al., 1943) over- comes much of the disadvantage of the difference method for cal- culating disappearance. One mi- cro-plot is chosen by a mechani- cal or random method and then matched with a similar plot. One of the pair is selected at random as the ungrazed plot and the other becomes the grazed plot.
The micro-unit forage inven- tory method was developed as a simple, rapid, low-cost technique to measure forage production and disappearance on rangeland
at Woodward, Oklahoma. For-
age yields are measured by using the objective principle of count- ing estimated micro-units of each species within micro-plots. A mi- cro-unit is an arbitrary small quantity of forage, usually ten grams, and a micro-plot is a small quadrat 1.917 sq. ft. in area.
The micro-unit method is not
The micro-unit is estimated by a visual appraisal combined with the sense of touch. Factors taken into account include: size of leaf and stem, leaf-stem ratio, mois- ture content, previous-year’s growth, utilization, and pheno-
typic variations. Range tech-
nicians can rapidly develop the necessary estimating ability. The
estimated micro-unit can be
checked quickly, usually within
30 seconds, by clipping and
weighing. The scale used is about the size of a fountain-pen.
Table 3. Difference between and correlafion of clipped and esfimafed (micro-unit method) forage yields in relation fo quantify of forage per micro-plofl
Clipped yields Difference of Correlation Weight class Weight/acre estimate from clip coefficient
(Pounds) (Percent)
Lowest 20 percent 825 8 .82 and-low 20 percent 1190 2 ___. Middle 20 percent 1515 -7 .81 and-high 20 percent 1935 -10 ____ Highest 20 percent 2545 -16 .70
All plots 1602 -8 .87 IYields from 155 micro-plots were grouped by weight class. Data are field
weights measured in the fall.
The rectangular quadrat frame selected to delimit a micro-plot in the sand sagevegetation meas- ured 11.5 by 24.0 inches. One end was left open to facilitate rapid
and accurate placement. The
dominant factor in selecting this small micro-plot was mental fa- tigue caused by estimating and counting micro-units in larger plots.
Forage production and disap- pearance can be obtained with
the micro-unit method on a
monthly, seasonal, or yearly basis. This is done by using a
standard area-sampling tech-
nique and caged and uncaged plots. Cage numbers per pasture
can be materially reduced by
reading more than one micro- plot per cage.
The micro-unit method was
compared with clipping in three trials. Forage weights estimated by the micro-unit method aver-
aged eight percent less than
clipped weights, and varied from 13 percent less to nine percent
more. Estimated and clipped
weights were highly correlated, 0.87. Differences between yield estimates of the same plot by in- dividual examiners were slight, only about seven percent. First- and second-day estimates of mi- cro-plots by the same examiners were highly correlated, 0.91.
Micro-plot yields were esti- mated in 34 seconds, whereas four minutes and ten seconds was required to clip each micro- plot. In grazed pastures, about two minutes was required to es- timate a micro-plot, move the cage, and travel to the next plot.
Number of micro-plots re-
quired for a valid estimate of yield varied directly with uni- formity of vegetation and only indirectly with area. A 12-acre area of seeded blue grama was adequately sampled with 27 plots and a 25-acre area with 28 plots. On 25-acre pastures of highly variable native range, from 73 to 193 plots were required.
tween estimated
and clipped
yields showed
that estimates
were slightly smaller but less
variable than clipped
yields.
Reasons for this were: exam-
iners clustered their estimates
about the mean; they underesti-
mated high-yielding plots 16 per-
cent while they overestimated
low-yielding plots only eight
percent; and they occasionally
overlooked small plants.
Important advantages of the
micro-unit method include: ac-
curate estimation of yields; use
of estimates
which
can be
quickly verified by clipping; and
use of small plots which can be
delimited rapidly, studied inti-
mately from one position, and
caged economically. The main
disadvantage to those not famil-
iar with estimating will be the
initial development of estimating
skill.
The micro-unit method is not
a panacea. Until a forage meas-
urement technique is developed
which is completely
objective
and which can be used by inex-
perienced examiners, the micro-
unit method should have a place
on many western ranges.
LITERATURE CITED BOYD, D. A. 1949. Experiments with
leys and permanent grass. Brit. Grassland Sot. Jour. 4: l-10. BROWN, D. 1954. Methods of survey-
ing and measuring vegetation. Commonwealth Bur. Pastures and Field Crops, Hurley, Berks, Eng- land. Bul. 42: 15-16, 98.
CHRTSTIDIS, B. G. 1931. The im- portance of the shape of plots in field experimentation. Jour. Agr. Sci. 21: 14-37.
GREEN, J. O., H. J. LANGER, AND T. E. WILLIAMS. 1952. Sources and mag- nitudes of experimental errors in grazing trials. Proc. 6th Intern. Grassland Congr. 13’74-1379. HALL, 0. F. 1959. The contribution
of remeasured sample plots to the precision of growth estimates. Jour. Forestry 57: 807-811. HARRIS, R. W. 1951. Use of aerial
photographs and sub-sampling in
range inventories. Jour. Range Mangt. 4: 270-278.
HICKEY, W. C. 1961. Relation of se- lected measurements to weight of crested wheatgrass plants. Jour. Range Mangt. 14: 143-146.
KLINGMAN, D. L., S. R. MILES, AND G. 0. MOTT. 1943. The cage meth- od for determining consumption and yield of pasture herbage. Jour. Am. Sot. Agron. 35: 739-746. PECHANEC, J. F. AND G. D. PICKFORD.
1937. A weight estimate method for the determination of range or pasture production. Jour. Am. Sot. Agron. 29: 894-904.
PECHANEC, J. F. AND G. STEWART. 1940. Sagebrush-grass range sam- pling studies: Size and structure of sampling unit. Jour. Am. Sot. Agron. 32: 669-682.
PECHANEC, J. F. AND G. STEWART. 1941. Sagebrush-grass range sam- pling studies: Variability of native
vegetation and sampling error.
Jour. Am. Sot. Agron. 33: lO57- 1071.
WILM, H. G., D. F. COSTELLO, AND G. E. KLIPPLE. 1944. Estimating
forage yield by the double-sam- pling method. Jour. Am. Sot. Agron. 36: 194-203.
Our Native Range-A
New Horizon in
Soil, Water and Plant Conservation’
E. WILLIAM ANDERSONPast President, The American Society of Range Man-
agement.