3526
The Effect Of Magnetic Field On The
Performance Of Cu/Ni As Low-Temperature
Sensor
Moh. Toifur, Julius Saputra, Azmi Khusnani, Okimustava
Abstract: A performance test on Cu/Ni sensors produced by electrode position has been carried out by electroplating techniques with the help of a magnetic field of 0250 gauss in a direction perpendicular to the electric field. Characterization was carried out by treating the sensor to meas ure the temperature of liquid nitrogen together with the thermocouple type TCA-BTA as a calibrator, from a temperature of 20C -200C. Measurement data are analyzed at the range of voltage, response time, sensitivity, stability, linearity, and loss of hysteresis. The results s how that all sensors can show their behavior as low-temperature sensors. For the application purposes of measurements of food storage temperature, body organ storage, and storage of cow sperm, sensors deposited with the help of a magnetic field of 150 gauss were chosen with superiority in high sensi tivity, voltage-temperature linear relationship, and minimum hysteresis.
Index Terms: Hysteresis loss, Low-temperature, Magnetic field, Performance of Cu/Ni sensor, Sensitivity, Stability, Time response, Stability, Voltage range.
—————————— ——————————
1.
INTRODUCTION
THE Cu/Ni and Cu/Ni/Cu/Ni thin layers have been applied as magnetic heads, magnetic memory [1], micro electromechanical systems (MEMS) [2], and for nanomold electrical circuits on electronic chips. This is because Cu is a good conductor of electricity and heat transfer so that in the electronics industry it is widely used as a connector between electronic components. Copper (Cu) also has the potential as a temperature sensor [3,4], but without being combined with other materials or layers, it is still insensitive, considering that Cu resistivity is still low at 1.7 cm [5]. Its sensitivity becomes increased when combined with Ni which has a resistivity of 7.3 cm so that CuNi alloys or Cu/Ni thin layers are formed [6]. Cu/Ni thin film can be used as a temperature sensor, especially low-temperature sensors less than -150C or cryogenic temperatures. If this can be realized then it can answer the needs of low-temperature sensors for several purposes including animal husbandry to measure the temperature of cow cement storage for breeding by Artificial Insemination, in food fields used to measure cryogenic food preservative medium, or the field of modern medicine to measure organ preservative medium for years for transplantation. Everything is a facility that requires a medium with low-temperature. There are several techniques for making Cu/Ni thin films including sputtering, vacuum evaporation and electroplating. Researchers in a series of previous studies have succeeded in making Cu/Ni thin films as low-temperature sensor materials produced by using the electroplating method. Samples were made at various electrolyte bath temperatures and various deposition times. The temperature of the electrolyte bath used (30-60) C and the deposition time was
varied from (1 2.5) minutes. The output of this study has been published in the Journal of Physics [6], Indonesian Journal of Materials and Energy [7], and Quantum Proceedings [8]. The results showed that from the microscopic point of view, with XRD analysis, all Ni deposits in all samples had formed crystals. From the sensor performance test, all samples have shown a linear relationship between the sensor output voltage to the medium temperature with the equation V = 0.0010 T + 0.7222. Cu/Ni sensors made at 50C electrolyte temperature within 1 minute showed the highest sensitivity that is 1.25 mV/C. The sensitivity of the sensor can still be increased by reducing the size of the crystal size and increasing the level of ordering the crystalline structure. Sensor if it has a homogeneous crystal size and regular crystal arrangement of sensitivity becomes higher. Therefore in this study, a thin layer of Cu/Ni will be made which has a homogeneous crystalline size as well as a regular crystal arrangement. A relatively new technique for obtaining this is electroplating together with the use of magnetic fields. The magnetic field plays a very important role because it is associated with an increase in nickel ion mass transport [9], [10], increased deposit quality, increased corrosion resistance [11], [3], and increased deposit hardness. The phenomenon of mass transport from the theoretical review is also very interesting because it is related to magnetohydrodynamic (MHD), magnetoelectrolytic, and reaction kinetics.
The occurrence of magnetohydrodynamics due to the interaction between moving particles and magnetic fields. The result is an increase in convection in the electrolyte bath so that the mass transfer of depositors increases, the reaction kinetics also increases so that the quality of the deposit becomes better. From the magnetoelectrolytic point of view, the use of magnetic fields greatly influences the formation of diffusion layers at the cathode [12], [9], [13]. Sundararaj has also examined the strength of the influence of this magnetic field on the direction of the cathode-anode pair and the gravitational field on the morphology of deposit [14]. Shannon do Ni plating and find that the greater the magnetic field B deposit Ni field the finer, and vice versa if B is parallel to the electric field E, the deposit becomes increasingly rough [15]. In addition, the use of a magnetic field parallel to the direction of ————————————————
Moh. Toifur is currently active as a researcher in Sentral (Sensor and Transducer Laboratory) Ahmad Dahlan University, Indonesia, PH-+6281215573657. E-mail: [email protected]
Julius Saputra is currently pursuing a masters degree program in Physic Education Ahmad Dahlan University, Indonesia, PH-+6285201010304.
Okimustava is a Lecturer in Phys. Ed. Dept. Ahmad Dahlan University, Indinesia, PH-+6287883966555.E-mail:[email protected]
the electric field can produce a thinner film compared to the film obtained if the magnetic field is installed to form an angle to the electric field. Mohanta and Fahidy carry out the deposition of Cu by varying the currents from 20 to 25.6 Am-2
and varying the magnetic fields from 0 to 0.685 T. From this study, the relationship between the increase in current due to the influence of magnetic fields by following the equation
0 1 1
L L m
i i a B , where iL0 current without B. Due to the use of
this B, the thickness of the film is also increasing. As a consequence, the relationship between the magnetic field and the thickness of the film is obtained, which is expressed by
2
2 0
m B a d
d where d0 is the thickness of film without using
field B. The use of magnetic fields also influences the morphology and direction of crystallization of the deposit. The use of a magnetic field makes the morphology of deposit more uniform and having the crystalline structure. For small currents, the influence of the magnetic field is more dominant than the influence of the electric field. The direction of the field B to E also affects the size of the crystal. Ganesh has carried out nickel electrodeposition with a field position B in the direction 0 45 to E [16]. The result is that the grain size of the deposit varies from 1725 nm. From SEM analysis, the nickel position is near the domain boundary. On the contrary, Yang finds the use of magnetic fields both parallel and perpendicular to the cathode do not affect the direction of the Fe, Ni, and Co deposits, even macroscopically for the magnetic field perpendicular to the cathode. The surface of deposit becomes rougher and there are protrusions in direction to the magnetic field. For Co deposition, Yu [17] states that for steady-state currents in addition the mass of Co deposits gradually decreases with increasing field B, it is found that Co content is not uniform in the direction of the cathode where Co near the cathode less than elsewhere [15 ]. The presence of paramagnetic cobalt ion concentration gradient influences the magnetic susceptibility gradient so that it can induce the magnetic driving force. The magnetic driving force will inhibit the deposition rate. This is indicated by the decrease in the steady-state current. From a series of studies above, most research was on physical, electrical, mechanical, and optical properties. Synthesis of Cu/Ni films together with magnetic fields and their use as low-temperature sensors are still new research. In addition, the regulation of the magnetic field that is not too large between 0 G and 200 G is expected to reduce the inhibition force of Ni layer formation and be able to produce uniform surface morphology.
2
EXPERIMENT
METHOD
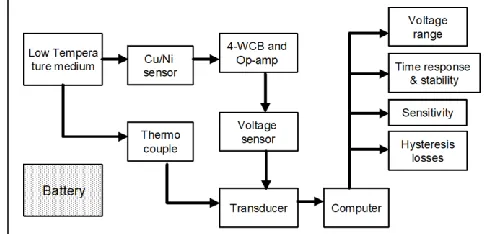
The sample on this research was obtained from plating Cu with Ni by the electroplating method. Specifications of plating conditions are given in table 1. Experiments are carried out according to the procedure as in the schematic of Fig. 1. Liquid nitrogen (LN2) is used as a low-temperature medium,. This medium is placed in a special 5-liter volume flask whose temperature can be varied from 0C to -200C based on the depth of location in the flask. The place close to the flask lid has a higher temperature than the depth one.
LN2 temperature near the lid -20C. In this medium Cu/Ni sensors together with the TCA-BTA thermocouple as a calibrator are slowly inserted into the flask with an average
speed of 1.07 cm/minute. The Cu/Ni sensor output is in the form of a voltage while the thermocouple output is a temperature quantity. The output of both can be observed through a computer screen with the help of a mini LABQUEST transducer and loggerpro software. Display in the form of numbers and graphics. Next, the output is then analyzed on 4 things, these are the range the sensor voltage, response time, sensitivity, stability, and hysteresis loss. The range of the voltage taken from the output voltage when the sensor is used to measure the highest temperature of 20C and the lowest temperature of -200C. Response time is analyzed from the voltage-time curve (V-t). The linearity of curve and responsiveness to temperature changes are chosen as the best sensors. Sensitivity was analyzed from the slope of the voltage - temperature curve (V-T) and curve linearity. Stability is obtained from the relative error of sensitivity, while the hysteresis loss is obtained from the area of the hysteresis loop.
2 RESULT
AND
DISCUSSION
2.1 Voltage-Time Curve
All sensors have shown the performance to be able to measure the temperature of LN2 from 0 to -200C 2. This is better than the TCA-BTA thermocouple which has the ability to
TABLE1
SPECIFICATIONS OF DEPOSITION PARAMETERS IN MAKING CU/NI SENSORSFOR
Cathode : Cu
Anode : Ni
Electrodes distance : 4 cm
Electrolyte bath : H3BO3 (7.5 gr), NiSO4 (75 gr), NiCl2 (10 gr), and H2O (250 ml).
Electrolyte bath temperature
: 60C Current density : 0.07 A/mm2 Deposition time : 3 minute Transvers Magnetic field : 100 – 250 G
3528 measure LN2 minimum up to -185C which appears on the
horizontal line at the bottom end of the thermocouple curve (black curve), while for Cu/Ni sensors it is still able to continue measuring to the lowest temperature of LN2 (blue curve).
Some parameters that can be explored from these images include the voltage range, response time, stability, sensitivity, and hysteresis. Sensitivity is the main quality parameter of the sensor while the others are supporting parameters. The response time is analyzed in two situations, that are when the sensor is used to measure the temperature of LN2 which decreases from 0C -200C and when the LN2 temperature rises from -200C 0C. This is caused by the presence of a difference in the shape of the curve which is not symmetry. Stability is an important parameter related to the consistency of the sensor to appoint a fixed medium temperature if used to measure the same temperature. A stable sensor produces a smooth curve that doesn't contain many ripples. Similarly, when a sensor is used to measure different temperatures the sensor can point precisely and real-time, does not fluctuate and takes more times. The stability level can be seen from the value of the determination index of R2. The smallest valu of R2
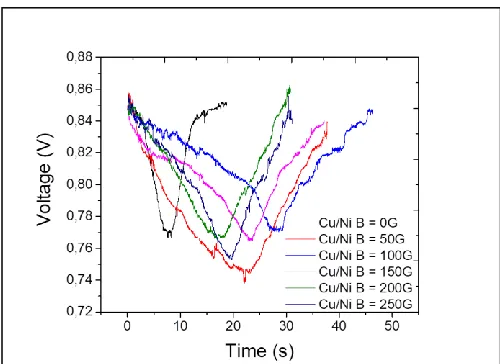
the most stable the sensor. To make it easier to analyze the behavior of all sensors related to the output voltage, a reference voltage of 0.85 volts is made for output voltage at a temperature of 20C. This voltage is the sensor output voltage as the result of deposition in a magnetic field of 50 gauss. Figure 3 displays a graph of the sensor's output voltage when used to measure the temperature of LN2 in the process of decreasing the temperature from 20C -200C and the raising process increased from -200C s 20C. Each of voltage-time curves (V-t) in Fig. 4 shows the different profiles. This indirectly indicates that the magnetic field during deposition influences the V-t curve profile. Several things that can be analyzed from this picture, including the depth of the position of the curve peak which is the minimum turning point that has different values. From the horizontal axis can be identified as the time to reach the peak that also varies. Also from the shape of a curve, some curves are relatively linear when the temperature going down, or when up, or when going down and up, some look curved when the temperature rises, or curves when the temperature drops or curves when the temperature rises and falls. These are parameters that will be
analyzed in the following sections.
2.3 The Voltage Range
Reach the voltage describing the range of output voltage of sensor when used to measure LN2 temperatures ranging from 20C to -200C. The voltage range can determine the accuracy of the sensor.
The greater the range of voltages the more possible to make make a more accurate. The voltage range as shown in Fig. 4 is different for each sample. The difference also occurs in the value of the initial voltage when used to measure LN2 with a temperature of 20C and the final voltage when the temperature is LN2 -200C. The voltage range for sensor resulted from the magnetic field has a range of 0.08 V to 0.12 V while the sensor from deposition without a magnetic field has a range of 0.08 V. Therefore the use of magnetic fields can increase the range of output voltage. The largest range is in accordance with sensors with B = 50 G followed by the sensor with B = 200 G that is 0.10 V. For an expert in instrumentation, especially microcontroller, these voltage data
Fig. 5. Voltage range of sensors.
Fig. 4. output voltage of Cu/Ni sensor resulted from deposition at various magnetic field.
will be converted in temperature to be displayed via LCD as a thermometer. The wider the range of voltages lead to increases the resolution of the equipment so the more accurate the temperature value is indicated.
2.4 Response Time
The use of the external magnetic field when deposition is beeing carried out, in fact, can affect the typology of sensor response time to temperature. The presence of the Lorentz force and electrokinetic force [9] for small fields will influence the formation of the microstructure of the deposit. In deposit that contains a lot of porosity will inhibit electric current compared to fine and homogeneous deposits. Response time is one of the important parameters in determining sensor quality. A good sensor has a short response time. Shorter is better because it tends to go to real-time. From a short observation on the shape of the V-t curve, both curves for the temperature of the medium going down or rising there are two types, namely a straight line and a curve. In accordance with [18], the sensor that has linear V-t behaviour is more preferred than curved (exponential) because the linear sensor has a stable response time for each temperature increment while curve sensors require different times to travel the same temperature interval. From Fig. 4 there are several types of V-t curves when temperatures drop and temperatures rise which are both linear, linear when the temperature drops and curves when the temperature rises, and curves when the temperature drops and is linear when the temperature rises. If the V-t curve is detailed more, it is appears that in the case of decreasing temperature, the curved type has two types, that are the open curve as in the sample with B = 50 G and the closed curve as in the sample with B = 0 G and 250 G. While for the V-t curve when temperature increase, there are two curves which are closed down that is the samples with B = 0 G and B = 150 G. For example, on the drop V-t curve in the 50 G sensor. Near the temperature of 20C it can immediately respond to temperature changes more than at temperatures near -200C. On sensors that have a rising V-t curve whose linear type can respond to steady temperature changes from -200C to 20C. On the sensors with B=100 G, both down and rising have curve shapes. At temperatures close to 20C, it is slow in responding to temperature changes, but when close to -200C it tends to be faster in responding to temperature changes. In contrast to the 200 G sensor both when the temperature drops and the rising shows a linear V-t relationship so that this sensor has the same response time at all temperature changes. Sensor with B = 0 G is the fastest in responding to temperature, but near the temperature of 20C the response slows down. In addition, here we conduct the research on the effect of the deposition field so that samples with B = 0 G are used as a comparison of samples prepared with variation B. The best sensor is a sensor that has a linear V-t curve when the temperature drops and rises because the sensor's output voltage response to temperature changes becomes constant.
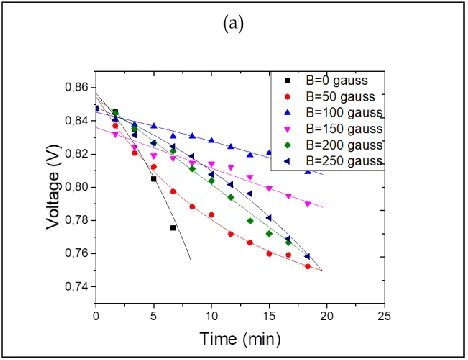
From the five samples, there is only one sample that consistently has a linear V-t curve both when the temperature drops and when the temperature rises, that is, the sample resulting from deposition in the field B = 200 G. The equation of the relation V-t for the temperature of the medium down is
853.56 5.18 (mV)
V t (1)
whereas for the rising medium temperature is
5.85 7.21 (mV)
V t (2)
The time has a strong influence on the output voltage. This is indicated by the level of determination index for the two curves of R2 = 0.99. For other samples, if fitted in a straight line
almost all have R2 = 0.99, except samples with B = 50 G.
Unfortunately for the decreasing temperature, the type is not linear so that when fitted in a straight line it produces R2 =
0.94.
By knowing the types of V-t relationship curves as in Figure 6, it can be determined the time required by the sample to reach temperatures from 20C to the lowest temperature of -200C or vice versa.
(a)
(b)
3530 3 SECTIONS
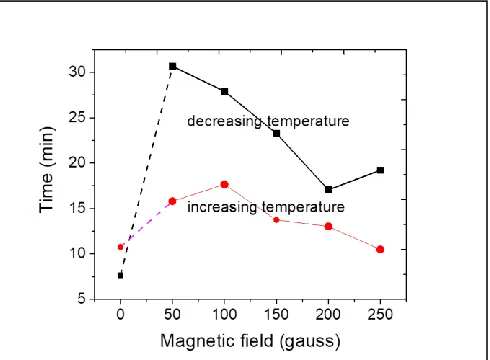
The magnetic field effects on the time needed to reach the minimum temperature in the process of decreasing the medium temperature as well as the time needed to reach the maximum temperature in the process of raising temperature of the medium. The addition of the magnetic field B tends to decrease the time to reach extreme temperatures. Except for samples resulted from deposition at B = 250 gauss, in the process of measuring the medium temperature which decreases, it takes longer than the time required by the deposition sample at B = 200 gauss. According to Yu's research, this is related to the direction of grain growth which tends to be uniform towards one direction and the grain size decreases. In addition, the use of a deposition field will cause a nickel concentration gradient. Near the cathode, the nickel concentration is smaller than the farther away so that the magnetic driving force inhibits the formation of the layer. As a result, the nickel layer decreases so that the sensor becomes less sensitive. This sensor takes longer to measure low-temperatures than sensors prepared with the help of smaller deposition fields [18], [19]. For the medium temperature decrease, the smallest time needed to travel is 7.06 minutes which corresponds to the sample with B = 200 G while the largest travel time is 30.65 minutes which corresponds to the sample with B = 50 G. For the medium temperature increases the smallest time 10,49 minutes corresponds to B = 250 G while the largest travel time is 17.64 minutes corresponding to B = 100 G. When compared with a sample with B = 0 G then it is larger. This means that by using the magnetic field the time needed for the sensor to measure temperatures from 20C to -200C is greater than the Cu/Ni sensor from deposition without using a magnetic field.
2.5 Sensitivity of Sensor
At Fig. 6 displayed the sensitivity of the sensor in detecting
temperature changes from -160C to 0C. The lower temperature limit is taken -160C because it adjusts to the lower limit of the temperature that can be detected by the thermocouple.
Then data were fitted according to order 2 polynomials follows a well-known pattern that RTD-based sensors both in the form of coils and thin layers have curved output curves to temperature [20] according to the equation
2
0
( ) n
n n
V T c T
(3)where V voltage as a function of temperature, and T temperature.
The regression data (Vi, Ti) are shown in Table 3 in the form of
fitting constants c0, c1, and c2. The sensor goodness is
measured from two things, that are sensitivity and linearity. From Table 2 it is known that all sensors have demonstrated their ability as temperature sensors. From the variation of the value c1, shows all sensors have different sensitivity when
used to measure temperature. But in general Cu/Ni sensors produced from magnetic field tend to be more sensitive than Cu/Ni sensors which are made without the help of magnetic fields, except for sensor which is produced from deposition with the help of a magnetic field 50 gauss has a lower sensitivity than sensor deposition results without the help of magnetic fields. The sensitivity of the sensor is between (0.154 ± 0.002) mV/C up to (0.360 ± 0.011) mV/C The highest sensitivity corresponds to the sensor made with the help of a 250 G magnetic field. Unfortunately, this sample is less stable in response to a medium temperature. This is indicated by the value of the determination index R2 = 0.96. This value actually
included in the well criteria, but there is still another sensor that has a larger R2. The next is sample resulted from
deposition at B = 150 G for (0.350 0.006) mV/C.
Fig. 7. The time needed to take the temperature from 20C to -200C and vice versa..
This sensor is stable in response to changes in temperature, which is indicated by the determination index 0.99. Other sensors that produced with the help of 0 G and 150 G magnetic fields have R2 = 0.99, but the sensitivity is less than
0.35 mV/C. When compared with the sensitivity of the sensor made without the help of a magnetic field, that is (0.154 ± 0.002) mV/C this value is the second smallest compared to the sensitivity of the sample resulted from deposition with the help of a magnetic field. Thus the use of magnetic fields during deposition can increase the sensitivity of the sample in response to the temperature of the medium. In addition, from the c2, coefficient it is known that the value of the deposition
sensor on the field of 150 gauss is the most linear compared to the other sensors with the coefficient b2 = (0.5 0.03) 10-4
V/C2. Sensors produced without the help of a deposition field
have the most curved V-T relationship, with a coefficient b2 =
(9.3 0.2) V/C2.
2.6 Hysteresis Loss
To determine hysteresis loss, hysteresis loop area is used, not percent hysteresis because the output voltage signal contains a lot of ripples. If the percent hysteresis formula is used, the distance of the vertical direction curve specified in the middle width of the hysteresis curve (Vmax -Vmin) at T1/2 becomes
invalid. Sometimes at that point, the signal goes up so that the percent hysteresis becomes high, or decreases so that the percent hysteresis becomes low, even though the reality is not the case. The trapezoid formula was used for calculating the hysteresis loop area, as
1
0
1 2 2
n
n i
i h
A V V V
(4)where A is hysteresis area, h is increment of Vi, and Vi is
voltage at T = Ti. Fig. 9 show this hysteresis loop.
All sensors contain hysteresis loss with different losses. The applying magnetic field at deposition affects the hysteresis loss. The smallest hysteresis loop area of 0.92 VC corresponds to the deposition sensor with the help of a magnetic field 150 gauss while the largest hysteresis loss coefficient corresponds to the deposition sensor with the help of 50 gauss magnetic field of 3.71 VC.
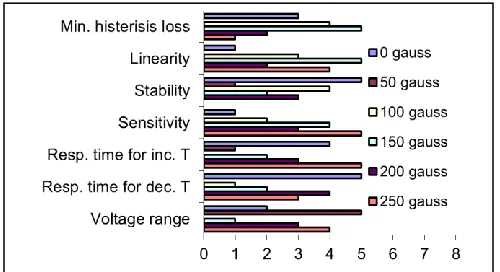
From the results that were studied concerning with the effect of magnetic field on the sensor quality, it can be summarized several items as shown in Fig. 10.
These scores are given to facilitate quantitative analysis in determining the advantage of the sensor. The main thing for sensors is their sensitivity, while others are complementary. Complementary components consist of voltage range, response time, stability, linearity, and hysteresis loss. From the 5 sensors produced from deposition with the help of various magnetic field all have advantages and at the same time have disadvantages. The problem is how to respond to these disadvantages. For example, sensor resulted from deposition on a 250 gauss field has the highest sensitivity, immediately responds to temperature changes, has enough voltage range, and have a linear V-T relationship, but this sensor has an unstable signal and has a large loss of hysteresis. If stability is considered to be a very important parameter, another alternative is the sensor resulting from the deposition in the magnetic field of 150 gauss. This sensor is also sensitive to temperature changes, has a very linear V-T curve, minimum hysteresis loss, but the response time is rather slow, and voltage range is less. For people who are instrumentation experts, the small voltage range can be overcome by multiplying the signal using an op-amp circuit. For a slow time response, it can be considered first for what it will be used. If it TABLE 2
FITTING CONSTANT OF DATA VOLTAGE -TEMPERATURE TO DETERMINE THE SENSOR SENSITIVITY LEVEL
Magnetic field B (gauss)
Coefficient c0 (V)
Coefficient c1 (mV/C)
Coefficient c2 (mV/C2) R2 0 847.42 ± 0.08 0.154 ± 0.002 -0.00093 ± 0.00002 0.99 50 824.28 ± 0.26 0.121 ± 0.008 -0.00177 ± 0.00004 0.99 100 786.56 ± 0.10 0.229 ± 0.003 -0.00058 ± 0.00002 0.99 150 864.13 ± 0.20 0.350 ± 0.006 0.00005 ± 0.00003 0.99 200 834.03 ± 0.17 0.250 ± 0.005 -0.00066 ± 0.00003 0.99 250 824.63 ± 0.38 0.360 ± 0.011 0.00008 ± 0.00006 0.96
Fig. 10. Summary on the sensor quality parameters on various magnetic fields
3532 is to be permanently installed on food preservatives, organ
preservatives, or for storing cow semen, the slow response is not a serious problem.
4 CONCLUSION
The magnetic field from 0 250 gauss influences several sensor quality parameters, namely sensitivity, range of voltage, response time, stability, linearity, and loss of hysteresis. All sensors have perform the ability to measure the low-temperatures. The selection of sensors is in accordance with the use of sensors, but for measuring the temperature of food storage, organ storage, and storage of cow sperm are selected the sensors resulted from magnetic field of 150 gauss with consideration of being sensitive to temperature changes, having a very linear V-T curve, minimum hysteresis loss.
ACKNOWLEDGMENT
The researcher revealed his deepest gratitude to the Ministry of Research, Technology and Higher Education of the Republic of Indonesia which has provided research funding through the 2019 Higher Education Advanced Applied Research (PTUPT) scheme, contract number PTUPT-005/SKPP.TJ/LPPM UAD/III/2019.
REFERENCES
[1] H. Gavrila and V. Ionita, ―Magnetic Materials For Advanced Magnetic Recording Media‖, Journal of Optoelectronics and Advanced Materials, vol. 5, no. 4, pp. 919-932, December 2003
[2] E. Pellicer, A. Varea, S. Pane, B. J. Nelson, E. Mene´ndez, M. Estrader, S. Surin˜ach, M.D.Baro, J. Nogue, and J. Sort, ―Nanocrystalline Electroplated Cu–Ni: Metallic Thin Films with Enhanced Mechanical Properties and Tunable Magnetic Behavior‖, Adv. Funct. Mater, vol. 20, pp. 983– 991, 2010
[3] J.W. Post and A. Bhattacharyya, ―Burn-in and thermal cyclic tests to determine the short-term reliability of a thin film resistance temperature detector‖, Microelectronics Reliability, vol. 52, no.7, pp. 1389-1395, 2012
[4] M. Imran and A. Bhattacharyya, ―Effect of thin film thicknesses and materials on the response of RTDs and micro thermocouples‖ IEEE Sensors Journal, vol. 6, no. 6, pp.1459-1467, 2006
[5] O.S. Agboola, E.R. Sadiku and O.F. Biotidara, ―The Properties And The Effect Of Operating Parameters On Nickel Plating (Review)‖, International Journal of the Physical Sciences vol. 7, no. 3, pp. 349-360, January 2012
[6] J. Fraden 2013. Handbook of Modern Sensors: Physics, Designs, and Applications. New York: Springer
[7] Afsarimanesh, Nasrin and A.P. Zaheer, ―LabVIEW Based Characterization and Optimization of Thermal Sensors‖, International Journal on Smart Sensing and Intelligent Systems, vol. 4 no. 4, pp. 726-739, 2011
[8] M. Toifur, Y. Yuningsih and A. Khusnani, ―Microstructure, Thickness And Sheet Resistivity Of Cu/Ni Thin Film Produced By Electroplating Technique On The Variation Of Electrolyte Temperature‖, IOP Conf. Series: Journal of Physics: Conf. Series 997 (2018) 012053
[9] M. Ebadi, W.J. Basirun and Y. Alias, ―Influence Of Magnetic Field On The Electrodeposition of Ni–Co alloy‖, J. Chem. Sci., vol. 122, vo. 2, , pp. 279–285, March 2010 [10] G.G. Aguilar, G.C. García, J.L.S. Reyes, A.L.M. Almazá,
―Study of the Magnetic Field Effect on the Electrochemical Behavior of a Ni Electrodeposit‖, Int. J. Electrochem. Sci., vol. 12, pp. 928-942, 2017.
[11] J. R. Lopez, G. Stremsdoerfer, G. Trejo, R. Ortega, J.J Pérez, Y. Meas, ―Corrosion Resistance of Nickel Coatings Obtained by Electrodeposition in a Sulfamate Bath in the Presence of Samarium (III)‖, Int. J. Electrochem. Sci., vol. 7, pp. 12244 – 12253, 2012
[12] Fujii, ―Effects of Magnetic-Field on Elemental Process for Microstructural Development of Iron-Based Polycrystalline Materials‖, Disertation, Department of Nanomechanics, Tohoku University, Japan, 2009
[13] T. Liu, D. Li, Q. Wang, K. Wang, Z. Xu and J. He, ―Enhancement of the Kirkendall Effect In Cu-Ni Diffusion Couples Induced By High Magnetic Fields‖, Journal Of Applied Physics 107, 103542 (2010).
[14] A. Sundararaj, M. Bagheri, G. Chandrasekar, T. Yadavalli, H.A. Therese and K. Annamalai, ―Effect of External Magnetic Field on Morphology, Structural and Magnetic Property of Nickel Nanostructures‖, International Journal of ChemTech Research, vol. 7, No.3, pp. 1529-1536, January 2015
[15] M. Hagarova, D. Jakubéczyová, J. Cervová, ―Microstructure and Properties of Electroplated Ni-Co Alloy Coatings‖, Int. J. Electrochem. Sci., vol. 10, pp. 9968-9974, 2015
[16] V. Ganesh, D. Vijayaraghavan, V. Lakshminarayanan, ―Fine Grain Growth Of Nickel Electrodeposit: Effect Of Applied Magnetic Field During Deposition‖, Appl Surf Sci , vol. 240(1-4), pp. 286–295, 2005
[17] Y. Yu, Z. Song, H. Ge1, G. Wei, L. Jiang, „Effects of Magnetic Fields on The Electrodeposition Process of Cobalt‖, Int. J. Electrochem. Sci., vol. 10, pp. 4812-4819, 2015
[18] X. Huang and D. Zhan, ―High sensitive and linear pressure sensor for ultra-low pressure measurement‖, Procedia Engineering, pp. 1202- 1205, Nov. 2014
[19] C. Wang, Y.B. Zhong, J. Wang, Z. Wang, W.L. Ren, Z.S. Lei and Z.M. Ren, ―Effect of magnetic field on electroplating Ni/nano-Al2O3 composite coating‖, Journal of Electroanalytical Chemistry, vol. 630(1-2), pp. 42–48, May 2009