OPTIMIZATION AND PREDICTION OF SURFACE ROUGHNESS ON CNC MILLING MACHINE BY USING ARTIFICIAL NUERAL NETWORK ON D2 STEEL
Er. Alamdeep Cheema*, Er. Rajiv Kumar**, Er. Vijayesh Rathi***
* Post Graduate student in Industrial and Production Engineering at GIMT, Kurukshetra. ** Assistant Professor in Mechanical engineering department at GIMT, Kurukshetra. ***Assistant Professor in Mechanical engineering department at GIMT, Kurukshetra.
ABSTRACT
Process optimization is a very important subject to several industrial sectors in confronting the
growth on markets competition. However, due to the complexity of some processes, their
optimization is not an easy task; therefore, to accomplish this objective, intelligent techniques
should be used. The present paper is an attempt to predict the effective milling parameters on the
final surface roughness of the work-piece made of D2 steel using artificial neural network. The
required data were collected during the experiments conducted on the mentioned material. These
parameters include cutting speed, feed per tooth and depth of cut.Modeling is done by ANN. It is
best network model which gives minimum error between network output and real output.
Prediction is done by ANN. Result of ANN and Taguchi methods are compared. Best method is used
which gives the minimum error.
I. INTRODUCTION
As the machining process is non-linear and time dependent, it is difficult for the traditional
identification methods to provide an accurate model. To address this difficulty, non-traditional
techniques such as artificial neural networks (ANN) have been introduced. ANN can map the
input/output relationships and possess massive parallel computing capability, have attracted much
attention in research on machining processes. ANN provides significant advantages in solving
processing problems that require real-time encoding and interpretation of relationships among
variables of high-dimensional space. ANN has been extensively applied in modeling many
metal-cutting operations such as turning, milling and drilling.Recent functionality requirements have led to
development of components with varying free-form features. The ultimate goal of virtual machining
process research is to identify process related issues and solve them before the costly physical trials
in the shop. Modeling the process mathematically is necessary to achieve that goal in a Reasonable
amount of time and the first step of process modeling is to model the mechanics of the operation
that leads to the prediction of the cutting forces experienced by the cutting tool and the work-piece.
II. LITERATURE REVIEW
Eldon Y. Li et.al. (1994) proposed that artificial neural networks are increasingly popular in today’s business fields. They have been hailed as the greatest technological advance since the invention of
transistors. The paper reviewed the common characteristics of neural networks and discusses the
feasibility of neural-net applications in business fields.
R. Peres et.al. (1999) proposed that process optimization is a very important subject to several industrial sectors in confronting the growth on markets competition. However, due to the
complexity of some processes, their optimization is not an easy task; therefore, to accomplish this
objective, intelligent techniques should be used. We are working on end-milling process
optimization through combining analytic and fuzzy techniques.
J. F. Briceno et.al. (2002) proposed that two supervised neural networks are used to estimate the forces developed during milling. These two Artificial Neural Networks (ANNs) are compared based
on a cost function that relates the size of the training data to the accuracy of the model.
J.A. Ghani et.al. (2004) proposed the Taguchi optimization methodology, which is applied to
optimize cutting parameter in end milling when machining hardened steel AISI H13 with TiN coated
P10 carbide insert tool under semi-finishing and finishing conditions of high speed cutting. The
milling parameters evaluated is cutting speed, feed rate and depth of cut. An orthogonal array,
effect of these milling parameters. The analysis of the result shows that the optimal combination for
low resultant cutting force and good surface finish are high cutting speed, low feed rate and low
depth of cut.
S.Brevern et.al. (2009) proposed that the world of manufacturing has shifted its level to the era of space age machining. The purpose of this investigation is to develop Fuzzy based Graphical User
Interface (GUI) for modeling of laser machining conditions.
M.S. Yazdi et.al. (2010) studied that the selection of optimal machining parameters (i.e., spindle speed, depth of cut and feed rate) for face milling operations was investigated in order to minimize
the surface roughness and to maximize the material removal rate. Effects of selected parameters on
process variables (i.e., surface roughness and material removal rate) were investigated using
Response Surface Methodology (RSM) and artificial neural networks.
B. S.Reddy et.al. (2011) proposed that Pre-hardened steel (P20) is a widely used material in the production of moulds/dies due to less wear resistance and used for large components. In this study,
minimization of surface roughness has been investigated by integrating design of experiment
method, Response surface methodology (RSM) and genetic algorithm.
M. Bozdemir (2011) proposed that ANN modeling technique was developed with the results obtained from the experiments. For the training of ANN model, material type, cutting speed, cutting
rate, and depth of cutting parameters were used. In this way, average surface roughness values
could be estimated without performing actual application for those values. Various experimental
results for different material types with cutting parameters were evaluated by different ANN training
algorithms. So, it aims to define the average surface roughness with minimum error by using the
best reliable ANN training algorithm.
S. Hossain et. al. (2012) proposed that Surface roughness is an index which determines the quality of machined products and is influenced by the cutting parameters. In this study the average surface
roughness (Ra) value for Aluminum after ball end milling operation has been measured. 84
experiments have been conducted varying cutter axis inclination angle (φ degree), spindle speed (S
rpm), feed rate (mm/min), radial depth of cut (feed f mm), and axial depth of cut (t mm) in order to
find Ra. This data has been divided into two sets on a random basis; 68 training data set and 16
testing data set.
Taguchi Methodology. Experimental plan is performed by a Standard Orthogonal Array. The results
of ANOVA indicate that the feed Rate is most influencing factor for modeling surface finish. The
graph of S-N Ratio indicates the optimal setting of the machining parameter which gives the
optimum value of surface finish.
A.Sahoo et.al. (2014) studied the performance of multilayer coated carbide insert in the machining of hardened AISI D2 steel (53 HRC) using Taguchi design of experiment. The experiment was
designed based on Taguchi L27 orthogonal array to predict surface roughness. The S/N ratio and
optimum parametric condition are analyzed. In regression model, the value of R2 being 0.98
indicates that 98 % of the total variations were explained by the model. It indicates that the
developed model can be effectively used to predict the surface roughness on the machining of D2
steel with 95% confidence intervals.
III. EXPERIMENTAL DETAILS End Milling
Among different types of milling processes, end milling is one of the most vital and common metal
cutting operations used for machining parts because of its capability to remove materials at faster
rate with a reasonably good surface quality. Also, it is capable of producing a variety of
configurations using milling cutter. In end milling, the cutter, called end mill, has a diameter less than
the work piece width. The end mill has helical cutting edges carried over onto the cylindrical cutter
surface. End mills with flat ends (so called squire-end mills) are used to produce pockets, closed or
end key slots, etc.
In end milling an end mill makes either peripheral or slot cuts, determined by the step-over distance,
across the work piece in order to machine a specified feature such as a profile, slot, pocket, or even
a complex surface contour. The depth of the feature may be machined in a single pass or may be
Material Used
In this work hardened AISI D2 steel (hardness 50-70 HRC) will be used as the work piece material and
Tungsten carbide preferably coated will be used as the tool material. Because increasing tool life is
main concern of hard machining to decrease the cost of the machining process. A particular amount
of maximum flank wear say 0.2 to 0.3 µm can be used as the tool life failure criterion. Flank wear can
be measured using toolmaker’s microscope. The chemical composition of AISI D2 tool steel is given
in below Table 3.1.
Table 3.1 Chemical Composition of Steel
Carbon Silicon Manganese Chromium Molybdenum Vanadium
1.55 % 0.30 % 0.35 % 12 % 0.75 % 0.90%
AISI D2 is recommended for tools requiring very high wear resistance, combined with moderate
toughness (shock-resistance). AISI D2 can be supplied in various finishes, including the hot-rolled,
pre-machined and fine machined condition forming Dies, Punches, Forming Rolls, Knives, Slitters,
Shear blades.
Machine Used
Machining was carried out in CNC machine at CTR, Ludhiana.
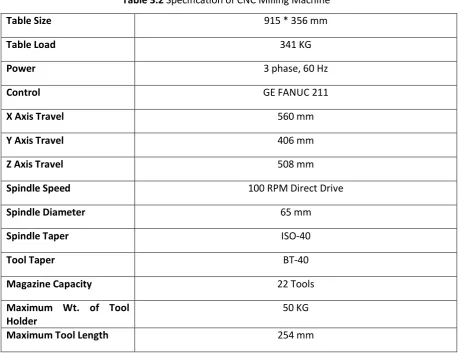
Table 3.2 Specification of CNC Milling Machine
Table Size 915 * 356 mm
Table Load 341 KG
Power 3 phase, 60 Hz
Control GE FANUC 211
X Axis Travel 560 mm
Y Axis Travel 406 mm
Z Axis Travel 508 mm
Spindle Speed 100 RPM Direct Drive
Spindle Diameter 65 mm
Spindle Taper ISO-40
Tool Taper BT-40
Magazine Capacity 22 Tools
Maximum Wt. of Tool Holder
50 KG
Maximum Tool Length 254 mm
Table 3.3 Levels of Input Control Parameters
Factors Levels Factor Level values
Speed (rpm) 3 500,750,1000
Depth of Cut (mm) 3 0.75,0.50,0.25
Feed (mm/min) 3 750,1000,1250
The optimum condition is identified by studying the main effects of each of the parameters. The
main effects indicate the general trend of influence of each parameter. The knowledge of
contribution of individual parameters is a key in deciding the nature of control to be established on a
production process. Orthogonal Array is a statistical method of defining parameters that converts
test areas into factors and levels. Test design using orthogonal array creates an efficient and
concise test suite with fewer test cases without compromising test coverage. An orthogonal
array is a "table" (array) whose entries come from a fixed finite set of symbols (typically, {1,2,..., n}),
all ordered t-tuples of the symbols, formed by taking the entries in each row restricted to these
columns, appear the same number of times. The number t is called the strength of the orthogonal
array. The Table 3.4 shows the design matrix used in this work.
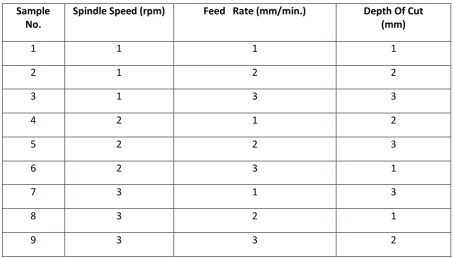
Table 3.4 Orthogonal Array L9 Sample
No.
Spindle Speed (rpm) Feed Rate (mm/min.) Depth Of Cut (mm)
1 1 1 1
2 1 2 2
3 1 3 3
4 2 1 2
5 2 2 3
6 2 3 1
7 3 1 3
8 3 2 1
9 3 3 2
IV. EXPERIMENTAL PROCEDURES
Checking and preparing the Centre Lathe ready for performing the machining operation. Firstly, the work-piece was cut according to above mentioned dimension i.e. 100*100*25 mm
by cutter of diameter 32 mm.
For developing models on the basis of experimental data three main machining parameters
are considered to predict surface roughness of D2 material using carbide tool. Among the
range of spindle speed, feed, and depth of cut available possible in the machine the following
three levels are considered as shown in Table 3.3.
The machining was carried out on end milling machine, the material work piece is clamped on
vice mounted on the table of the machine. The machining process and work tool motion of
the end milling process respectively.
The machining is carried out by selecting proper spindle speed and feed rate during each
Taguchi's designs aimed to allow greater understanding of variation than did many of the
traditional designs. Taguchi contended that conventional sampling is inadequate here as there
is no way of obtaining a random sample of future conditions. Taguchi suggests a three-stage
process:
System design, Parameter design, Tolerance design.
Artificial neural networks (ANNs) are non-linear data driven self-adaptive approach as opposed to
the traditional model based methods. They are powerful tools for modeling, especially when the
underlying data relationship is unknown. ANNs can identify and learn correlated patterns between
input data sets and corresponding target values. After training, ANNs can be used to predict the
outcome of new independent input data. ANNs imitate the learning process of the human brain and
can process problems involving non-linear and complex data even if the data are imprecise and
noisy. Thus they are ideally suited for the modeling of agricultural data which are known to be
complex and often non-linear.
Development of an ANN model
The various steps in developing a neural network model are:
Variable Selection
Formation of Training, Testing and Validation Sets
Neural Network Architecture Number of Hidden Layers
Number of Hidden Nodes
Number of Output Nodes
V. RESULTS AND DISCUSSION
End milling is one of the most fundamental and commonly encountered chip removal operations
occurring in a real manufacturing environment. In this machining process, the surface finish is a key
factor in evaluating and determining the quality of a part. In practice, a desired surface roughness
value is usually designated, and the appropriate cutting parameters are selected to achieve the
desired quality of a specified part. The single point incremental forming (SPIF) process is performed
Table 5.1 Measured Surface Roughnesses
Pieces Speed
(rpm)
Depth of Cut (mm)
Feed (mm/min) Surface Roughness (µm)
1 500 750 0.75 0.73
2 500 1000 0.50 0.77
3 500 1250 0.25 0.82
4 750 750 0.50 0.72
5 750 1000 0.25 0.49
6 750 1250 0.75 0.63
7 1000 750 0.25 0.42
8 1000 1000 0.75 0.72
9 1000 1250 0.50 0.55
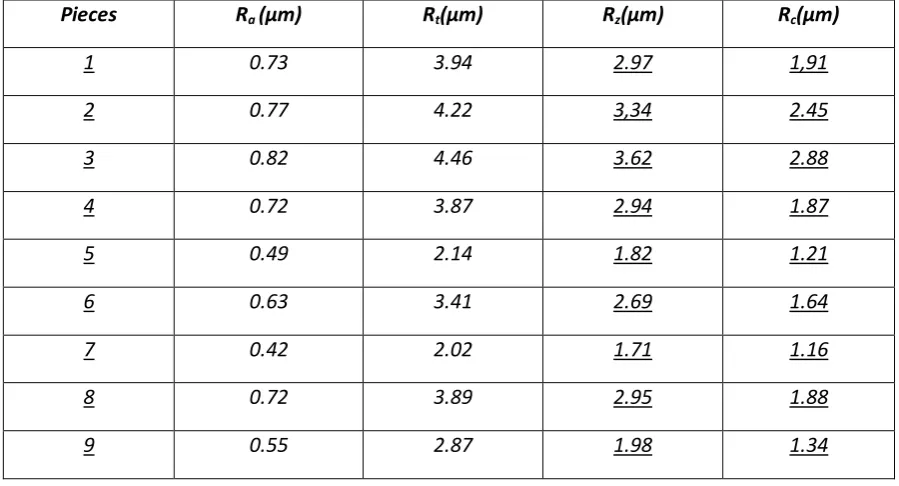
Table 5.2 Measured Roughness Parameters
Pieces Ra (µm) Rt(µm) Rz(µm) Rc(µm)
1 0.73 3.94 2.97 1,91
2 0.77 4.22 3,34 2.45
3 0.82 4.46 3.62 2.88
4 0.72 3.87 2.94 1.87
5 0.49 2.14 1.82 1.21
6 0.63 3.41 2.69 1.64
7 0.42 2.02 1.71 1.16
8 0.72 3.89 2.95 1.88
9 0.55 2.87 1.98 1.34
5.1 Performance Analysis by ANN
Training a neural network to learn patterns in the data involves iteratively presenting it with
examples of the correct known answers. The objective of training is to find the set of weights
between the neurons that determine the global minimum of error function. This involves decision
learning rate (a constant of proportionality which determines the size of the weight adjustments
made at each iteration) and momentum values (how past weight changes affect current weight
changes.
Figure 3 Neural Network Training
Best Model achieved in ANN is with feed forwarded back propagation neural network with
Levenberg-Marquardt training function with three layers. [Network (3-5-1-1)]
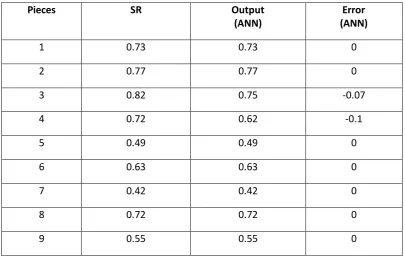
Table 5.3 Output from ANN Technique
Pieces SR Output
(ANN)
Error (ANN)
1 0.73 0.73 0
2 0.77 0.77 0
3 0.82 0.75 -0.07
4 0.72 0.62 -0.1
5 0.49 0.49 0
6 0.63 0.63 0
7 0.42 0.42 0
8 0.72 0.72 0
9 0.55 0.55 0
5.2 Optimization by Taguchi Method
Since 1960, Taguchi methods have been used for improving the quality of Japanese products with
quality were not competitive with the Japanese methods. Performance characteristics are first
converted into the S/N ratio using the Taguchi method. Using S/N quantity, optimal performance
and minimal variance can be designed. The SR value is calculated for each trial from the basic data
collected . The signal to-noise ratios of each experimental run are calculated based on the following
equation, which are listed in corresponding tables with the data.
𝑆𝑁𝑅 = −10𝑙𝑜𝑔
1
𝑛
𝑦
2Figure 2-S/N ratio Table 5.3 ANOVA
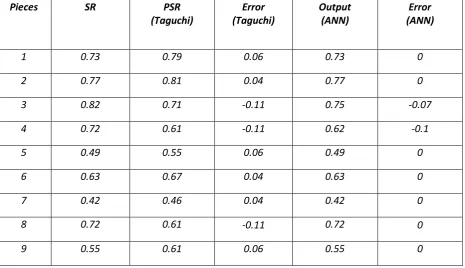
Table 5.4 Comparison of Taguchi and ANN
Output Comparison of Taguchi Method and ANN Technique
Mean Absolute Percentage Error (MAPE) = 1 n∑ *│Pi Mi│+ Mi 100
Pieces SR PSR
(Taguchi)
Error (Taguchi)
Output (ANN)
Error (ANN)
1 0.73 0.79 0.06 0.73 0
2 0.77 0.81 0.04 0.77 0
3 0.82 0.71 -0.11 0.75 -0.07
4 0.72 0.61 -0.11 0.62 -0.1
5 0.49 0.55 0.06 0.49 0
6 0.63 0.67 0.04 0.63 0
7 0.42 0.46 0.04 0.42 0
8 0.72 0.61 -0.11 0.72 0
(Always take Error as Positive)
Where, Pi= predicted value
Mi= measured value
n= No. of Experiments
MAPE in Taguchi method = 10.77%
MAPE in ANN = 2.90%
So, ANN gives less MAPE as compared to Taguchi Method.
VI. CONCLUSION
1. The higher the cutting speed, the lower is the surface roughness.
2. The experimental results show that average surface roughness is low at lower depth of cut.
3. For achieving good surface finish on the D2 work piece, higher cutting speed, lower feed and
lower depth of cut are preferred. The optimal parametric combination for AISI D2 Steel is
speed3-feed1- depth of cut1.
4. ANOVA shows that the cutting speed is the most influencing parameter for surface roughness.
5. Mean Absolute Percentage Error is calculated in Taguchi method is 10.77% and Mean
Absolute Percentage is Calculated in MATLAB is 2.90% so ANN technique gives us better results
than Taguchi method .Error is minimized by ANN technique.
6. Best Model achieved in ANN is with feed forwarded back propagation neural network with
VII. REFERENCES
1. A.Behera, S.Behera, R.K Tripathy, S.C Mishra, “Least Square Support Vector Machine Alternative To Artificial Neural Network For Prediction Of Surface Roughness And Porosity Of
Plasma Sprayed Copper Substrates”, December, 2012.
2. A.Jameel, M. Minhat, Md. Nizam, “Using Genetic Algorithm to Optimize Machining Parameters in Turning Operation: A review”, Volume 3, Issue 5, May 2013.
3. A.Joshi & P.Kothiyal, “Investigating Effect of Machining Parameters of CNC Milling on Surface Finish by Taguchi Method”, Volume-2, Issue-2, 2013.
4. A.K Sahoo, “Application of Taguchi and regression analysis on surface roughness in machining hardened AISI D2 steel”, International Journal of Industrial Engineering Computations 2014.
5. A.K Gupta, P.Chandna, P.Tandon, “Tool Life Optimization in 2.5d Milling By Coupling Regression Model And Genetic Algorithm”, International Journal of Engineering and
Technology Volume 1 No. 1, October, 2011.
6. A. Aggarwal and H. Singh, “Optimization Of Machining Techniques – A Retrospective and Literature Review” SadhanaVol. 30, Part 6, December 2005.
7. B.C Routara, S.D Mohanty, S.Datta, A. Bandyopadhyay and S.SMahapatra, “Optimization in CNC end milling of UNS C34000 medium leaded brass with multiple surface roughness
characteristics” Vol. 35, Part 5, October 2010.
8. Clodeinir Ronei Peres, Rodolfo Elias Haber Guerra, Rodolfo Haber Haber, Angel Alique and Salvador Ros, “Fuzzy model and hierarchical fuzzy control integration: an
approach for milling process optimization”, Computers in Industry 39 _1999. 199–207.
9. N. H. Razak, M.M. Rahman, M.M. Noor1 and K. Kadirgama, “ARTIFICIAL INTELLIGENCE TECHNIQUES FOR MACHINING PERFORMANCE: A REVIEW”, National Conference in
Mechanical Engineering Research and Postgraduate Studies (2nd NCMER 2010) 3-4 December
2010, Faculty of Mechanical Engineering, UMP Pekan, Kuantan, Pahang, Malaysia; pp. 39-53.
10. Ramezan Ali Mahdavinejad, Navid Khani and Mir Masoud Seyyed Fakhrabadi, “Optimization of milling parameters using artificial neural network and artificial immune system”, Journal of
AUTHORS BIOGRAPHIES
ALAMDEEP CHEEMA passed his diploma in Mechanical engineering in 2008 from haryana state board of technical education and B.tech in 2011 From kurukshetra
universitsy kurukshetra and pursuing M.tech from KUK.
RAJIV KUMAR passed his B.tech from JIET, jind in 2005 and M.tech from GJU Hisar in 2010. Presently he is working as the Assistant Professor in GIMT kurukshetra.