Available online: https://pen2print.org/index.php/ijr/ P a g e | 803 A Study on Real Consumption levels and Performance of Public Distribution System in
Thoothukudi District
* F.Stalin
Introduction
Thoothukudi district, Public Distribution System is currently operated state government as
the joint responsibility of procuring, storing, transporting and allocation of food grains to the
governments. The policy of allocation under the Public Distribution System in India has been
the subject of intense debate among economists as well as in policy circles. For instance, Parikh
(1994) emphasized the implicit subsidy through Public Distribution System. So the principle of
allocation is somewhat adhoc. It has been done on the ‘historical basis’ ad is incremented subject
to availability as per demand from population in the living areas. In this sense, the role of Public
Distribution System is really one of the subsidizing factor in real consumption. In the present
paper we evaluate the current policy of allocation on the basis of this notion of providing a real
consumption subsidy.
Taluk wise Cereal Demand in Thoothukudi District Rural and Urban
The National Sample Survey 66th Round (July 2009 – June 2010) and 67th round (july
2010 – June2011) contain data on average monthly per capita expenditure (weighted average that
accounts for the distribution of expenditure amongst different MPCE classes in the district),
quantity and value of rice and wheat consumed per person in 30 days. We first estimated the own
price elasticity of demand, the cross elasticity and the income elasticity non-parametrically.
However, since the data points were very few. So that the results were inefficient hence,
we pooled the data and used appropriate dummies to capture Taluk wise differences. District
Statistical book data for 6 Taluk, Thus the sample size is 6. The implicit price is obtained by
dividing the value of expenditure by the quantity of rice or wheat purchased as the case may be.
Available online: https://pen2print.org/index.php/ijr/ P a g e | 804 *F.Stalin, Research Scholar, Department of Economics, Research Center in Pope’s College,
Sawyerpuram. Manoanmaniam Sundaranar University.Tirunelveli.
The average monthly per capita expenditure (MPCE) is deflated by the consumer price
index (CPI) and taken to be an indicator of real income.
Ratio of Actual Levels of Consumption to Predicted Levels
Taluk Rural Urban
Rice Wheat Rice Wheat
Thoothukudi
2015 0.613177 1.169399 1.533543 0.885386
2016 0.916255 0.610937 1.22799 1.161177
2017 0.915438 0.938505 1.12797 1.069597
Thiruchendur
2015 0.607302 1.172832 1.51885 0.887984
2016 0.911781 0.610937 1.117315 1.161177
2017 0.912698 0.938505 1.11844 1.069597
Sathankulam
2015 0.619472 1.165759 1.549286 0.884889
2016 0.918139 0.604344 1.125107 1.148647
2017 0.918095 0.936673 1.125054 1.067508
Srivaikundam
2015 0.614306 1.168744 1.536366 0.884889
2016 0.914128 0.613857 1.120192 1.166727
2017 0.914477 0.940292 1.120619 1.071633
Kovilpati
2015 0.61365 1.169125 1.534726 0.885177
2016 0.913922 0.607745 1.11994 1.155111
2017 0.91443 0.937861 1.120562 1.068863
Vilathikulam
2015 0.615658 1.16796 1.539747 0.884296
2016 0.913922 0.607424 1.11994 1.1545
2017 0.914347 0.93783 1.12046 1.068827
Ottaipidaram
2015 0.619385 1.165809 1.549069 0.882667
2016 0.91808 0.607442 1.125035 1.154534
2017 0.916445 0.937774 1.123032 1.068763
Ettyapuram
2015 0.615061 1.168306 1.538256 0.884557
2016 0.914502 0.613763 1.12065 1.166548
2017 0.915242 0.939181 1.121557 1.070367
Source: Compiled to NSS Price data and District Population Statistical Data in Thoothukudi Taluk.
Available online: https://pen2print.org/index.php/ijr/ P a g e | 805 The demand model is a double-log function so that the estimation of elasticity’s becomes
linear.
Log Qux=b1LogPx + b2LogPy + b3LogI + wT + €t --- (1)
Where
Qux =per capita consumption of X (rice/wheat) in a month,
A0 =minimum consumption level,
b1 = partial own price elasticity,
b2 = partial cross elasticity (wrt substitute cereal Y),
b3 = partial income elasticity (wrt (I) money income),
W = growth in minimum consumption level of rice or wheat,
T = time trend,
And,
QN
x = (Anti (Log Q X)*PR+Anti (Log Qx)*PU)*12 ---(2)
U = (Superscript) urban
R = (superscript) rural,
N = (superscript) national and
P = Population
The predicted value of Log Q can be obtained from (1). Its antilog gives the estimate of
per capita per mensem demand capita for the particular cereal, rice or wheat, which when
multiplied by either rural or urban population of India, gives the demand for the particular
region, Equation (2) gives the total demand at the national level.
Consumption in each Taluk can be obtained by constructing individual equations from the
aggregate equation since the difference in intercept as well as the difference in slope for major
consuming District are known four equation, pooling al Taluk wise, were estimated; one each for
each cereal and one each for each sector – rural and urban.
Table 2,1 Equation For Cereal Demand At Taluk Level( Rural Rice)
Available online: https://pen2print.org/index.php/ijr/ P a g e | 806
R2 = 1 Dubin Watson 2.89137
No Label LAG Co-Efficient Standard Error T-Statistic
1 LPRW 0 0.0612 3E-32 21E+30
2 LPRR 0 - 0.2809 0 0.6551
3 DMCPUR 0 0.07825 -4.7E-33 1.7E-31
4 Thoothukudi 0 -3.7E- 05 1.96E-07 -189.582
5 Thiruchendur 0 -6E-05 9.95E-05 -0.60451
6 Sathankulam 0 0.00013 2.96E-05 -4.51371
7 Kovilpati 0 -0.00039 0.00476 -0.82364
8 Srivaikundam 0 -0.00014 0.000217 -0.638865
9 Vilathikulam 0 -0.00239 0.001441 -1.65651
10 Ottaipidaram 0 -0.00015 2.21E-05 -6.68453
11 Ettyapuram 0 -6.8E-05 0.000105 0.64281
Zero Degree Homogenity: LPRR=log of price of rural rice
LPRW = log of price of rural wheat (substitute grain)
DMCPR = log of price of monthly expenditure per capita.
Thoothukudi Taluk wise Real Consumption
To return to the theme of Thoothukudi Taluk level estimates, it would be appropriate to
recapitulate the key issues. At the Taluk level NSS data reflect the monthly per capita
expenditure on cereals, amongst other things. We have used this rich source to estimate the true
levels of consumption in different Taluks. The methodology is to estimate demand equations of
Available online: https://pen2print.org/index.php/ijr/ P a g e | 807
consumption per capita per month on the hypothetical basis that real income remains constant.
To this end, the basic relationship between demand, income and prices is used.
In genereal, the demand function is defined as
DX = f(PX, PS, PC, I)
DX = demand for commodity X
PX = price of commodity X
PS = Price of Substitutes
PC = Price of compliments
I = Money Income
The demand function is homogeneous of degree zero if the following relation holds:
(δDX/δPX)*PX + (δDs/δPS)*PS +(δDc/δPc)*Pc +(δDX/δI*I = 0
Dividing throughout by DX, this relationship gets converted into an additive function
between all the elasticities of demand. Namely, the own price elasticity, elasticity with respect to
price of substitutes and/or price of complements. This implies: ηx+ηS+ηC+ηI = 0
Where ηi are the respective elasticities. This can be tested using the standard F test. Such
a test would reveal whether the assumption of the degree of homogeneity being zero is true. If
the test validates this restriction, then the implication is that the levels of consumption remain
constant if all prices increase along with an increase in the money income, such that real income
remains constant. This is in keeping with Engel’s law where the levels and patterns of real
consumption depend upon real income. The advantage with verifying such a hypothesis of zero
degree homogeneity is that stable levels of consumption can then be predicted. In the subsequent
analysis of allocation and lifting from Public Distribution System, these stable levels of
consumption have been used as a basis for making comparisons. The basic assumption in this
study is that in the given three years the average real income is constant. Therefore, stable levels
of consumption can be estimated and can be compared with the actual levels of allocation and
Available online: https://pen2print.org/index.php/ijr/ P a g e | 808
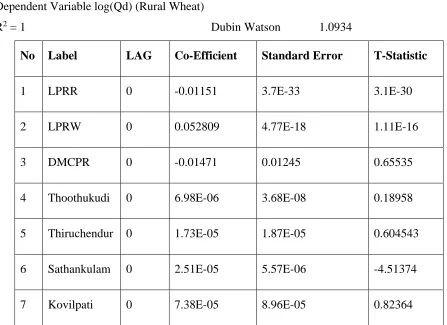
Table 2,2 Equation For Cereal Demand At Taluk Level( Rural Wheat)
Dependent Variable log(Qd) (Rural Wheat)
R2 = 1 Dubin Watson 1.0934
No Label LAG Co-Efficient Standard Error T-Statistic
1 LPRR 0 -0.01151 3.7E-33 3.1E-30
2 LPRW 0 0.052809 4.77E-18 1.11E-16
3 DMCPR 0 -0.01471 0.01245 0.65535
4 Thoothukudi 0 6.98E-06 3.68E-08 0.18958
5 Thiruchendur 0 1.73E-05 1.87E-05 0.604543
6 Sathankulam 0 2.51E-05 5.57E-06 -4.51374
Available online: https://pen2print.org/index.php/ijr/ P a g e | 809
8 Srivaikundam 0 2.6E-05 4.09E-05 0.63725
9 Vilathikulam 0 0.00449 0.00271 1.65651
10 Ottaipidaram 0 2.78E-05 4.16E-05 0.63681
11 Ettyapuram 0 1.27E-05 1.98E-05 0.64280
Zero Degree Homogenity: LPRR=log of price of rural rice
LPRW = log of price of rural wheat (substitute grain)
DMCPR = log of price of monthly expenditure per capita.
Consumption Level Estimation and Methodology
Regression equations for the dour data series relating to demand for superior cereals were
estimated by using slope and intercept Taluk variables. 8 Taluk Consuming Variables were used
to pick up inter- district differences. Similarly, in the initial estimates, 8 trend variables were also
included. Apart from this, a dummy each for major wheat consuming and major rice consuming
only formed. This serves the purpose of identifying the difference between the coefficients for
Table 2.3 Equation For Cereal Demand At Taluk Level( Urban Rice)
Dependent Variable log(Qd) (Urban Rice)
Regression2 : 1 Dubin Watson 3.021224
No Label LAG Co-Efficient Standard Error T-Statistic
1 LPUW 0 -0.06527 0.00192 0.65535
2 LPUR 0 -0.23995 7.88E-33 0.3E-31
3 DMCPU 0 -0.05131 0.00025 0.65535
4 Thoothukudi 0 -6.8E-05 3.6E-07 0.189582
Available online: https://pen2print.org/index.php/ijr/ P a g e | 810
6 Sathankulam 0 -0.00025 5.44E-05 -4.51371
7 Kovilpati 0 0.00072 0.00876 -0.82364
8 Srivaikundam 0 -0.00025 0.0004 -0.63726
9 Vilathikulam 0 -0.00439 0.002649 -1.65651
10 Ottaipidaram 0 -0.00027 4.07E-05 -6.68452
11 Ettyapuram 0 -0.0012 0.000193 -0.64281
Zero Degree Homogenity: LPUR=log of price of urban rice
LPUW = log of price of Urban wheat (substitute grain)
DMCPU = log of price of monthly expenditure per capita.
Major Taluk dummies of either rice or wheat. For a rigorous testing of the zero degree
homogeneity condition, own price, price of substitutes, price of complements and income need to
be included as explanatory variables. Some of the trend variables were found to be insignificant
in the initial estimation and were dropped. The study also tries to incorporate income
inequalities. This was done in the light of the argument of Kumar, R.P segrant and Boulis(1994),
who emphasized the significance of income inequalities in the determination of consumer
demand. Dummies were created for groups of Taluk amongst the sample 8, which happened to
fall in the same quartile range of monthly per capita consumption expenditure. These dummies
were used to determine the differences in coefficients for these four groups in respect of the
income variable. Once again, the results were not significantly different from the initial
estimates, which took income as a gross variable. Neither were they illuminating in terms of
different signs for high classes. The final estimates therefore, were based on the original model
in which consumption expenditure was taken in money in terms and as a single variable.
Table 2,4 Equation For Cereal Demand At Taluk Level( Urban Wheat)
Dependent Variable log(Qd) (Urban Wheat)
Available online: https://pen2print.org/index.php/ijr/ P a g e | 811
No Label LAG Co-Efficient Standard Error T-Statistic
1 LPUW 0 -0.01224 3.7E-33 -3.3E-13
2 LPUR 0 0.05618 4.77E-08 5.41E-17
3 DMCPU 0 -0.01565 4.77E-18 4.41E-05
4 Thoothukudi 0 7.43E-06 3.92E-08 0.18958
5 Thiruchendur 0 1.2E-05 1.99E-05 0.604
6 Sathankulam 0 2.67E-05 5.92E-06 0.45137
7 Kovilpati 0 7.85E-05 9.53E-05 0.82364
8 Srivaikundam 0 2.77E-05 4.35E-05 0.638805
9 Vilathikulam 0 0.000477 0.000288 1.65124
10 Ottaipidaram 0 2.96E-05 4.43E-06 -6.684
11 Ettyapuram 0 1.35E-05 2.11E-05 0.6428
Zero Degree Homogenity: LPUR=log of price of urban wheat
LPUR = log of price of Urban rice (substitute grain)
DMCPU = log of price of monthly expenditure per capita.
DEGREE OF HOMOGENEITY
For verifying the hypothesis of the degree of homogeneity being zero, two tests were
conducted. The first was a single linear restriction on all the coefficients of own price, price of
substitutes and income, that is, Test 1. (major consuming Taluk)
b1+b2+b3+b1*DW + b2+b3+b1*DW = 0 (1)
with dummy Dr for rice (rural and urban) equations and dummy Dw for wheat(rural and urban)
equations.
Available online: https://pen2print.org/index.php/ijr/ P a g e | 812
All pooled equations have high explanatory power. The minimum R2 is 1 which is in the case of
rural wheat consumption. Were made (Table 2.1 to 2.4).
Rural Rice
The own elasticity bears the right sign at the Thoothukudi District level and is
large(0.0612 in Table 2.1) for overall rice consumed in the study year, the interaction dummy
variable is significant and negative at -0.2809, negative price elasticity shows. For the
Thoothukudi district income elasticity is 0.08. Most of the intercepts are significant. With the
sign varying in different cases, There is no intercept and no significant in Thoothukudi Taluk
variables. The noticeable factor is that there is a definite negative trend that is both statistically
significant and numerically weighty. This points to a small decline in rice consumption in all
taluk . The reverse trend can be seen in urban rice consumption. However, interestingly, these
are independent trends, because the states n which the decline is apparent, do not match the
states in which wheat consumption has been rising. A more detailed analysis of the changes in
the real income levels and a inter taluk level study for regional patterns may reveal a shift
towards superior cereal substitutes. Of the two tests, the null hypothesis of zero degree
homogeneity is accepted only for the major consuming District(Thoothukudi Taluk).
Rural Wheat
Results for this are reported in Table 2.2. wheat consumption in Rural areas has an
overall own price elasticity of -0.01. The corresponding elasticity for major consuming areas is
less nevertheless, bears the right sign, and stands at -0.228 (given by -0.01151 +0.52809). The
difference, however is significant only at 10 percent level. The price of rice as a substitute bears
a negative sign and is significant, with its value being 0.01471. The corresponding elasticity is
-0.067 for the major consuming areas (given by -0.01471+0.0552809). this means that rice is
definitely a substitute for wheat in consuming areas and, significantly, its income elasticity is
lower than the income elasticity. This is direct evidence of change in consumption patterns in
major rice consuming areas in Thoothukudi District. The growth rates are also fairly high. It may
be concluded that the total cereal intake in these taluk has increased since none amongst them
Available online: https://pen2print.org/index.php/ijr/ P a g e | 813
degree of homogeneity follows the same pattern of being accepted for the major consuming
states and rejected at the Thoothukudi Taluk Wise level (Table 2.2)
Urban Rice
The own price elasticity at the Thoothukudi District Taluk level is -0.06527 and
significant. There is no significant difference between the elasticity of major consuming areas
and the Thoothukudi Taluk levels magnitude. Wheat price elasticity is positive and almost equal
to unity. It is significant at both levels, but is marginally negative for the major consuming areas.
The income elasticity of demand, in general, is insignificant but bears negative sign. This
virtually means that rural rice consumption in major consuming areas has an income elasticity of
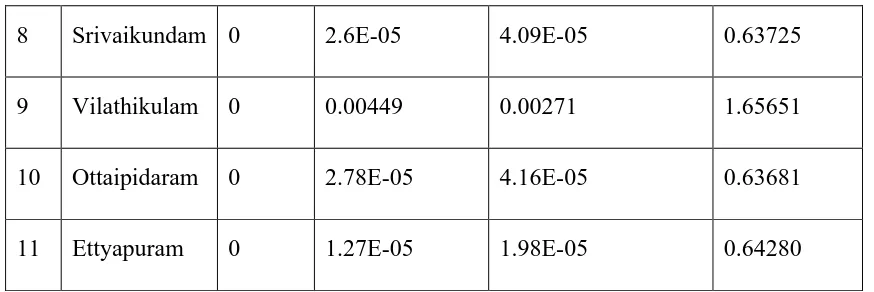
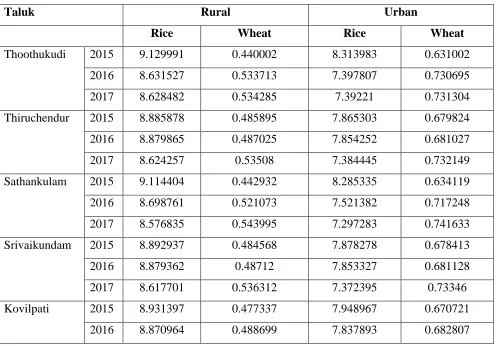
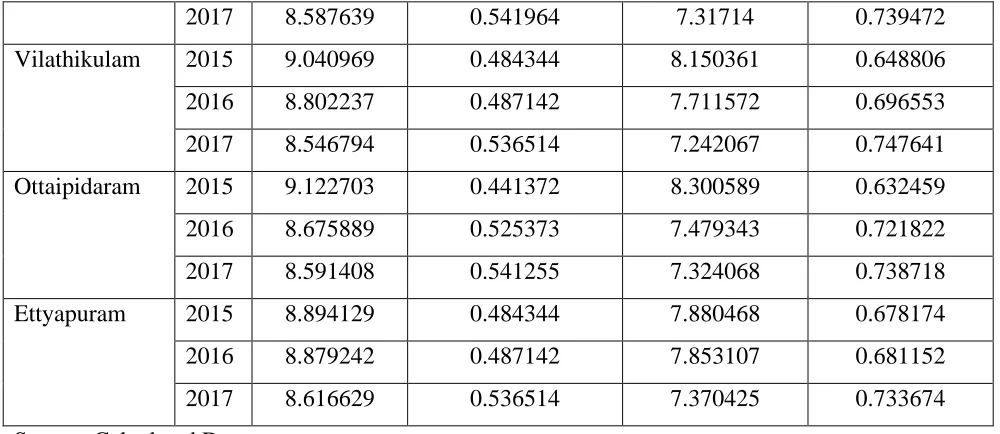
Table 3: Stable Predicted Demand for Rice and Wheat in Tuticorin District(Taluk Wise Report)
Per capita /per month (in kg)
Taluk Rural Urban
Rice Wheat Rice Wheat
Thoothukudi 2015 9.129991 0.440002 8.313983 0.631002
2016 8.631527 0.533713 7.397807 0.730695
2017 8.628482 0.534285 7.39221 0.731304
Thiruchendur 2015 8.885878 0.485895 7.865303 0.679824
2016 8.879865 0.487025 7.854252 0.681027
2017 8.624257 0.53508 7.384445 0.732149
Sathankulam 2015 9.114404 0.442932 8.285335 0.634119
2016 8.698761 0.521073 7.521382 0.717248
2017 8.576835 0.543995 7.297283 0.741633
Srivaikundam 2015 8.892937 0.484568 7.878278 0.678413
2016 8.879362 0.48712 7.853327 0.681128
2017 8.617701 0.536312 7.372395 0.73346
Kovilpati 2015 8.931397 0.477337 7.948967 0.670721
Available online: https://pen2print.org/index.php/ijr/ P a g e | 814
2017 8.587639 0.541964 7.31714 0.739472
Vilathikulam 2015 9.040969 0.484344 8.150361 0.648806
2016 8.802237 0.487142 7.711572 0.696553
2017 8.546794 0.536514 7.242067 0.747641
Ottaipidaram 2015 9.122703 0.441372 8.300589 0.632459
2016 8.675889 0.525373 7.479343 0.721822
2017 8.591408 0.541255 7.324068 0.738718
Ettyapuram 2015 8.894129 0.484344 7.880468 0.678174
2016 8.879242 0.487142 7.853107 0.681152
2017 8.616629 0.536514 7.370425 0.733674
Source: Calculated Data
demand which is around 0.05, and is highly significant. The intercepts of Thoothukudi dummy
variables are not significant. There is an unmistakable trend of decline in rural rice consumption.
Significant falling trend rates are observed in all dummy variables. The degree of homogeneity is
zero at the district level(Table 2.3).
Urban Wheat
Urban wheat consumption is negaively related to own price at both levels but is
significant only for major consuming areas in Thoothukudi District. Its value is -0.012. rice as a
substitute.
Table 4: Stable Predicted Demand for Rice and Wheat Tuticorin District(Taluk wise Report)
Available online: https://pen2print.org/index.php/ijr/ P a g e | 815
Taluk Rural Urban
Rice Wheat Rice Wheat
Thoothukudi 2015 10517.99 919.114 9577.925 1318.091
2016 18779.16 970.3898 16095.02 1328.54
2017 18778.64 989.2964 16088.07 1354.102
Thiruchendur 2015 6117.58 633.2108 5414.954 885.936
2016 10930.51 552.4346 9668.051 772.4919
2017 10936.88 612.9145 9364.608 838.6498
Sathankulam 2015 2635.35 221.8942 2395.632 317.6725
2016 4730.57 227.2119 4090.286 312.7533
2017 4731.726 240.8717 4025.814 328.3825
Srivaikundam 2015 5527.364 541.6509 4896.707 758.3312
2016 9867.553 473.9411 8727.33 662.7003
2017 9641.951 521.366 8248.635 713.0199
Kovilpati 2015 4597.153 443.971 4091.479 623.8373
2016 8163.854 395.6349 7213.13 552.7784
2017 8050.441 441.8866 6859.418 602.9234
Vilathikulam 2015 3565.094 340.1324 3213.903 455.6265
2016 6205.887 302.0517 5436.929 431.8967
2017 6068.148 331.9109 5141.803 462.5233
Ottaipidaram 2015 2597.704 217.8915 2363.606 312.2251
2016 4643.299 225.7496 4002.913 310.1625
2017 4640.441 243.2969 3955.918 332.0575
Ettyapuram 2015 1840.654 179.2817 1630.875 251.0286
2016 3302.352 157.3319 2920.713 219.9911
2017 3493.412 185.8585 2988.167 254.1585
Available online: https://pen2print.org/index.php/ijr/ P a g e | 816
bears a positive sign and is not significant at the Thoothukudi Taluk level but is
positively stands for 0.043 (given by -0.01224 + 0.05618) for the major consuming areas in
Thoothukudi. Income in this case is not significant at the 5 percent level but is significant at the
10 percent level for both the Thoothukudi districts. The demand for rural wheat also display zero
degree homogeneity at both levels. This implies that in general the consumption of cereals in
rural areas conforms to real income levels(Table 2.4).
Conclusion
These demand equations were used to predict the stable consumption levels generated on the
hypothetical basis that if real income remains constant the levels of demand too remain constant
the levels of demand too remain constant. This is an outcome of the degree of homogeneity
being zero, which has been verified at almost all levels, and for both rural and urban areas. The
predictive efficiency of the model and the specific equations has been tested on the basis of the
ratio of actual levels of consumption to such predicted levels of hypothetical consumption. The
results of this test show that there is not maximum deviation are in the case of rural and urban
commodities consumption the study period. In all cereals consumption in Thoothukudi Taluk is
Available online: https://pen2print.org/index.php/ijr/ P a g e | 817 Referrence:
1. Kumar, Praduman, et, al. (1994), “Demand for Food grains and Other Foods in India”,
IARI and IFPRI, Washington, Delhi.
2. Parikh,K.S. (1994), “who gets how much from PDS- How Effectively Does it reach the
poor?”, Sarvekshna, January – March, P.P 1-70.
3. Raghbendra Jha, K.V. Bhanu Murthy (1999), “Real consumption levels and PDS in