ORGANISATIONAL RESOURCES AND PERFORMANCE OF SELECTED CREDIT ONLY MICROFINANCE INSTITUTIONS IN NAIROBI CITY
COUNTY, KENYA
BY
IRENE WANGUI KIMARU
D53/CTY/PT/37435/2016
A RESEARCH PROJECT SUBMITTED TO THE SCHOOL OF BUSINESS IN PARTIAL FULFILLMENT OF THE REQUIREMENTS FOR THE AWARD
OF DEGREE OF MASTER OF BUSINESS ADMINISTRATION OF KENYATTA UNIVERSITY
ii DECLARATION
This research project is my original work and to the best of my knowledge has not been presented for a degree or other award in any other university. No part of this proposal should be reproduced without my authority or/ and that of Kenyatta University.
Signed ……… Date ………
Irene Wangui Kimaru
Department of Business Administration
I confirm that the work presented in this research project has been carried out by the candidate under my supervision.
Signed ……… Date ………
Dr. Godfrey Kinyua
Department of Business Administration School of Business
iii
DEDICATION
iv
ACKNOWLEDGEMENT
I wish to recognize the efforts, dedication and able guidance of my supervisor Dr. Godfrey Kinyua in ensuring that this research project is up to the standards of the university. More specifically, I wish to thank him for his undivided attention to my work and paying close attention to fine details to make sure that the work is of high quality. I am appreciative to my colleagues in the master’s class whom we have supported each other throughout the course.
v
TABLE OF CONTENTS
DECLARATION... ii
DEDICATION... iii
ACKNOWLEDGEMENT ... iv
TABLE OF CONTENTS ... v
LIST OF TABLES ... viii
LIST OF FIGURES ... ix
OPERATIONAL DEFINITION OF TERMS ... x
ABBREVIATIONS AND ACRONYMS ... xi
ABSTRACT ... xii
CHAPTER ONE ... 1
1.1 Background of the Study ... 1
1.1.1 Organisation Performance ... 2
1.1.2 Organisation Resources ... 3
1.1.3 Credit Only Microfinance Institutions in Kenya ... 5
1.2 Statement of the Problem ... 7
1.3 Research Objectives of the Study ... 9
1.3.1 General Objective of the Study ... 9
1.3.2 Specific Objectives of the Study ... 9
1.4 Research Questions of the Study ... 9
1.5 Significance of the Study ... 10
1.6 Scope of the Study ... 10
1.7 Organization of the Study ... 11
CHAPTER TWO ... 12
LITERATURE REVIEW ... 12
2.1 Introduction ... 12
2.2 Theoretical Literature Review ... 12
2.2.1 Resource Based View Theory ... 12
2.2.2 Organisation Learning Theory ... 13
2.2.3 The Balanced Score Card... 15
2.3 Empirical Literature Review ... 16
2.3.1 Financial Resources and Performance ... 16
vi
2.3.3 Human Resources and Performance ... 20
2.4 Summary of Literature Review and Research Gaps ... 22
2.5 Conceptual Framework ... 28
CHAPTER THREE ... 30
RESEARCH METHODOLOGY ... 30
3.1 Introduction ... 30
3.2 Research Design... 30
3.3 Target Population ... 30
3.4 Sample Size and Sampling Procedure ... 31
3.5 Data Collection Instrument ... 32
3.5.1 Validity of Research Instrument ... 32
3.5.2 Reliability of Research Instrument ... 33
3.6 Data Collection Procedure ... 34
3.7 Data Analysis and Presentation ... 34
3.8 Ethical Considerations ... 36
CHAPTER FOUR ... 37
RESEARCH FINDINGS AND DISCUSSION ... 37
4.1 Introduction ... 37
4.2 Analysis of Response Rate... 37
4.3 Background Information of the Respondents ... 38
4.2.1 Gender of the Respondents ... 39
4.2.2 Management Level... 39
4.2.3 Academic Qualification ... 39
4.2.4 Duration Worked in the Microfinance Institution ... 39
4.4 Descriptive statistics ... 40
4.4.1 Descriptive Statistics for Financial Resources ... 40
4.4.2 Descriptive Statistics for Physical Resources ... 43
4.4.3 Descriptive Statistics for Human Resources ... 45
4.4.4 Descriptive Statistics for Performance... 47
4.5 Inferential Analysis ... 48
4.5.1 Correlation Analysis ... 48
4.5.2 Regression Analysis ... 49
vii
4.6.1 Financial Resources and Performance ... 51
4.6.2 Physical Resources and Performance ... 52
4.6.3 Human Resources and Performance ... 53
4.6.4 Performance of Microfinance Institution ... 54
CHAPTER FIVE ... 55
SUMMARY, CONCLUSION AND RECOMMENDATIONS ... 55
5.1 Introduction ... 55
5.2 Summary ... 55
5.3 Conclusion ... 56
5.4 Recommendations for Policy and Practice ... 57
5.5 Limitations of the Study... 58
5.6 Suggestions for Further Studies ... 59
REFERENCES ... 60
APPENDICES ... 68
Appendix I: Introduction Letter ... 68
Appendix II: Research Questionnaire ... 69
Appendix III: List of Registered Credit Only Microfinance Institutions ... 76
Appendix IV: Approval of Research Project Proposal ... 77
Appendix V: Research Authorization from the Kenyatta University ... 78
Appendix VI: Research Authorization ... 79
viii
LIST OF TABLES
Table 2.1: Summary of Literature Review and Research Gaps ... 23
Table 3.1: Target population ... 30
Table 3.2: Sampling Frame ... 31
Table 3. 3: Reliability Results ... 33
Table 4.1: Gender of the Respondent ... 38
Table 4.2: Descriptive Statistics on Financial Resources ... 41
Table 4.3: Descriptive Statistics on Physical Resources ... 44
Table 4.4: Descriptive Statistics on Human Resources ... 46
Table 4.5: Descriptive Statistics for Performance ... 47
Table 4.6: Correlations Analysis... 48
Table 4.7: Model Summary ... 49
Table 4.8: ANOVAa ... 50
ix
LIST OF FIGURES
x
OPERATIONAL DEFINITION OF TERMS
Financial Resources: Monetary resources available to a business for spending in the form of shareholders’ equity, loan accessibility, cash and cash equivalents and liquid securities.
Human Resources: People who make up the workforce of an organization Microfinance Institutions: Financial organization that offers financial services to
low income earner such as loans, insurance, deposit and other services to their members.
Credit Only Microfinance Institutions: Micro finance institutions that are by law not allowed to accept deposits from members of the public. Performance: Outputs or results of an organization as measured in
terms of efficiency, market share, customer satisfaction, retention rate and turnover against its intended goals and objectives.
Physical Resources: Tangible facilities that can be seen felt or moved and including computers, equipment, tools, inventories, storage, and distribution facilities.
xi
ABBREVIATIONS AND ACRONYMS AMFI : Association of Microfinance Institutions
ASCAs : Accumulated Savings and Credit Associations
BSC : Balanced Score Card
CBK : Central Bank of Kenya
DEO : District Education Officer
DTMs : Deposit-Taking Microfinance Institutions IIF : Institute of International Finance
KCSE : Kenya Certificate of Secondary Education KNH : Kenyatta National Hospital
K-REP : Kenya Rural Enterprise Programme
KWFT : Kenya Women Microfinance Trust
MFIs : Microfinance Institutions
NACOSTI : National Commission for Science, Technology and Innovation RBV : Resource-Based View
ROSCAs : Rotating Savings and Credit Associations
SACCOs : Savings and Credit Cooperatives
xii ABSTRACT
1
CHAPTER ONE INTRODUCTION 1.1 Background of the Study
The Institute of International Finance (IIF) reported that the global financial sector performed well until the emergence of the 2008 financial crisis which crippled the sector resulting in reduced profitability and stability in the sector (IIF, 2014). Following the crisis, most countries were forced to tighten their regulatory framework especially on risk management in terms of identification and mitigation. In addition, this sector is affected by various environmental factors, both external and internal, but the external factors categorized under political, technological, social and economic factors have had the greatest impact (Boon, Eckardt & Boselie, 2017). Nonetheless, the financial sector in developed markets has experienced significant growth due to factors such as stiff regulatory regimes and deleveraging which calls for higher core capital for the financial institutions (Lonial & Carter, 2015).
In the emerging markets such India, Mexico, Nigeria and other developing African countries, financial penetration is relatively low at less than 4 percent and continue to deteriorate with increase in population. However, banking concentration and growth is still positive fuelled by infrastructure-spending emergence and growth of the middle class in developing nations (Grant, 2016). Microfinance Institutions (MFIs) in developing countries, like in developed countries, have also experienced unstable performance trends. For instance, in 2010, MFIs in Pakistan experienced low repayment rates as a result of country wide floods. In Nigeria, the many non-performing loans that led to high portfolio at risk negatively affected the country’s undercapitalization and capital in 2005. Similarly, in Bosinia, the sector was negatively affected in the year 2009 due to the clients that had not paid their debts and also because of to the financial crisis that affected the globe in the same year (Tambiah & Geake, 2011).
2
Institutions in Kenya is characterised by low levels of efficiency and high financial leverage level which negatively affect their return on shareholders’ equity. Further, Mulunga (2010) noted that some Microfinance firms fail to adequately manage their financial resources meant for their financial needs in the future this results to liquidity problems.
There is therefore need for financial intuitions and particularly Microfinance Institutions must identify strategic resources for their survival. Barney (1986) noted that for firms to compete effectively they need resources that when properly combined that can allow them to have an advantage through the creation of value that competitors find hard to have the same value. According to Barney there are resources including technology, natural resources and economies of scale that are key in developing competitive advantage (Sirmon, Hitt, Ireland & Gilbert, 2011). However, these resources which are majorly tangible are no longer tenable in creating competitive advantage since they have become increasingly available to all and easy to imitate (Porter, 2011).
1.1.1 Organisation Performance
3
institutions are forced to identify a certain niche in the market and focus on them through maximising their utility (Schilke, 2014).
Schechner (2017) views organisational performance as how effective the firm meets its goals. On the other hand, according to Luo, Gnyawali and Bu (2016), in the past evidence of behaviours and decisions was performance, current strategic behaviours that affect current and future outcomes and performance is also proof of decisions and behaviours that are made in real time that seek to improve the firm capabilities in the future. It is therefore imperative that every single organisation bring forth suitable ways of attaining intended performance points along with appropriate performance assessment measures. In assessing their performance organisations must therefore consider key performance indicators (Parmenter, 2015). The indicators of performance are often chosen harmoniously with the firm’s objectives, strategies and framework. The indicators taken up by the firm are essential, as they are the determining factors of the firm’s performance. The indicators are either financial or non-financial performance indicators (Lonial & Carter, 2015).
Spanos and Lioukas (2001) conceptualised performance in form of different firm ratios including return on sales, return on investment, return on equity, return on assets, stock price, earnings per share, profit margin and sales growth. Share position and market share of the firm make up operational indicators. Ogot (2014) points out that the performance of the organization is made up of both operational and financial indicators in agreement with Venkatraman and Ramanujam (1986). López-Gamero, Claver-Cortes and Molina-Azorin (2009) define performance as subjective approaches where firms rate their performance using a Likert-type scale against different measurers compared to their competitors. The factors used to compare this performance include factors such as progression in employment, sales, market share, return on investment, cash flow and profits before tax (Lu, 2016). This study adopted non-financial indicators such as market share, efficiency of resource utilization, customer satisfaction, and retention rate.
1.1.2 Organisation Resources
4
sources of competitive advantage and more specifically firm resources (Ndofor, Sirmon & He, 2011). The firm’s competitive advantage source has moved to intangibles like the organisation’s knowledge base and the know-hows on utilising and developing it from tangible resources and the ability to deploy them (Boon, Eckardt & Boselie, 2017). Barney (2014) eluded that most of the value of a company based on intellectual assets and that majorly global wealth is not tangible (Ferreira and Hamilton, 2010).
As outlined by Wernerfelt (1984), Rumelt (1984) and Barney (1986), the resource-based view (RBV) posits that resources provide competitive advantage to its organisation when they are rare, valuable, non-substitutable and inimitable (VRIN). Barney (1991) had earlier argued that for resources to help a firm achieve a competitive advantage against its competitors it must be rare, valuable, non-substitutable and hard to imitate. Njoroge (2014) too also agreed that for such resources to lead to sustainable advantage, they must be inimitable, valuable, rare and lack substitutes. Based on this proposition Andersén (2011) concluded that there are three strategic resources that a firm must possess which include financial resources, intellectual property and human capital. On the other hand, Henderson (2016) outlined five basic strategic resources that a firm must possess. Such resources are human, financial, emotional, physical and educational resources. Though developed independently, these two models agree on financial resources, intellectual property and human capital as sources of competitive advantage. This study operationalized organisation resources into financial, physical resources and human capital.
Karltorp (2016) outlined financial resources to include cash, liquid securities and credit lines available to a business for meeting the daily needs of the firm. Earlier Barney and Clark (2007) indicated that financial resources could also be in form of equity, debt, retained earnings and other cash equivalents that are accessible to the firm to finance its activities. Financial resource are made up of both internal and external sources of income. Financial resources also include cash balances, bank overdraft, debt capital, and owner equity, working capital (such as inventories and debtors) as well as creditors (suppliers).
5
usually valuable and are used in the operation of the organization to facilitate the delivery of the service to customers. Physical resources can be in form of storage, assembly, distribution, production facilities and manufacturing tools and equipment (Beaugency, Sakinç& Talbot, 2015). In this study physical resources included land and buildings, enough workspace, computer network, marketing resources and relevant capacity.
Belcourt and McBey (2016) viewed human resource as the resources that have to do with people’s skills, knowledge and motivation. For this reason, human resources are not as mobile as the other resources mentioned above and human resources get better with experience and age. This is an attribute that is absent in the other resources. Thus, human resource is seen as the scarcest and rarest and which can lead to the best or the worst performance in the firm. Further, Sirmon, Hitt, Ireland and Gilbert (2011) in their study outlined the human resources to be made up of knowledge, experience, and wisdom of employees, risk taking and judgement of the staff at the firm. Wasike (2012) observed that human resources are a vital basis of competitive advantage in an organization compared to technology or capital access. In this study human capital was measured using years of knowledge and skills, work experience, training and development and personal judgment.
1.1.3 Credit Only Microfinance Institutions in Kenya
It is noted that only 19% of the population made up of adult Kenyans do seek financial
services from financial organizations such as building societies, post office savings bank
and commercial banks (Rukaria, Mukulu and Sakwa, 2014). On the other hand, financial organisations which are unregulated by the central bank such as SACCOs serve 8% of the
population seeking financial services. The result is that the percentage of adults that are
able to access financial services from formal regulated and unregulated financial firms is
27%. The remaining 35% of the population gets its financial services from non-formal
institutions like Accumulated Savings and Credit Associations (ASCAs), Rotating Savings,
and Credit Associations (ROSCAs) (AMFI, 2017). 38% of the adult population in Kenya
do not seek financial services anywhere. It therefore follows that the total population that
is unbanked total about 73% representing those who do not seeks financial services
6
In Kenya, the microfinance sector emerged in the 1980s, and among the first institutions to
offer microcredit was the National Council of Churches of Kenya (SMEP) and K-Rep.
However, before the enactment of Microfinance Act of 2006, the Microfinance Regulations
for Deposit Taking MFIs act of 2008 as well as and in 2013 amendments allowing
deposit-taking institutions to be referred to as Microfinance Banks, these Microfinance Institutions
operated without a proper regulatory framework (Kibet & Wagacha, 2018). For instance,
they could not mobilize public deposits for on-lending, yet their sources of funds continued
to dwindle while the demand for credit and other financial services continued increasing.
Besides, MFIs continued to face pressure from their donors to become self-sustaining. This
led to the need to commercialisation of microfinance where willing Microfinance
Institutions transform into commercial banks. For instance, the Kenya Rural Enterprise
Programme (K-Rep) transformed into K-Rep Bank which occurred in the absence of a legal
framework for the regulation and supervision of MFIs (CBK, 2018).
After these acts were enacted, Kenya experienced a rapid growth of the Microfinance
Institutions. The micro institutions in Kenya had grown to 24 by 2010 which gave more
than 1.5 million borrowers over 1.5 trillion of finance. Currently, over 1000 institutions
practice micro-lending. Many Microfinance Institutions have replicated the model of
providing financial services to those living under low income (Omino, 2015). Out of the
1000 institutions, there are 64 deposit taking Microfinance Institutions that serve over 6.1
million clients with assets worth more than Ksh. 325 billion. Among them, Equity Bank
had the largest market share of approximately 73.50% closely followed by Kenya Women
Microfinance Bank (KWFT) with 12.06%. Others are K-Rep, now Sidian Bank, with
6.39%, Faulu (3.56%) and Jamii Bora (0.86%) (CBK, 2018).
The Association of Microfinance Institutions (AMFI) is the body that is mandated with
controlling micro finance institutions in Kenya. This body has both large and small MFIs
as members. These members have a diverse legal status including insurance firms,
development firms, microfinance banks, retail and wholesale MFIs. The membership of the
AMFI ios currently made up of 55 institutions serving more than 6.5 million customers and
these institutions have an outstanding loan portfolio of Kshs 29 billion (AMFI, 2012).
These institutions play an essential role in the achievement of vision 2030 goal of financial
inclusion whereby this goal seeks to reduce the population that cannot access financial
7 1.2 Statement of the Problem
The enforcement of the Microfinance Act in 2006 steered the supervision and regulation of deposit-taking Microfinance Institutions (DTMs), effectively spurring growth in the sector. This growth has brought a lot of challenges such as competition resulting from standardized products, political instability, corruption, lack of transparency and inadequate infrastructure. These challenges have adversely affected the performance of these Credit Only Microfinance Institutions forcing them to identify and adopt strategies that would enable them gain competitive advantage and superior performance. According to Boon, Eckardt and Boselie (2017) the traditional competitive strategies are no longer tenable due to their lack of peculiarity making them imitable. For this reason, Credit Only Microfinance Institutions must identify other sources of competitive advantage such as organisation resources. Barney (2014) stated that organisation resources form a formidable advantage to competing firms since they help them gain competitive advantage.
There are various studies that have been done on organisation performance such as Waiganjo and Awino 2012 conducted a study on strategic human resource management and corporate performance and found that as firm can achieve a sustainable competitive advantage from its human capital by strategic management of human resource in way that meets the organisation needs. However, this study only concentrated on strategic human resource ignoring other organisation resources. Omondi and Muturi (2013) focused on the use of strategic human resource management practices in commercial banks and concluded that commercial banks adopt differentiated strategic HR strategies to beat their competition.
8
relationship existed amongst the investigated SHRM practices and business performance. It however focussed on SHRM strategies and therefore did not show the effect of human resources on performance.
Otoo (2013) sought to establish the effect of financial innovations on the financial performance of Kenyan commercial banks and concluded that the development of financial innovations had no significant relationship with the Kenyan commercial banks financial performance. Omar (2017) sought to establish the influence of financial management practices on the growth of family businesses in Kenya and concluded that financial management practices influence growth of family businesses in Kenya. Siano, Kitchen and Giovanna (2010) focussed on convergent elements between corporate reputation and financial resources and noted that there exist differences and similarities when it came to the risks and functions existing between financial resources and corporate reputation. The study was however theoretical in nature and lacked empirical backing as no statistical tests were conducted.
In addition, Mong'are (2012) assessed the impact of management of physical resources on KCSE performance in public secondary schools in Kisii Central District, Kenya. The study established that there was need for school managers to be taught innovative strategies that would help in the maintenance, use and acquisition of material and physical resources. However, this study was conducted in the education sector. Ndung’u (2014) conducted a study provision, availability and effective use of physical education facilities, equipment and teaching and learning material in primary schools in Starehe District, Nairobi City County. The study settled that most of the schools did not commit adequate resources in their annual budgets for development physical education resources and facilities. Finally, Obinga, Waita and Mbugi (2017) did a study to investigate the relationship existing between the internal efficiency and physical resources of public secondary schools in TanaRiver County. According to the findings, there was a positive correlation between physical resources and the public schools internal efficiency.
9
noted that most studies on performance concentrated on financial performance while this study focussed on nonfinancial performance. In addition, the studies have not shown the relationship that exists between organisation resources and performance of Credit Only Microfinance Institutions. This study sought to establish the effect of organisation resources on performance of Credit Only Microfinance Institutions in Nairobi City County, Kenya.
1.3 Research Objectives of the Study 1.3.1 General Objective of the Study
This research was guided by the general objective of investigating the effect of organisation resources on performance of Credit Only Microfinance Institutions in Nairobi City County, Kenya.
1.3.2 Specific Objectives of the Study The specific objectives of the study were;
i. To determine the effect of financial resources on performance of Credit Only Microfinance Institutions in Nairobi City County, Kenya.
ii. To establish the effect of physical resources on performance of Credit Only Microfinance Institutions in Nairobi City County, Kenya.
iii. To evaluate the effect of human resources on performance of Credit Only Microfinance Institutions in Nairobi City County, Kenya.
1.4 Research Questions of the Study
The study was steered by the following research questions;
i. What is the effect of financial resources on performance of Credit Only Microfinance Institutions in Nairobi City County, Kenya?
ii. To what extent do physical resources affect performance of Credit Only Microfinance Institutions in Nairobi City County, Kenya?
10 1.5 Significance of the Study
The current research findings will be of great relevance to a number of users. The Microfinance Institutions management will benefit from this study as it will give insight into the relationship that exists between organisation resources and performance of their institutions. The findings of this study will therefore be relevant for Credit Only Microfinance Institutions to enable them formulate policies that would propel the performance of firms.
The management of other financial institutions that have similar characteristics will also find the results of this study relevant because they can replicate the findings of the study in their circumstances. They will therefore identify resources that will give them better performance.
The government and its agencies and more specifically the Association of Microfinance Institutions will reap great benefits from the outcomes of this study as the study will identify organisation resources that are required for Microfinance Institutions to thrive. They may therefore come up with policies on the resources that their members should have for them to operate profitably.
The AMFI can also make use of this research findings to petition the legislature to pass laws that will require certain resources to be present before microfinance is established. This would ensure that, all factors held constant, Microfinance Institutions operate profitably.
The findings of this research will be a great contribution to the existing knowledge in the construct of organisation resources and performance. Scholars and practitioners will benefit from the study as it will provide the missing linkage between organisation resources and performance among the Credit Only Microfinance Institutions in Kenya. Other researchers will use this study to identify conceptual, empirical and contextual gaps in their study and thus advance research on the study constructs.
1.6 Scope of the Study
11
County, Kenya. Credit Only Microfinance Institutions in Nairobi County was selected because they operate in a very dynamic environment coupled with intensive competition. The research sought to establish the effect of financial resources, physical resources, human resources on performance of Credit Only Microfinance Institutions in Nairobi City County, Kenya. The research unit of analysis was the Credit Only Microfinance Institutions in Nairobi City County, Kenya while the research unit of observation was the top, middle and lower level management in these Credit Only Microfinance Institutions. The research needed data was collected for duration of 5 years from 2013 to 2017. This duration was ideal since it was within this duration that there was mushrooming of many Credit Only Microfinance Institutions in Kenya most of which are headquartered in Nairobi.
1.7 Organization of the Study
12
CHAPTER TWO LITERATURE REVIEW 2.1 Introduction
The current chapter gives a review of relevant literature on the study variables. In particular the chapter is structured into theoretical literature review, empirical review, summary of research gap and the conceptual framework.
2.2 Theoretical Literature Review
This study is based on the resource-based view theory, organisation learning theory and the Balanced Score Card Model.
2.2.1 Resource Based View Theory
This model is recognized as a popular theory of competitive advantage. Wernerfelt coined this mode in 1984. According to his argument, the key contribution of the resource-based model to the organization has been to achieve competitive advantage. However, Selznick (1957) had earlier pointed out that every firm has its own distinct characteristics that allow it to be better than its competitors. Around the same time, Penrose (1959) defined a firm as being made up of more than one productive resources. These definitions point towards the importance of resources to the firm’s performance. According to the theory of resource-based view in the field of strategic management, the factors that allow firms to outperform its competitors are to do with the firms capabilities and resources that are hard to imitate and those that bring value to the firm (Rau, 2014).
13
firm comes up with strategies that can help it achieve a competitive advantage over other firms in the industry and achieve greater performance.
The resources of the firm can be categorized into tangible and intangible resources. Tangible resources include resources such as human, physical, financial and technological resources. On the other hand, intangible resources include resources such as know-how, reputation and brand (Hitt, Carnes & Xu, 2016). Tangible resources can lead to a competitive advantage on the firm but their disadvantage is that they can be accessed by other organizations and they are also cheap to imitate when compared to intangible resources. This theory therefore argues that superior performance is driven by firm resources and capabilities owned and controlled by the firm. Smith(2007) points out that the organizations RBV helps to make better the firms Strength, weakness opportunity and threats (SWOT) analysis by looking at the various firms capabilities and resources and investigating the basis on which they can be used to achieve superior performance. Building on the works of earlier scholars, Kozlenkova, Samaha and Palmatier (2014) posits that on their own, firm resources are unproductive and thus require capabilities for them to perform some task.
Further, Barney (2014) suggests that firms should identify types of resources which can lead to high profits. This implies that for a firm to earn high returns, it must possess both resource position barriers and entry barriers. This study proposes that resources owned by a firm can be configured to improve a firm's performance. The RBV model is found useful for this research since it focuses on the ability of the firm resources to generate better performance for the firm. For this reason, the theory was used to support financial, physical as well as the human capital variables as outlined in this study. 2.2.2 Organisation Learning Theory
14
been identified to include continuous improvement, management of knowledge, the culture of the firm, system and processes of the firm and individual learning (Clegg, Kornberger & Pitsis, 2015).
The knowledge connection spiral shows the existing connection between the person and the firms learning. According to Argote and Miron-Spektor (2011), the firms knowledge is changed from the individual knowledge by conversion of the individuals experience and knowledge into knowledge that is recorded with the groups and the firms processes refining, integrating, testing and institutionalizing this knowledge (Liao & Wu, 2010). There is the need for the firm’s management processes that seeks to improve the knowledge in the firm to make sure they involve the learning of the individual.
15
Siemens (2014) notes that the firm knowledge can be used as the basis of knowledge creation and accumulation and as a reflection of how well a firm can take in knowledge. More so the recognition, storage and formalization of knowledge is only useful if the firm acknowledges that this knowledge can be used to find solutions to new challenges. Management should therefore come up with a learning environment where there is interaction and building of each of the individual’s knowhow.
This theory was used to support human resources based on its constructs of management of knowledge, culture, systems or processes, continuous improvement and collectively of individual learning. This study recognises that for human capital to help an organisation to gain superior performance, it must be valuable, rare, inimitable and non-substitutable. In this sense organisational values and competencies which are collectively shared may be transferred to other employees in the company through the learning process and continuous improvement. Additionally, this theory views the firm as a system which interacts with the environment and therefore there is exchange of knowledge both within and outside of the organisation.
2.2.3 The Balanced Score Card
Kaplan & Norton (1992) came up with the Balanced Score Card. The BSC is a performance measurement tool that converts strategy to performance measures aligned to the strategy. The BSC has four performance measures of financial, customer, learning, growth and internal processes (Kaplan & Norton, 1992). The financial perspective of the BSC tool provides for the firm to succeed financially it should meet the demands of the owners (shareholders) through delivery of measurable like the financial ratios, customer share and other measurable cash flow measures (Kaplan, Norton & Rugelsjoen, 2010). This perspective is what had been used widely to measure a firm’s performance previously and therefore needed to be balanced with other perspectives.
16
(Tayler, 2010). The internal perspective targets to satisfy the shareholders and customers by ensuring that the firm chooses the right business policies and processes that would deliver their unique demands to customers (Niven, 2011). The internal business policies are often classified as mission oriented that focus on organization overall mission processes and support oriented that focuses on repetitive tasks employees carry out in course of their work. This perspective also ensures that the length of time spent prospecting and the amount of rework required is minimized (Hoque, 2014).
The learning and growth perspective prescribes that the firm should achieve its vision and be able to sustain its ability to change (Northcott & Ma'amora, 2012). It guides the organization on where to focus its training funds. The concentration is on employee training to improve performance. Also, this perspective ensures creation and maintenance of corporate culture attitudes that would result in achievement of the vision through its strategy. In line with the constructs of the model, this study finds it relevant since the performance of Credit Only Microfinance Institutions to be measured equitably, there is need to consider financial, customers, and internal perspective as well as learning and growth perspectives. Based on the variables of the study, exclusion criteria was used by focussing on the non-financial measures of performance that is customers, internal processes, learning and growth perspectives.
2.3 Empirical Literature Review
This section contains a review of studies previously conducted among the study variables aimed at identifying the gaps that exist.
2.3.1 Financial Resources and Performance
17
Carrick (2012) conducted a study aimed at unearthing insights on the motivations, assets and processes that lead to the development of Research and Development (R&D) and financial resources and capabilities. To achieve this objective, the study adopted a case study method. The study used secondary data as well as primary data collected from twenty interviews. Analysis was carried out using multiple step abstraction and condensing process. Findings from the research showed that that a set of routines, capabilities, assets, decisions, future opportunities led to the development of financial resources, R&D and financial capabilities. Basis of the research was life science ventures in the United Kingdom whose operating environment is significantly different from that of Credit Only Microfinance Institutions in Kenya.
Otoo (2013) looked at the effect of financial innovations on the financial performance of Kenyan commercial banks. The researcher employed the descriptive survey research design. The study population consisted of 43 commercial banks in Kenya from which a sample of 30 commercial banks were used in the multi stage sampling technique. Primary data was collected using questionnaires while secondary data was acquired from researched work and articles, economic surveys CBK annual report and library. The main outcomes were that the development and the challenges of financial innovations had no significant relationship with the Kenyan commercial banks performance but a significant relationship did exist between the performance and financial innovation of the banks. This research was done using the Kenyan commercial banks. The current research was done on Credit Only Microfinance Institutions in Nairobi City County, Kenya.
18
assets. However, findings revealed there was a positive effect on return on equity by the above factors. Combined the study revealed that the financial structure of the firm had a negative and positive effect on return on assets and return on equity respectively. Though the results of the study shed light on the relationship that exist between financial resources and firm performance, the study concentrated on how the combination of the sources of finance affect performance. This implies that study did not focus on the finances as organisation resources in themselves but rather how the various combinations of their sources affect performance. In addition, the study was conducted among listed firms while the Credit Only Microfinance Institutions under study are not listed.
Omar (2017) sought to establish the influence of financial management practices on the growth of family businesses in Kenya. The study adopted a mixed research approach with the target population of the target population comprising of 48,187 registered family businesses across different business sectors in the County. Stratified sampling technique was used to select a sample size of 397 respondents. The research relied on both secondary data and primary data with the latter collected using self-administered questionnaires. Further, descriptive statistics and Multi linear regression were used in data. The study results indicated that financial management practices had a positive and significant effect on the growth of family business regarding revenues and change in net-worth. However, this study focused on practices adopted by family businesses in growing their businesses but did not establish how these resources affect their performance. Secondly, the study concentrated on family businesses which have different ownership structures and capacity to raise finances, which implies that the findings of the study may not be applicable Credit Only Microfinance Institutions in Kenya.
2.3.2 Physical Resources and Performance
19
relationship did exist between the performance of the pupils and the effective use of the school’s physical resources. Nevertheless, this study was based in a school setup, which is a non-profit-making government supported and therefore significantly different from Credit Only Microfinance Institutions.
Mong'are (2012) assessed the impact of management of physical resources on KCSE performance in public secondary schools in the Kenyan Kisii Central District. The study results indicated that there was congestion in regard to the use of the school facilities as there was not enough funding. The schools also suffered from minimal student to teacher interaction, inadequate learning and teaching materials and a poor learning environment. All these factors negatively affected performance. The study also found out that practical oriented subjects were worst affected considering that they are resource intensive. Although this study brings out the role of physical resources, the study did not show the relationship that exists between physical resources and performance. Secondly, this study was done in the education sector and thus its results might not apply to the Credit Only Microfinance Institutions.
Obinga (2014) did investigate the relationship between physical resources and internal efficiency of public secondary schools in Tana river County, Kenya. The study made use of correlation research and descriptive survey methods. The data for this research was collected by use of documentary analysis, questionnaires and interview guide. The data was from 15 secondary schools from the named county. Participants of the study were made up of a county Director of education, 3 District education officers, 30 teachers and 15 principals. The teachers were randomly selected while the principles were selected purposively from the target population. Both quantitative and qualitative measures were used for data analysis. According to the conclusions of the research there was a positive correlation between the physical resources and the internal efficiency of public secondary schools in TanaRiver County. The study was however done in the educational sector while the current research was done in the financial sector.
20
teachers and 40 heads of institutions. A sample size of 126 respondents representing 42% of the population was purposively selected for the study. Data was analysed using both qualitative and quantitative data methods. The study results showed that many of the studied schools did not use adequate resources in their annual budgets for development of P.E resources and facilities. This study though conducted in Nairobi region was conducted in only one constituency while the current study was conducted in the whole of Nairobi region. Moreover, the study was done in a different contextual set up.
2.3.3 Human Resources and Performance
Kiai (2007) sought to investigate how the Kenyan insurance companies have adopted the strategic human resource management practices. The researcher used a descriptive survey design and the research data was collected by use of a semi-structured questionnaire. Descriptive statistics was sought for the analysis and presentation of the findings. The presentation was done in form of pie charts and tables. The study concluded that Kenyan insurance firms have not fully adopted the practices of Strategic Human Resource Management. This study only sought to determine if the insurance companies adopted SHRM practices but did not show the relationship between SHR and performance. In addition, although the study was conducted in the financial sector, the study was done on insurance companies while the current research was done on the microfinance sector.
21
the hiring process including the delay of data from line managers that was needed for recruitment for various sections. Prominent people solicit for positions resulting to a selection processes that are not fair. This study established the challenges faced by human resource management function but did not show how the human resource management affect firm performance. Secondly, this research was done in the health sector while the current research was in the financial sector.
Ngui (2015) studied the effect of human resource management strategies on performance of Kenyan commercial banks. The research made use of the survey method to collect data. The research population was made up of 46 banks and 2,738 staff members. The researcher purposively sampled the head office of each bank that was located in Nairobi. A stratified random sampling method was used to get a sample of 349 members of staff. Interviews and questionnaires were used to collect the needed data for the research. The data from the questionnaires and interviews was analysed using descriptive statistics that included correlation and regression analysis, percentages and averages. According to the findings of the research there was a positive relationship between the performance of employees and strategic human resource management in Kenyan commercial banks. This study focused on human resource management strategies but did not determine how human resource affected the firm performance. Additionally, this research was done in established banks while the current research focus was on Microfinance Institution.
22
practices used in the management of human resource and how these practices affected the retention of employees. The current research was based on the effect of individual resources on performance. The former study was done in the health sector while the current research focus was in the financial sector.
Muriithi, (2016) studied the role of human resource management in cultural integration process among selected post-merged Kenyan commercial Banks. The study adopted a positivist philosophy on the mixed framework of research design comprising of descriptive, exploratory, and quantitative designs. The target population comprised of the 5998 employees of the acquired or merged organization from which a random sample of 361 employees. Both primary and secondary data was utilised. Logistic Regression model was used to establish the relationship between human resource management and cultural integration process and the strength of the relationship. The study concluded that recruitment and selection affect cultural integration if the practices are well governed and executed they affect cultural integration positively. However, this study focused on human resource management in cultural integration process bat did not show on the effect of human resource management on performance.
2.4 Summary of Literature Review and Research Gaps
In summary, this study has found that a number of studies have been done on performance. In deed there exist studies on financial resources such as Siano, Kitchen and Giovanna (2010) and Carrick (2012). However, these studies have not shown the direct link between strategic financial resources and performance. This study has also noted that researchers in Kenya have shied away from the concept of financial resources and instead concentrated on financial management strategies (Omar, 2017), financial structure (Mwangi, 2016) and financial innovations (Otoo, 2013).
23
and empirical gaps since no study has been conducted on organisation resources and performance of microfinance institutions in Kenya.
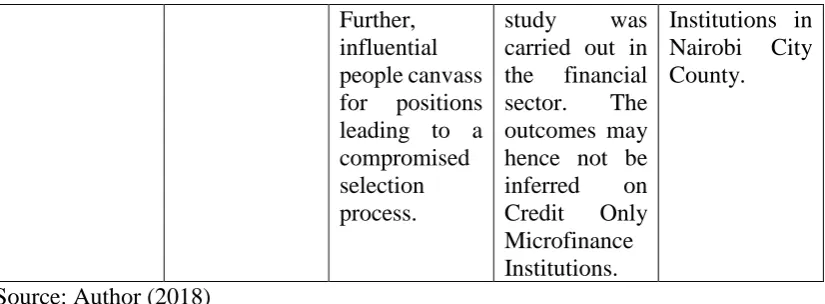
The summary of the research gaps is summarised in Table 2.1. Table2.1: Summary of Literature Review and Research Gaps
Author Purpose of
the study
Findings Research Gap Focus of the current study Omar (2017) The influence
of financial management practices on the growth of family
businesses in Kenya.
Financial management practices had significant and positive
influence on the growth of family
businesses in terms of revenues and change in net-worth
This study focused on practices adopted by family
businesses in growing their businesses but
did not
establish how these
resources affect their performance. Secondly, the study
concentrated on family businesses which have different ownership structures and capacity to raise finances
The study focussed on financial resources and not their management strategies. The study was conducted among Credit Only
Microfinance Institutions and not family owned
businesses.
Mwangi (2016)
Financial structure and performance of firms listed at East Africa Securities Exchange.
The research findings were that equity, long term debt, isolation and short term debt had
insignificant negative effect on return on assets but
This study focused more on the effect of financial structure on performance. In addition, the study was conducted on firms listed in
The current study was conducted on firms
24 insignificant positive effect on return on equity.
The findings was that financial structure positively and negatively affected return on equity and return on assets
respectively.
the east African
security
exchange and not on Credit Only
Microfinance Institutions.
Otoo (2013) The effect of financial innovations on the financial performance of commercial banks in Kenya.
The
development
and the
challenges of financial innovations
had no
significant relationship with the performance of commercial banks.
The research focus was on financial development and financial innovations as determinant of performance only ignoring physical factors.
This study was conducted among commercial banks which often have more capacity and resources than Credit Only
Microfinance Institutions.
The current study sought to investigate how financial resources affected non-financial performance of Credit Only Microfinance Institutions in Nairobi City County, Kenya.
Siano, Kitchen and Giovanna (2010)
Convergent elements between corporate reputation and financial resources
There exist similarities in the risks and functions between financial resources and reputation of
This study was theoretical in nature and therefore lacks empirical backing since no statistical
25 the
corporation
tests were conducted. The review was conducted
in the
developed countries
of Credit Only Microfinance Institutions in Nairobi City County, Kenya.
Ndungu (2014) Provision, availability, and effective use of physical education facilities, equipment and teaching and learning materials in primary
schools in Starehe
District, Nairobi City County, Kenya
The study concluded that most of the schools did not commit
adequate resources in their annual budgets for development
of P.E
resources and facilities.
The study sought to establish availability and provision of physical resources for physical education. The study therefore focused on only one resource ignoring other form of firm resources. In addition, the research focus
was on
learning institutions and the results cannot be generalized to Credit Only Microfinance Institutions.
The current research determined how physical resources affects performance of Credit Only Microfinance Institutions. In addition, the study will seek to establish the effect of financial and human
resources on performance.
Obinga (2014) Relationship between physical resources and internal
efficiency of public
secondary schools in Tana river County, Kenya
The findings conclusion was that there was a positive correlation between physical resources and internal
efficiency of public
secondary schools in
The focus of the study was
on the
education sector which means the findings may not be inferred on Credit Only Microfinance Institutions.
The study was done in Credit Only
26 Tana river County
Mong'are (2012)
The impact of management of physical resources on KCSE
performance in public secondary schools in Kisii Central District, Kenya
The findings showed that the inadequate findings led to congestion,
lack of
learning and teaching materials, a poor learning environment, minimal teacher to student
interaction and inadequate coverage of the syllabus which affected performance
The study did not show the relationship that exists between physical resources and performance. This research was done in the education sector and thus its findings cannot be generalized to the Credit Only
Microfinance Institutions.
This study established the relationship between physical resources, financial, human
resources and performance of Credit Only Microfinance Institutions.
Ngui (2015) The effect of human
resource management strategies on performance of commercial banks in Kenya.
The findings of the research indicated that there is a positive relationship between strategic human resource management and employee performance among commercial banks in Kenya.
This study focused on human
resource management strategies but failed to determine the effect of the human
resource on performance.
This study showed the relationship between human
resource and performance of Credit Only Microfinance Institutions.
Kinyili (2015) The role of human
resource management practices on retention of staff in public health
institutions in
The findings showed that though the relationship was weak it was positive and significant between career advancement
This study only
concentrated on human resource management practices and its effect on employee
The current study
27 Machakos County, Kenya practices, remuneration practices, work-life balance practices environment management practices and retention.
retention. The research focus was on the health sector. the research
did not
consider other important resources such as physical and financial resources
Moreover, the study sought to determine the effect of financial and physical resources on performance. Bidmeshgipour (2012) Relationship between strategic human resource management practices and business performance
The study found that a strong
relationship between the investigated SHRM
practices and business performance
This study focused on strategic HR management strategies and therefore did not show the effect of the HR itself on performance. Other
organisational resources such as financial and physical resources were not
considered.
The study showed the relationship between HR and
performance of Credit Only Microfinance Institutions in Nairobi City County, Kenya.
Njau (2012) Challenges facing human resource management function at Kenyatta National Hospital.
The major challenges relate to policies and processes that curb
recruitment
such as
information delay from line managers on
requirements on
departmental staffing.
The study dwelt on challenges faced by HR function but failed to show the
relationship between HR and
performance. The study was a case study of KNH which is in the health sector while the current
The current research sought to determine the relationship between HR and
28 Further, influential people canvass for positions leading to a compromised selection process.
study was carried out in the financial sector. The outcomes may hence not be inferred on Credit Only Microfinance Institutions.
Institutions in Nairobi City County.
Source: Author (2018) 2.5 Conceptual Framework
This study has developed the following conceptual framework based on the reviewed literature.
Figure 2.1: Conceptual Framework Source: Author (2018)
Physical Resources • Land and buildings • Enough workspace • Computer network • Marketing resources • Relevant capacity Financial Resources • Shareholders’ equity • Loan accessibility
• Cash and cash equivalents • Liquid securities
Performance • Efficiency level • Market share • Retention rate • Net profit
• Loan repayment rate
Human Resources • Knowledge and skills • Work experience
• Training and development • Personal judgment
29
30
CHAPTER THREE RESEARCH METHODOLOGY 3.1 Introduction
The current chapter presents the research methodology that the researcher adopted in achieving the research objectives. This chapter covers the design of the research, the study’s target population, the sample size, the procedure used for sampling and data collection instruments, validity and reliability of the research instrument, data collection procedures, analysis of the data, presentation and finally the ethical considerations that the researcher considered.
3.2 Research Design
The current research used an explanatory and descriptive research designs. Descriptive research design helps in the investigation and focus on a given variable factor (Lewis, 2015). This method is analytical and pinpoints one variable factor or subject and describes it in detail. This design fitted the study of this nature since the researcher
investigated the effect of organisation resources on performance of Credit Only Microfinance Institutions in Nairobi City County, Kenya. In addition, the study used explanatory research design to investigate the effect and the cause of the relationship that exist among the study variables.
3.3 Target Population
The current research target population comprised of the management team of Credit Only Microfinance Institutions in Nairobi City County, Kenya. This population was selected because they are the most informed about the firm affairs and performance. This region has a total of 30 Credit Only Microfinance Institutions. The total population was presentedin table 3.1.
Table 3.1: Target population
Management level Frequency Percentage
Top level management 49 15.9
Middle level management 92 29.8
Lower level management 168 54.4
Total 309 100.0
31 3.4 Sample Size and Sampling Procedure
Sampling is the use of a few of the population members to provide the needed data for the study. The sample acts as the representative of the whole population and the researcher can then draw conclusions from the findings on this sample (Etikan, Musa & Alkassim, 2016). The size of the sample was taken as a representation of the population under study (Bryman& Bell, 2015). The population was first stratified into three management levels including lower level, middle level and top level of management. In each of the stratum the researcher used the simple random method to sample the researcher respondents. The sample was made of 171 respondents. This sample size was achieved by taking the population of 309 members using a 95% confidence level and an error of 0.05 using the stated formulae that is recommended by Kothari (2004).
Where; n = is the sample size,
N = the population size of 309 participants,
℮ = this is the accepted error of 0.05,
∂p = The populations standard deviation represented by 0.5 if not known,
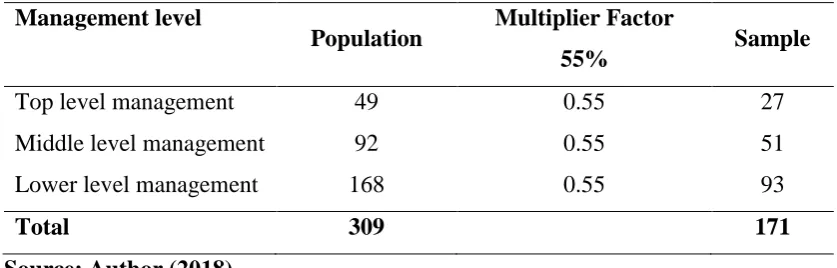
Z = this is the standard variation of 1.96 given at a confidence level of 95%. Table 3.2: Sampling Frame
Management level
Population Multiplier Factor
55% Sample
Top level management 49 0.55 27
Middle level management 92 0.55 51
Lower level management 168 0.55 93
Total 309 171
32
Stratified random sampling method was used in this research. This method of sampling is not biased and it groups heterogeneous population into homogenous subsets then individual subsets are chosen within this subset to allow for representativeness. As Mugenda and Mugenda (2003) notes, an adequate sample size is one that represents 10% of the whole population. However, as Kothari (2004) recommends such a sample should have a minimum of 30 members of the population. In the current research 55% of the top, middle and lower level, management was selected in each Credit Only Microfinance Institution in Nairobi City County, Kenya which was within the thresholds recommended (Mugenda & Mugenda, 2003; Kothari, 2004; Sekaran, 2011). 3.5 Data Collection Instrument
Both primary and secondary data helped in coming up with the research findings. The former data was collected by use of semi-administered questionnaires. These questionnaires were open and close ended or semi structured. As Saunders (2011) notes, the open-ended questions allowed the respondents to give profound answers while the close ended questions were easily evaluated by the researcher. The open-ended questions gave responses that are well structured that were easier to analyse and to draw conclusion from. The close-ended questions gave more information that may be missing in the open-ended questions.
The researcher administered the questionnaire to management staff of Credit Only
Microfinance Institution in Nairobi City County, Kenya. The questionnaire had two major sections. Section I provided demographic information while Section II provided data on study variables. The second section was sub-divided into four sub-sections with question regarding financial resources, physical resources, human resources and performance. Collection of secondary data was through document assessment from published records maintained by Credit Only Microfinance Institutions, AMFI Annual Reports, and other relevant financial and supervisory reports.
3.5.1 Validity of Research Instrument
33
validity. Face validity looked at the representation of the data collection instrument at face value and if it was a good instrument. It seeks to determine if the instrument covers what it should cover (Bryman & Bell, 2015). Content validity seeks inference from similar test that are drawn from similar items like those in the research. The researcher sought assistance from supervisor and other lecturers in the university to determine if the research instrument has both face and content validity.
The research instrument was found to be valid in that it covered all the constructs in the study accurately. The questionnaire was found to be representative of all the items that it was supposed to cover. Further question was found to measure all the variables in the study in line with the existing theoretical literature. In summary, the study concluded that the questionnaire was valid to collect the required data.
3.5.2 Reliability of Research Instrument
The study also conducted reliability test. The reliability of a research instrument sought to establish how well the instrument gives the same results on different instances when tested under the same conditions. It is how consistent it is in measuring what it was intended to measure (Tomioka, Iwamoto, Saeki & Okamoto, 2011). Cronbach’s alpha (α) was used to determine the current research instrument reliability. If the Cronbach alpha coefficient is at 0.6 or above, this was determined as adequate reliability (Field, 2009). In the current study, the researcher aimed for a 0.7 or above coefficient which was seen as adequate.
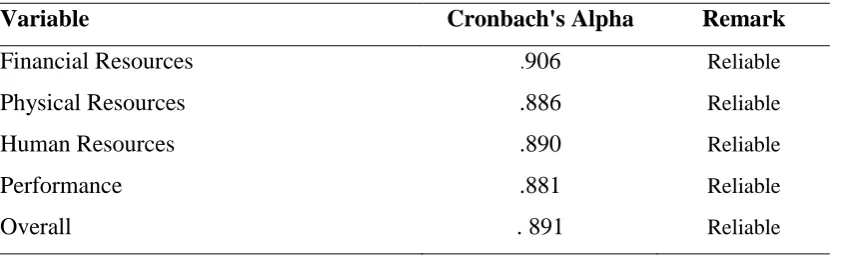
The results of the reliability test were presentedin Table 3.3. Table 3. 3: Reliability Results
Variable Cronbach's Alpha Remark
Financial Resources .906 Reliable
Physical Resources .886 Reliable
Human Resources .890 Reliable
Performance .881 Reliable
Overall . 891 Reliable
34
From the result shown in Table 3.3, the study found that financial resources had a Cronbach alpha coefficient of 0.906, physical resources had 0.886, human resources had 0.890 while performance had a coefficient of 0.881. Based on these observations, the study noted that the coefficients for all the constructs were greater than 0.7 and concluded that the questionnaire was reliable. In addition, the study found that the overall reliability coefficient was 0.891 which implied that in totality the questionnaire was reliable in measuring the study variables.
3.6 Data Collection Procedure
An introduction letter from the university was sought by the researcher. In addition, a research permit was obtained from the National Commission for Science, Technology and Innovation (NACOSTI). These two documents were given to the microfinance institution as a means of seeking permission to seek the needed data from the research respondents. The researcher dropped and picked the questionnaires to provide the respondents with ample time to answer the questionnaires questions. The researcher sought an appointment two days prior to visiting the institutions and the respondents gave out the questionnaires. The questionnaires were given to the respondents by the researcher.
3.7 Data Analysis and Presentation
The collected data was cleaned through coding editing and tabulation. This help in the pinpointing of any anomalies in the answers. Further, the researcher gave each of the responses some numerical values to allow for easier analysis. The researcher edited the data for consistency and completeness. The researcher further coded this data and checked for more emissions and errors as recommended by Sekaran and Bougie (2010). Statistical Package for Social Sciences (SPSS) Version 23 assisted in the analysis of this data. Quantitative data was analysed with the help of descriptive statistics methods including mean, frequencies and standard deviation. Tables and were used to present the results. The use of descriptive statistics is preferred as these methods allow for the meaningful description of the results by use of minimal indices (Marshall& Rossman, 2014).
35
data were sorted, organized, coded and analysed so as to come up with meaning, interpretations and conclusions. Multiple regression analysis and Pearson correlation coefficient was used as the choice methods for inferential data analysis. As pointed out by Csikszentmihalyi and Larson (2014), correlation methods are used to determine the association between two variables. The direction and strength of the relationship existing between the organization performance and its resources was determined by the help- of Pearson correlation coefficient. The assumption made during this analysis is that the data obtained from the study is normally distributed and continuous variables. The relationship between the dependent variable and independent variables was determined by use of multiple regression analysis. Multiple regression was preferred because it is the only known method that can use two or more independent variables to predict the existing independent variable. Following the recommendations of Darlington and Hayes (2016), the researcher sought the help of multiple regressions analysis to measure the effect of organisational resources on performance of Credit Only Microfinance Institutions in Nairobi City County, Kenya. Babbie (2015) points out that multiple regression tries to investigate if the group of independent variables do try to predict a given dependent variable. The study has three independent variables the multiple regression mode lused the below equation;
Y= β0 + β1X1 + β2X2 + β3X3 + €
Where: -Y= Performance of Credit Only Microfinance Institutions in Nairobi City County, Kenya
β0 =constant
β1, β2, β3 = Variable Coefficients