ABSTRACT
HUNTER, KEVIN. An Open Source Framework and Model for Energy Economy Optimization and (Uncertainty) Analysis. (Under the direction of Joseph DeCarolis.)
Energy economy optimization (EEO) models optimize consumption and/or energy supply over time in order to minimize the system-wide cost of energy or maximize social utility, subject to constraints representing physical limitations and public policy. While EEO model-based analyses are increasingly used to inform high-profile policy discussions, an extensive literature review reveals that most modeling teams withhold source code and data. The result is an inability for external observers to verify published model-based results, and as such, reviews of EEO model-based analysis are based largely on comparison to existing literature, domain expertise, and trust in the modeling team performing the work rather than hands-on experience. This thesis argues that EEO model code and input data should be freely and electronically shared, and provides six best practice recommendations to facilitate repeatable model analyses.
© Copyright 2012 by Kevin Hunter
An Open Source Framework and Model for Energy Economy Optimization and (Uncertainty) Analysis
by Kevin Hunter
A thesis submitted to the Graduate Faculty of North Carolina State University
in partial fulfillment of the requirements for the Degree of
Master of Science
Civil Engineering
Raleigh, North Carolina
2012
APPROVED BY:
Kumar Mahinthakumar Emily Zechman
BIOGRAPHY
Prior to enrolling at North Carolina State University, Kevin Hunter was a computer science, open source, and education advocate. His computing experience spans multiple subdisciplines, but focuses on parallel computation, relational databases, web technologies, and pedagogy. He is an avid believer in, and developer of, Free and Open Source Software (FOSS), and uses FOSS to great effect in his research at NCSU.
ACKNOWLEDGEMENTS
TABLE OF CONTENTS
List of Figures . . . vii
List of Tables . . . .viii
Chapter 1 The Case for Repeatable Analysis with Energy Economy Optimiza-tion Models. . . 1
1.1 Introduction . . . 1
1.2 EEO Models as Instruments of Inquiry . . . 2
1.2.1 The Limitations of EEO Models . . . 3
1.2.2 The Importance of Discoverable Models and Repeatable Analysis . . . 4
1.2.3 A Broad Trend Towards Transparency in Science . . . 6
1.3 An Assessment of the Current EEO Model Landscape . . . 7
1.4 Keeping Models in the Public Domain . . . 9
1.5 Recommendations for EEO modelers . . . 11
1.5.1 Make Source Code Publicly Accessible . . . 11
1.5.2 Make Model Data Publicly Accessible . . . 13
1.5.3 Make Transparency a Design Goal . . . 14
1.5.4 Utilize Free Software Tools . . . 14
1.5.5 Develop Test Systems for Verification Exercises . . . 15
1.5.6 Work Towards Interoperability Among Models . . . 15
1.6 Concluding thoughts . . . 16
References. . . 17
Chapter 2 Modeling for Insight Using Tools for Energy Model Optimization and Analysis . . . 24
2.1 An Open Model and Framework . . . 24
2.2 The Temoa Framework . . . 24
2.2.1 Transparency . . . 25
2.2.2 Replication of Model Results . . . 27
2.2.3 Uncertainty Analysis . . . 27
2.3 Model Formulation . . . 28
2.3.1 Treatment of Time . . . 28
2.3.2 Introduction to Model Algebra . . . 30
2.3.3 Decision Variables . . . 34
2.3.4 Physical and Operational Constraints . . . 35
2.3.5 User-Defined Constraints . . . 38
2.3.6 Objective Function . . . 39
2.4 Implementation of Temoa . . . 40
2.4.1 Programming Environment . . . 41
2.4.2 Optimization Tools . . . 42
2.5 Verification Exercise . . . 43
References. . . 47
Chapter 3 Hedging Bets with Stochastic Optimization . . . 50
3.1 EEO Models and Stochastic Operation . . . 50
3.2 Stochastic Implementation of Utopia . . . 51
3.3 Testing the Limits of Stochastic Optimization with Temoa . . . 53
3.4 Conclusions . . . 62
References. . . 64
Appendix . . . 66
Appendix A Temoa Project Manual . . . 67
A.1 Preface . . . 67
A.1.1 What is Temoa? . . . 67
A.1.2 Why Temoa? . . . 68
A.1.3 Conventions . . . 69
A.1.4 Temoa Origin and Pronunciation . . . 70
A.1.5 Bug Reporting . . . 70
A.2 Quick Start Guide . . . 71
A.3 The Math Behind Temoa . . . 72
A.3.1 Sets . . . 73
A.3.2 Parameters . . . 77
A.3.3 Variables . . . 84
A.3.4 Constraints . . . 85
A.3.5 Decision Variables . . . 86
A.3.6 Network Constraints . . . 88
A.3.7 Physical and Operational . . . 89
A.3.8 Objective Function . . . 91
A.3.9 User-Specific Constraints . . . 92
A.3.10 General Caveats . . . 93
A.4 The Temoa Computational Implementation . . . 94
A.4.1 File Structure . . . 94
A.4.2 Anatomy of a Constraint . . . 95
A.4.3 A Word on Verbosity . . . 100
A.4.4 Visualization . . . 101
A.5 Interacting with Temoa . . . 104
A.5.1 The Command Line . . . 104
A.5.2 Exactly What is Temoa Doing? . . . 107
A.5.3 The Bleeding Edge . . . 108
A.6 Temoa Code Style Guide . . . 110
A.6.1 Indentation: Tabs and Spaces . . . 111
A.6.2 End of Line Whitespace . . . 111
A.6.3 Maximum Line Length . . . 111
A.6.4 Blank Lines . . . 112
A.6.6 Punctuation and Spacing . . . 112
A.6.7 Vertical Alignment . . . 113
A.6.8 Single, Double, and Triple Quotes . . . 113
A.6.9 Naming Conventions . . . 113
A.6.10 In-line Implementation Conventions . . . 114
A.6.11 Miscellaneous Style Conventions . . . 115
A.6.12 Patches and Commits to the Repository . . . 116
A.7 A note on “Open Source” . . . 117
LIST OF FIGURES
Figure 1.1 Variants of the Nordhaus DICE model . . . 11
Figure 2.1 ‘Utopia’ energy system map. . . 29
Figure 2.2 Schematic of open source software elements in Temoa . . . 41
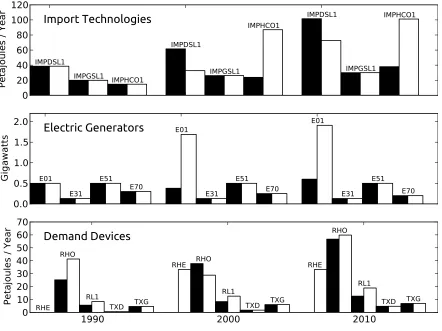
Figure 2.3 ‘Utopia’ results as solved by MARKAL and Temoa . . . 44
Figure 3.1 Visual representation of a ‘Utopia’ stochastic event tree . . . 53
Figure 3.2 Scatterplot of stochastic ‘Utopia’ system solutions costs vs the average investment cost of E01 . . . 54
Figure 3.3 Low and high-growth scenario results from stochastic ‘Utopia’ run . . . . 55
Figure 3.4 Simplified Temoa Island system map . . . 56
Figure 3.5 Installed electric generation capacity in the Temoa Island base case . . . . 57
Figure 3.6 Installed demand technology capacity in the Temoa Island base case . . . 58
Figure 3.7 Temoa Island partial event tree visualization . . . 59
Figure 3.8 Historical annual and 5-year moving average prices of coal, natural gas, and crude-oil . . . 60
Figure 3.9 One, two, three, four, and five year lag autocorrelations of historical coal, natural gas, and oil prices . . . 61
Figure A.1 Visual representation of a simple energy system . . . 73
Figure A.2 An example process within the energy system map . . . 73
Figure A.3 Annual energy use contrasted with annual discounted value of money . . . 76
Figure A.4 An example energy system map . . . 102
Figure A.5 A example energy system map solution . . . 103
Figure A.6 The vintage capacity breakdown of an installed technology . . . 103
LIST OF TABLES
Table 1.1 Details on Existing Energy Economy Optimization Models . . . 8
Table 2.1 List and Description of Temoa’s Set Nomenclature . . . 32
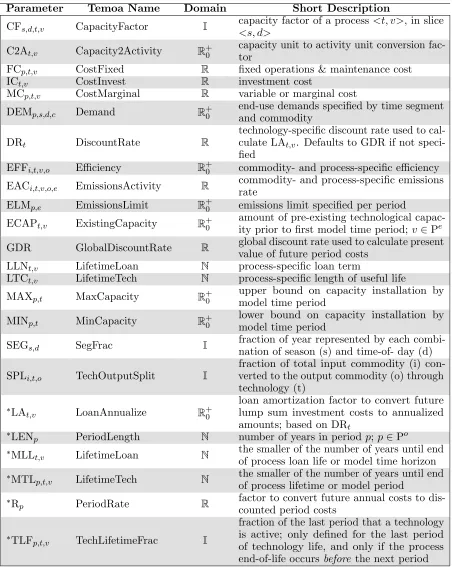
Table 2.2 List and Description of Temoa’s Parameter Nomenclature . . . 33
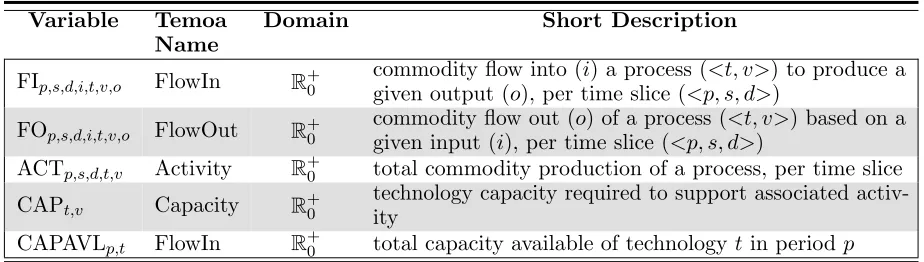
Table 2.3 List and Description of Temoa’s Variable Nomenclature . . . 34
Table 2.4 Utopia Demand Data and Results of MARKAL and Temoa . . . 45
Table 3.1 Decadal Growth Rates Used in Stochastic Utopia . . . 52
Table 3.2 Transition Matrix for Markov Chain Event Tree Reduction . . . 62
Table A.1 List and Description of Temoa’s Set Nomenclature . . . 75
Table A.2 List and Description of Temoa’s Parameter Nomenclature . . . 78
LIST OF EQUATIONS
Process Activity (2.1). . . 34
Technology Capacity (2.2) . . . 35
Supply-Demand Constraint (2.3). . . 35
Process-Level Commodity Flow Constraint (2.4). . . 36
Global Commodity Balance Constraint (2.5) . . . 36
Demand Activity Constraint (2.6) . . . 37
Baseload Constraint (2.7). . . 37
Storage Constraint (2.8). . . 37
Fractional Life Activity Limit Constraint (2.9). . . 38
Capacity Limits (2.10). . . 38
Technology Output Split Constraint (2.12). . . 38
Emission Limit Constraint (2.13). . . 39
Objective Function (2.14). . . 39
Objective: loan costs sub-calculation (2.15). . . 39
Objective: fixed costs sub-calculation (2.16). . . 40
Chapter
1
The Case for Repeatable Analysis with
Energy Economy Optimization Models
1.1
Introduction
The next few decades will see climate change and energy security concerns drive fundamental changes in the global supply, transport, and use of energy. Combined with the unpredictability of the future, this presents a near impossible task for energy planners, who must make decisions today that have enduring repercussions. Energy-economy optimization (EEO) models, as a class of tools that optimize consumption and/or energy supply over time in order to minimize the system-wide cost of energy or maximize social utility, subject to constraints representing physical limitations and public policy, have emerged as a key component of the policy maker’s planning process. These models have informed high-visibility analyses at the regional, national, and international scale (e.g., Clarke et al., 2007; EIA, 2010; Naki´cenovi et al., 2000; IEA, 2010). Today, the rate of EEO-based analyses generated is growing, while they also play an increasingly influential role in the policy-making process.
change (Weyant, 2009).
With the focus mainly on generating insight, there has been insufficient attention paid to transparency in EEO model development and application. Over the last couple of decades, increasing data availability and dramatic drops in the cost performance of computer hardware have led to increasingly large and complex EEO models. Further, extended analysis timescales preclude model validation, so there is little to guide the modeler and reign in efforts that do not improve a model’s ability to deliver useful insight (DeCarolis, 2011).
One roadblock to transparency is that many modeling teams restrict access to their EEO model source code and data. A critical consequence is that third parties cannot reproduce published model results. Current external reviews of EEO model-based analyses are based largely on comparison to existing literature, domain expertise, and trust in the modeling team performing the work, rather than hands-on experience (Ha-Duong, 2001). However, if results are driven by hidden assumptions, coding bugs, highly sensitive parameters, or specific details related to model formulation, they may be impossible for external observers to detect.
Given the important role that EEO models play in policy development, this chapter makes the case that model-based analyses aimed at informing public policy should be “repeatable” by third parties, and that the only realistic avenue to this end requires freely and publicly accessible code and data. These views are not unique as the Advisory Group to the European Commission’s Energy Roadmap 2050 noted that the proprietary PRIMES delivered key results informing the roadmap and so should be made publicly available (Helm et al., 2011). Ince et al. (2012), Hanson et al. (2011), and Barnes (2010) have similarly argued to the broader scientific
community that repeatable model-based analyses require publicly accessible code and data.
1.2
EEO Models as Instruments of Inquiry
EEO models combine scientific understanding, codified rules for human behavior, and value judgments into a unified evaluation framework. The expansive system boundaries and complex interactions that determine the trajectory of energy systems require considerable consolidation of real world phenomena into model code and data to enable analysis. The process of distilling relevant literature into a mathematical model requires reasoned judgment that makes modeling as much art as science (Morrison and Morgan, 1999; Ravetz, 2003). As an example, Nordhaus (2008) likens his DICE integrated assessment model to an iceberg, where the “visible portion”
and the level of optimism regarding future technological development.
In general, complex, dynamic phenomena are radically simplified to make model formulation tractable. For example, technology explicit, partial equilibrium models assume perfect markets for commodities, where each commodity is rendered at a level that maximizes the sum of producer and consumer surplus (Loulou et al., 2004); behavioral response and acceptance of new technology is often modeled simplistically as a hurdle rate: a higher, technology-specific discount rate that represents consumer reluctance to accept newer, less familiar technologies (e.g., Kannan, 2009; Yeh et al., 2006); computable general equilibrium models typically assume that the social welfare function is an aggregation of preferences across individuals, without regard to how consumption is distributed (Ackerman et al., 2009). More broadly, the underlying assumptions employed by modelers do not reflect a deep scientific understanding of human behavior, but rather “convenience and convention” (Ackerman et al., 2009). It is therefore critically important for all parties of a planning process to understand the limitations of EEO models and the types of questions they can answer.
1.2.1 The Limitations of EEO Models
Given the myriad simplifying assumptions required to make future energy-economy projections, one important concern is the ability of EEO models to deliver accurate results. Can we quantify the skill of a given model through validation exercises that compare model results with real world outcomes? In principal, yes. However, Hodges and Dewar (1992) codified four conditions that must be in place for a model to be validatable:
1. It must be possible to observe and measure the situation being modeled.
2. The situation being modeled must exhibit a constancy of structure in time.
3. The situation being modeled must exhibit constancy across variations in conditions not specified in the model.
4. It must be possible to collect ample data with which to make predictive tests of the model.
When applying these criteria for validation, EEO models fail conditions 1, 2, and 3.1 While it
is possible to measure the situation being modeled, such as future energy prices, gross domestic product, or installed technology-specific capacity, the multi-decadal timeframes associated with most EEO model projections make observation an impractical option. For instance, a projection model with a time horizon of 30 years requires 30 years to observe actual outcomes for validation
1Craig et al. (2002) also apply Hodges and Dewar (1992) validation criteria to energy models used for
purposes, negating any use as a planning tool. Condition 2 requires that the “causal structure” of the system being modeled remain constant through time. Energy economies at different geographic scales also violate this condition. National priorities, technological change, and resource availability can result in structural economic shifts that cannot be captured by EEO models. As Weyant (2009) notes, given underlying structural changes, a model that generated accurate predictions in the past may not work well in the future. Condition 3 requires that the system being modeled must not vary according to conditions not modeled. Since EEO models represent a highly simplified reality, there are many unmodeled conditions that can affect outcomes of interest, such as geopolitical events, major technological breakthroughs, environmental surprises, and shifting political moods over time. As EEO models fail 3 of the 4 Hodges and Dewar validation conditions, it is not possible to benchmark their performance, and perhaps explains their poor skill at predicting outcomes of interest Craig et al. (2002); Morgan and Keith (2008).
Given the inability to validate EEO model results against real world outcomes, model results are limited to the modeled world. Hodges and Dewar (1992) suggest that unvalidated models do not yield insight into the actual situation, only the assertions embodied in the model. Similarly, Morrison and Morgan (1999) assert that when building a model, modelers create “a representative structure” of a real world system. Consequently, model outputs pertain to the simplified modeled world rather than the real world. Models suggest truth rather than reveal it (Hodges and Dewar, 1992). Though inter-model comparison is useful (e.g., Energy Modeling Forum, Innovation Modelling Comparison Project), it remains a weak form of validation because the model results are benchmarked against one another rather than real world outcomes.
1.2.2 The Importance of Discoverable Models and Repeatable Analysis
While EEO model results are not self-evidently true and cannot easily be compared to real world outcomes through robust validation exercises, they still serve a vital role by testing and stretching our intuition regarding the function and response of energy systems and economies to policy and other exogenous drivers. A deeper question, however, pertains to exactly how analysts derive insight from models. Though focused on physics-based models, Hughes (1997) suggests that model-based learning takes place in three stages: denotation, demonstration, and interpretation. Likewise, Morrison and Morgan (1999) assert that much of the learning with models takes place through construction and manipulation. Unfortunately, the benefit of learning from model construction and application is hindered by the lack of openness characteristic of many existing EEO models (detailed in §1.3).
ensures that the data are error-free, assumptions are discoverable, and the mathematical model operating on the data produces the intended result. While modeling teams ostensibly undergo an internal verification process, the inaccessibility of model source code and data prevents the same verification by external parties. The inability to verify another’s model results gives rise to three concerns:
1. Hidden flaws or bugs in the source code or data2
2. Subjective or value-based assumptions driving the results
3. The effect of highly sensitive parameters obscured or absent in the published analysis
Public access to model source code and data would allay the concerns above by allowing independent third parties to verify that the model works as intended, reproduce specific results, and test the robustness of model results through sensitivity analysis. Only by running a model can users understand the model world and how carefully crafted model structure, assumptions, and data affect model results.
Allowing external parties to run a model under different assumptions also provides a check that the conclusions drawn from a published model-based analysis are indeed robust. Under the prevailing approach, the larger policy and modeling communities take a passive approach and rely almost exclusively on modelers to deliver policy-relevant observations. While it is unrealistic to assume that rigorous testing of model performance would be widespread with publicly available models, a small external group of expert users could enhance model credibility through verification exercises.
Several papers have noted the prevailing lack of transparency associated with the development and application of IAMs (Ha-Duong, 2001; Rotmans, 1998; Schneider, 1997). (Ha-Duong, 2001) notes that journal referees are not required to verify the model results or audit the source code, but rather assess model-based analyses against existing literature and their own intuition. In addition, the reputation of the modeler(s) and the clarity of the associated narrative also play a role in assessment. However, if hidden simplifications, coding bugs, key sensitivities, or details drive specific results related to model formulation – given their often subjective nature – they would be impossible to identify by an external observer without a formal verification exercise. Schneider (1997) notes that IAMs include value-laden assumptions that are often invisible to the consumers of IAM results, who have widely varying analytic ability and command of model formulation. Such hidden assumptions confuse public debate and engender a sense of mistrust
2
in black box models. Speaking more broadly about IA methods, Rotmans (1998) asserts that “the evidence for integrity is transparency.” Repeatable analysis enabled by publicly accessible source code and data would increase transparency by allowing model interrogation and external verification of published results.
1.2.3 A Broad Trend Towards Transparency in Science
The challenge of producing repeatable analyses exists for all scientific models, particularly those involving large datasets and/or complex model formulations. There is an increasing trend towards transparency as evidenced by the development of open source software across a range of scientific fields. For example, the Community Earth Science Model (CESM) in climate science (UCAR, 2012), an open source implementation of the Message Passing Interface (MPICH2) and the Portable Extensible Toolkit for Scientific Computation (PETSc) in computer science (MPICH2, 2012; PETSc, 2012), and the Basic Local Alignment Search Tool (BLAST) in bioinformatics (Altschul et al., 1990; BLAST, 2012) represent high visibility, open source efforts in their respective fields.
In addition, the importance of open databases has been recognized across scientific disciplines. For example, the GenBank sequence database is an open access, annotated collection of all publicly available nucleotide sequences and their protein translations (NCBI, 2012). Deep Sky is an astronomical image database of “unprecedented depth, temporal breadth, and sky coverage” gathered from the Near Earth Asteroid Tracking (NEAT) project (Sky, 2012). Datasets from the Moderate-resolution Imaging Spectroradiometer (MODIS), a payload scientific instrument launched into Earth orbit by NASA, are publicly accessible (NASA, 2012). Recently, there have also been efforts to develop community science gateways (e.g., NERSC, 2012; XSEDE, 2012), which represent a community-developed set of tools, applications, and data that are integrated via a portal to meet the needs of a specific community.
There also appears to be a trend towards greater transparency in the academic literature. For example, the journalScience now requires the publication of computer code involved in the creation or analysis of data (Hanson et al., 2011). In addition, top economic journals, including
American Economic Review (AEA, 2012), Econometrica (TES, 2012), Journal of Political Economy (JPE, 2012), The Economic Journal(RES, 2012a), and The Econometric Journal
rule. Unfortunately, peer-reviewed archival journals that frequently publish EEO model-based results such asEnergy Policy,Energy Economics, and Environmental Modeling & Assessment
do not have policies requiring the publication of source code and data. Given the role of such models in public policy formulation, it is problematic that these journals have not adopted the stricter accessibility standards of their peers.
1.3
An Assessment of the Current EEO Model Landscape
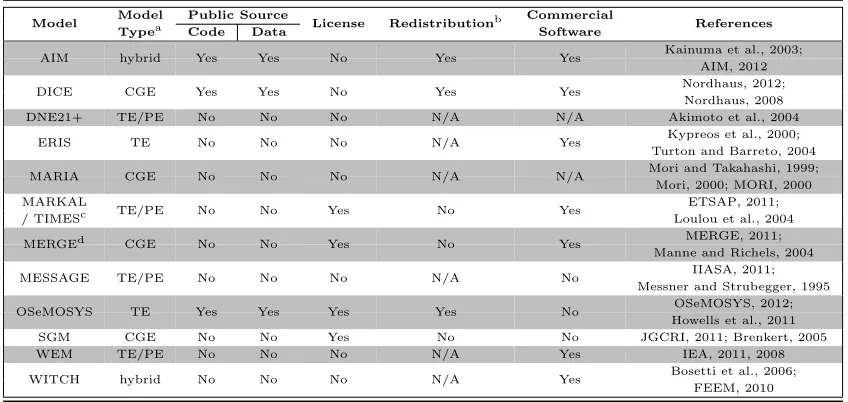
In order to assess the public accessibility of existing EEO models, I reviewed the conference programs and extracted model names from publicly accessible titles, abstracts, and papers of the International Energy Workshop (IEW) for the last decade, from 2001 to 2011 (IEW, 2012).3 The IEW is the premier international venue for energy modeling and analysis, and therefore represents an unbiased source for information on EEO models. There were references to 43 EEO models. To make the analysis more tractable, consideration was limited to the models that were referenced in at least two different accepted IEW submissions over the last decade, which reduced the number of models from 43 to 12. Pulling from a broad literature review that focused on reports and journal articles describing these 12 models – with an effort to find the earliest descriptions and applications of the models, which are most likely to include a complete model formulation as well as source code and data – Table 1.1 shows attributes of interest to this chapter, including accessibility to model source code and data, software licenses, permission to redistribute, and commercial software dependencies.
In order for a model to qualify as having public source code or data in Table 1.1, it must be available for download through a publicly accessible web portal and without the need to communicate with the modeling team. Requiring an interested party to submit a formal request to obtain source code or data introduces a barrier that can4 either be used as an intentional filter to selectively deny access, or as an unintentional obstruction caused by a non-responsive point-of-contact. Qualification of model source code and data as “publicly accessible” is consequently a conservative metric.
According to the accessibility standard described above, only AIM, DICE and OSeMOSYS provide direct public access to both model source code and data. Of those three, only OSeMOSYS has adopted a license that outlines how model source code and data may be redistributed: the existing Apache version 2.0 license, which allows users the freedom to redistribute the model with minimal conditions (Apache, 2004). Neither AIM nor DICE specify a license, which implies that those models may be utilized and redistributed without any restrictions imposed by the
3
Because accessibility to conference abstracts and papers is limited in some years, the review should be regarded as an unbiased sample rather than a comprehensive set.
4
original developers.
Table 1.1: Details on Existing Energy Economy Optimization Models
Model Model Public Source License Redistributionb Commercial References
Typea Code Data Software
Kainuma et al., 2003;
AIM hybrid Yes Yes No Yes Yes
AIM, 2012 Nordhaus, 2012;
DICE CGE Yes Yes No Yes Yes
Nordhaus, 2008
DNE21+ TE/PE No No No N/A N/A Akimoto et al., 2004
Kypreos et al., 2000;
ERIS TE No No No N/A Yes
Turton and Barreto, 2004 Mori and Takahashi, 1999;
MARIA CGE No No No N/A N/A
Mori, 2000; MORI, 2000
MARKAL ETSAP, 2011;
/ TIMESc TE/PE No No Yes No Yes Loulou et al., 2004
MERGE, 2011;
MERGEd CGE No No Yes No Yes
Manne and Richels, 2004 IIASA, 2011;
MESSAGE TE/PE No No No N/A No
Messner and Strubegger, 1995 OSeMOSYS, 2012;
OSeMOSYS TE Yes Yes Yes Yes No
Howells et al., 2011
SGM CGE No No Yes No No JGCRI, 2011; Brenkert, 2005
WEM TE/PE No No No N/A Yes IEA, 2011, 2008
Bosetti et al., 2006;
WITCH hybrid No No No N/A Yes
FEEM, 2010
a. The table delineates two types of models: computable general equilibrium (CGE) and technology explicit, partial equilibrium (TE/PE).
b. N/A = Not applicable. Assigned when source and data are unavailable and no license is specified. Models with open source code and data but with no license are assumed to allow redistribution without any restrictions.
c. MARKAL/TIMES: The datasets are developed by individual user groups, who make independent decisions about data availability.
d. MERGE: The model is made available, but users must communicate with the modeling team to obtain access.
There are potentially several reasons why most EEO models and datasets remain closed source: protection of intellectual property, fear of misuse by uninformed end users, inability to control or limit model analyses, implicit commitment to provide support to users, unease about subjecting code and data to public scrutiny, and overhead associated with maintenance. In the long run, I argue that the benefits of model transparency outweigh these legitimate concerns. Protection of intellectual property is a concern, but most of the intellectual value comes from the insight derived from model application, not the code and data. Model misuse is also a valid concern; however, pursuant to the standard scientific process, publicly accessible code and data should enable the rapid identification of aberrant results. Regarding technical support, Barnes (2010) makes a strong suggestion that no one is entitled to free technical support, and that constructive feedback can lead to model improvements while unhelpful feedback can be ignored. Finally, making a model publicly accessible can involve minimal overhead, as outlined in §1.5.
The existing open source models in Table 1.1 demonstrate that the concerns listed above are surmountable. DICE illustrates the benefit of a publicly accessible, transparent modeling effort: academic search engines return over 250 relevant references to journal articles, book chapters, and reports. Given its greater complexity and regional focus, AIM has engendered less third party adoption, but has been used for high visibility policy analysis through (for example) the IPCC (Naki´cenovi et al., 2000) and Stanford Energy Modeling Forum (EMF, 2012). Despite the recent development of OSeMOSYS (Howells et al., 2011), it has played a prominent role in the International Energy Workshop over the last couple of years with separate side events for interested modelers (IEW, 2012). Because the source code and data for these models are publicly accessible – and can therefore be carefully scrutinized – it engenders a sense of trust within the larger community of modelers that contributes to third party interest, scrutiny, and in many cases, adoption. In addition, publicly accessible models enable third parties to engage in model-based learning, as described in§1.2, without having to embark on a new model development effort.
1.4
Keeping Models in the Public Domain
Publicly accessible computer code is nothing new and there already exists a robust and vibrant community of open source software developers committed to software development in the public domain. The GNU Project, launched in 1984 to develop the GNU operating system, articulates a set of four freedoms that must be met in order to classify software as “free” (GNU, 2012):
The freedom to run the program, for any purpose (freedom 0).
The freedom to redistribute copies so you can help your neighbor (freedom 2).
The freedom to distribute copies of your modified versions to others (freedom 3).
Note that the notion of free pertains to the lack of restrictions placed on the software, not the price. GNU defines copyleft – as opposed to copyright – as the general concept that protects these four freedoms (GNU, 2012). However, implementation of copyleft requires a specific license, such as the GNU General Public License (GPL) or the GNU Lesser General Public License (LGPL) (GNU, 2011). Perhaps the most visible example of free software is the Linux operating system, which is available through several different distributions (Negus, 2010). The Linux kernel, which represents the core operating system, is distributed under GPLv2 (Love, 2010). Several other open source licenses exist, including Apache, BSD, and Mozilla, which differ primarily over freedoms 2 and 3 regarding the conditions on redistribution.
The scientific projects mentioned in §1.2 (CESM, MPICH2, PETSc, BLAST, GenBank, DeepSky, and MODIS) are funded by the U.S. federal government and therefore do not place restrictions on the use and redistribution of available software tools and data. In contrast to EEO models, these datasets and software tools occupy a well-defined and focused space within the scientific community. By comparison, EEO models are often adapted to answer specific questions, require a large number of reasoned yet subjective judgments, and rely on input data that change frequently. Even ostensibly minor changes to input assumptions or model formulation can have unforeseen impacts on EEO model-based results. If source code and data associated with a particular analysis are not released, it is difficult for third parties to assess how changes made to the model affect the results, unless described by the modelers.
Simply applying a copyleft license to an EEO model is insufficient. While freedoms 0 and 1 meet the stated objective of providing publicly accessible models, freedoms 2 and 3 fall short by relying on software redistribution to trigger the release of source code and data. To illustrate the consequences of unrestricted distribution, a review of the DICE model, an open source EEO model drawn from Table 1.1, was conducted. As Figure 1.1 suggests, DICE has been implemented several times with modifications and used to produce new model variants. While in all cases the authors made a good faith effort to describe changes to Nordhaus’s original DICE model, none have made their source code and data publicly accessible. Even if DICE was subject to a copyleft license, the output of the modified model is simply a journal paper or report, which does not constitute software redistribution. As a result, the model user is not obligated to release the modified source code and dataset. In this case, the goal of repeatable model-based analysis cannot be sustained within the existing licensing framework.
ADICE (Islam, 1995)
ENTICE/BR (Popp, 2006) ENTICE (Popp, 2004)
AD-DICE (de Bruin, et al., 2009b) DICER (Ortiz, et al., 2011) (Nordhaus, 1993)
DICE
Figure 1.1: Variants of the Nordhaus DICE model. A search for the “Dynamic Integrated model of Climate and Economy” in Google Scholar returned 277 results in April 2012, which were all reviewed to ensure relevance to the Nordhaus DICE model. Only DICE model variants with a unique name are included here, as they include modifications to the underlying DICE formulation rather than simply an application of the original formulation.
modification to the software must also “publish the source code of their modifications, in the same form as the Software Model is here released, and under the same license terms”. Condition 7 states that redistribution of the “Software Model” must include the same license agreement. The EPPA license is unique because it requires users to publish modifications to the model when model-based analysis is submitted for publication, and requires publication under the same EPPA license. Such a license fosters repeatable analyses by keeping model data and source code in the public domain.
1.5
Recommendations for EEO modelers
While §1.4 focused on the development and enforcement of open source standards from a community perspective, this section provides six best practice recommendations to modelers that can facilitate and sustain repeatable model analysis and suggests several common software development tools that can help facilitate community involvement with open source models.
1.5.1 Make Source Code Publicly Accessible
EEO models with thousands of lines of code require auditing procedures that are transparent to both the modeling team and external observers. Software configuration management (SCM) is a software engineering practice to identify the configuration of a software system at distinct points in time for the purpose of systematically tracking and controlling changes to software (Bersoff, 1997). The goal is to ensure the integrity and traceability of changes during the entire
software lifecycle.
Revision control, a major component of SCM, focuses on tracking the changes made to software, documents, or other digital information. It enables versioning of changes to a code base, analogous to “track changes” in a word processing document. A revision control system (RCS) logs all changes to a code base using incremental snapshots (known as “revisions”) to prevent any loss of work. Moreover, best practices require the developer to briefly summarize the changes and provide semantic context for each snapshot. RCS also enables multiple developers to simultaneously work on a common software component and enhances productivity by automatically integrating changes made by different people. One strategy to this end is “branching,” a technique that enables simultaneous and divergent development “branches” of a code base, emanating from a common revision in the RCS. Branches both enable uninhibited developer exploration of a code base, while at the same time encouraging the best practice of revision. At a suitable point of development, the branch can be integrated (merged) into the main branch.
Revision control systems also allow the creation of “named snapshots.” These snapshots can represent anything from internal project milestones in the software lifecycle, to well-tested “releases” ready for public consumption. In the context of EEO models, named snapshots can be used to mark the software versions used to generate results for a specific publication or report. Revision control also facilitates internal auditing and, when coupled with web access, allows for easy external auditing of a code base (Read, 2003; Pilato et al., 2008; Loeliger, 2009). Deployment of a revision control system via the Web represents the most effective way to make the source code repository publicly accessible. This approach provides a transparent audit trail during model development and application that can quickly resolve potential controversies arising out of innocuous mistakes. While the code may be imperfect and the ability to provide support limited, public release enables others to engage in the research, which can ultimately lead to model improvements (Barnes, 2010).
control system (discussed above) allows modelers to develop alternative forms of the model with different features that suit a particular analysis and archive them as separate versions. The ability to archive different versions of the same model may help temper the tendency towards increasingly complex models over time as the same model is put to different uses. However, note that revision control is merely a tool: the modeler must employ it judiciously with transparency as a design goal.
1.5.2 Make Model Data Publicly Accessible
Making source code publicly available does not make a model exercise repeatable unless the input data is also available. As noted in the previous section, EEO models programmed in algebraic modeling languages often maintain a distinction between the logic (i.e., model formulation) and data. As a result, algebraic models can operate on data files that vary by geographic region, technology detail, and parameter values. For example, the Energy Technology Systems Analysis Program (ETSAP) maintains the source code for two model generators, MARKAL and TIMES, but there are over 70 participating countries that have developed their own datasets for analysis (ETSAP, 2011).
While EEO model source code is likely to remain relatively stable over time, model data files are updated frequently as engineering parameters change, economic patterns shift, and the focus of analysis evolves. In order to generate reproducible model results, the complete set of model data should also be published in a web-accessible, free, and archived repository. Because input data and assumptions change so frequently, it is important to archive input data associated with each published analysis.
Most models store input data in text files, which are exactly what RCS systems are designed to process. MARKAL and TIMES require users to enter input data into a set of Excel workbooks, which are utilized to dynamically generate a relational database. At a minimum, a database (or the corresponding spreadsheets) could be archived in binary format. It may also be possible to extract the tables from each database version and archive them as text, which would enable line-by-line auditing of the data file by the revision control system.
versions old are publicly available for download (GTAP, 2012). While these efforts are a step in the right direction, at the time of this writing there are no ongoing efforts to publicly archive model- and analysis-specific data to enable repeatable, EEO model-based analysis.
1.5.3 Make Transparency a Design Goal
Providing public access to model source code and data is a necessary but insufficient condition for model transparency. EEO models often include a complex algebraic formulation that operates on large datasets. While the availability of model source code and data allows external parties to reproduce earlier results, the user may have a very difficult time understanding the model without proper documentation.
An interested practitioner looks to documentation accompanying the model source code and data as the primary mechanism to aid model comprehension. The importance of documentation has already been recognized: all models listed in Table 1.1 include some form of documenta-tion. Documentation comes in many forms; for example, a separate comprehensive document, comments embedded in the source code, and the code itself consisting of descriptive variable names that provide self-evident meaning. Well-articulated, accurate and current documentation should be a design requirement from the initial stages of model development. Where possible, it is also advisable to utilize automatic documentation generation tools (e.g., van Heesch, 2012; Brandl, 2012) that process embedded documentation blocks in source code and are updated to reflect any source changes in order to maintain consistency between code and documentation. Additionally, modelers should consider providing different versions of documentation targeted for different purposes or users; for example, user and developer guides. For example, OSeMOSYS defines three levels of abstraction within the model framework: a plain English description, an algebraic formulation, and the model implementation in an AML (Howells et al., 2011).
1.5.4 Utilize Free Software Tools
Having emphasized freedom (above) in the context of open source code and data, modelers should also consider the use of cost-free (gratis) software to minimize the barriers to entry. Open source programming environments for algebraic model formulation include (but are not limited to) GNU MathProg (Makhorin, 2000),<Coliop|Coin>Mathematical Programming Language (CMPL) (COIN, 2012) and Python-based Optimization Modeling Objects (Pyomo) (Hart et al., 2012). All three of these software tools include linkages to free solvers. EEO models used to produce policy-relevant insight should maintain a baseline executable model that is (at a minimum) operable with free tools.
disproportionate impact on academics (e.g., the ability to train the next generation of EEO modelers) and analysts in developing countries with minimal budgets. However, proprietary modeling tools are often more efficient than their gratis counterparts. And while the use of commercial software does not prevent repeatable analysis, the financial burden of software limits participation in the EEO modeling endeavor.
1.5.5 Develop Test Systems for Verification Exercises
To aid model development efforts, the EEO community should create a set of publicly available data files that represent test systems for verification exercises. Data files of varying complexity can be used to internally benchmark model results and performance as development proceeds, and can also be used for comparison to other models. For example, to debug the OSeMOSYS model, a test system called ‘Utopia’, packaged with MARKAL, was used to debug model formulation (Howells et al., 2011). While such an informal approach works, more beneficial would be a recognized suite of test systems. For example, in power engineering, the IEEE Subcommittee on the Application of Probability Methods, published the reliability test system (RTS) in 1979. (It has since been updated (Allan et al., 1986; Grigg et al., 1999)). The IEEE RTS is recognized community-wide as a test system containing generation, transmission and load data that can be used for consistent evaluation of proposed reliability techniques (Allan et al., 1986). Such a suite of test systems within the international EEO community could serve several valuable purposes: debug changes to model formulation, assess computational performance, and provide a consistent evaluation mechanism for inter-model comparison.
1.5.6 Work Towards Interoperability Among Models
While collaborative modeling efforts such as the Energy Modeling Forum (2012) and Innovation Modelling Comparison Project (2011) are focused on drawing insight through inter-model comparison, participating modeling teams must expend significant effort to implement scenario assumptions within their respective input datasets. Such inter-model comparison is possible through the similarity of starting assumptions for analysis; however, it is difficult to determine whether divergent model results are due to differences in input data or model formulation. If models of the same class (e.g., technology explicit partial equilibrium or computable general equilibrium) could draw data directly from a common data repository, it would improve inter-model comparison by ensuring data consistency across inter-models. Further, if different inter-models shared the same dataset, duplicative effort associated with building datasets could be reduced.
interoperability. A relational database management system (RDBMS) is the most appropriate tool to archive and query common model data. The advantage over other storage options is that data can be queried and mapped efficiently to a project’s native input format without altering the underlying organization. The relationships are defined through a schema and enforced by the RDBMS (Imielinski and Lipski Jr, 1982). Through the schema, an RDBMS provides a declarative layer of access to data: the user simply provides an English-like description of a model’s data requirements in order to generate a model-specific dataset on demand. A key benefit of an RDBMS is that it works equally well for a dataset containing 10 or 10 billion data entries. Once developed and replicated at multiple institutions, a publicly accessible database could serve as a community resource for energy modelers.
1.6
Concluding thoughts
EEO models include complex energy system representations that operate on large datasets. The rise in computing power coupled with an increase in data availability has led to complicated models whose internal workings are often hidden from external observers. Models should be fully discoverable by interested and knowledgeable third parties. Further, model-based analysis used to inform public policy should be independently reproducible by third party observers. Without the ability to repeat model analysis, it is impossible to fully understand a model formulation, expose hidden assumptions, or identify key model sensitivities. Currently, such analysis is assessed largely on the reputation of the modeling team, comparison to other analyses, and subjective interpretation based on the reader’s experience and judgment.
REFERENCES
F. Ackerman, S. J. DeCanio, R. B. Howarth, and K. Sheeran. Limitations of Integrated Assessment Models of Climate Change. Climatic change, 95(3):297–315, 2009. Springer.
AEA. The American Economic Review: Data Availability Policy. (website), 2012. URL http://www.aeaweb.org/aer/data.php. American Economic Association. (Accessed Apr, 2012).
AIM. Asia-Pacific Integrated Model. (website), 2012. URLhttp://www-iam.nies.go.jp/aim/ index.htm. (Accessed Apr, 2012).
K. Akimoto, T. Tomoda, Y. Fujii, and K. Yamaji. Assessment of Global Warming Mitigation Options with Integrated Assessment Model DNE21. Energy Economics, 26(4):635–653, 2004. Elsevier.
R. N. Allan, R. Billinton, and N. M. K. AbdelGawad. The IEEE Reliability Test System -Extensions to, and Evaluation of, the Generating System. Power Systems, IEEE Transactions on, 1(4):1–7, Nov 1986. ISSN 0885-8950. doi: 10.1109/TPWRS.1986.4335006.
S. F. Altschul, W. Gish, W. Miller, E. W. Myers, D. J. Lipman, et al. Basic Local Alignment Search Tool. Journal of Molecular Biology, 215(3):403–410, 1990. Elsevier Science.
Apache. Apache License, Version 2.0. (website), Jan 2004. URL http://www.apache.org/ licenses/LICENSE-2.0.html. The Apache Software Foundation. (Accessed Aug, 2012).
N. Barnes. Publish Your Computer Code: It Is Good Enough. Nature, 467(7317):753–753, 2010. Nature Publishing Group.
E. H. Bersoff. Elements of Software Configuration Management. IEEE Computer Society Press, 1997. Los Alamitos, CA.
BLAST. BLAST: Basic Local Alignment Search Tool. (website), 2012. URLhttp://blast. ncbi.nlm.nih.gov/Blast.cgi. (Accessed Apr, 2012).
V. Bosetti, C. Carraro, M. Galeotti, E. Massetti, and M. Tavoni. WITCH: A World Induced Technical Change Hybrid Model. The Energy Journal, 27(1):13–38, 2006.
G. Brandl. Sphinx Documentation. (website), Mar 2012. URLhttp://sphinx.pocoo.org/. version 1.1.3. Sphinx: Python Documentation Generator. (Accessed Aug, 2012).
A. L. Brenkert. SGM Users Guide I. (PNNL-15019-1), 2005. Joint Global Change Research Institute (JGCRI), Pacific Northwest National Laboratory.
COIN. CMPL - COIN Mathematical Programming Language. (website), 2012. URL https: //projects.coin-or.org/Cmpl. (Accessed Apr, 2012).
CoPS. GEMPACK General Equilibrium Modelling Software. (website), 2010. URL http: //www.monash.edu.au/policy/gempack.htm. Centre of Policy Studies (CoPS). (Accessed Sep, 2011).
P. P. Craig, A. Gadgil, and J. G. Koomey. What Can History Teach Us? A Retrospective Examination of Long-Term Energy Forecasts for the United States. Annual Review of Energy and the Environment, 27(1):83–118, 2002.
J. F. DeCarolis. Using Modeling to Generate Alternatives (MGA) to Expand Our Thinking on Energy Futures. Energy Economics, 33(2):145–152, 2011. Elsevier.
EIA. The National Energy Modeling System: An Overview 2009. Technical Report DOE/EIA-0581(2009), Office of Integrated Analysis and Forecasting, U.S. Department of Energy, U.S. Government Printing Office, Washington, D.C., 2009. U.S. Energy Information Administration (EIA).
EIA. Annual Energy Outlook 2011. 2010. U.S. Energy Information Administration (EIA).
EIA. Annual Energy Outlook 2010. Technical Report DOE/EIA-0384(2011), Office of Integrated Analysis and Forecasting, U.S. Department of Energy, U.S. Government Printing Office, Washington, D.C., 2011a. U.S. Energy Information Administration (EIA).
EIA. Availability of the National Energy Modeling System (NEMS) Archive. (ZIP archive), 2011b. URL ftp://ftp.eia.doe.gov/pub/forecasts/aeo/. U.S. Energy Information Ad-ministration (EIA). (Accessed Sep, 2011).
Elsevier. Executable Paper Grand Challenge. (website), 2012. URL http://www. executablepapers.com/. Elsevier. (Accessed Aug, 2012).
EMF. Energy Modeling Forum (EMF). (website), 2012. URL http://emf.stanford.edu/. (Accessed Apr, 2012).
EPA. Economic Climate Modeling. (website), 2011. URL http://www.epa.gov/ climatechange/economics/modeling.html. U.S. Environmental Protection Agency (EPA). (Accessed Jul, 2011).
EPPA. EPPA Public Release: License Agreement. (webpage), 2011. URLhttp://globalchange. mit.edu/igsm/eppadl_form.html. Emissions Predictions and Policy Analysis (EPPA). (Ac-cessed Sep, 2011).
ETSAP. Energy Technology Systems Analysis Program. (website), 2011. URL http://www. iea-etsap.org/. Energy Technology Systems Analysis Program (ETSAP). (Accessed Aug, 2011).
FEEM. WITCH Model Description. (webpage), 2010. URL http://www.witchmodel.org/ pag/model.html. (Accessed Apr, 2012).
R. Fourer, D. M. Gay, and B. W. Kernighan. AMPL: A Modeling Language for Mathematical Programming. Thomson/Brooks/Cole, 2003. ISBN 978-0-534-38809-6.
GNU. Licenses. (website), 2011. URLhttp://www.gnu.org/licenses/. (Accessed Aug, 2012).
GNU. What Is Free Software? (webpage), 2012. URL http://www.gnu.org/philosophy/ free-sw.html. (Accessed Aug, 2012).
L. H. Goulder and R. N. Stavins. An Eye on the Future. Nature, 419(6908):673–674, 2002. Nature Publishing Group.
C. Grigg, P. Wong, P. Albrecht, R. Allan, M. Bhavaraju, R. Billinton, Q. Chen, C. Fong, S. Had-dad, S. Kuruganty, et al. The IEEE Reliability Test System-1996. a Report Prepared by the Reliability Test System Task Force of the Application of Probability Methods Subcommittee.
Power Systems, IEEE Transactions on, 14(3):1010–1020, 1999. IEEE.
GTAP. GTAP (Global Trade Analysis Project). (website), 2012. URL https://www.gtap. agecon.purdue.edu/. (Accessed Apr, 2012).
M. Ha-Duong. Transparency and Control in Engineering Integrated Assessment Models. In-tegrated Assessment, 2(4):209–218, 2001. ISSN 1389-5176. doi: 10.1023/A:1013384932008. URLhttp://www.springerlink.com/content/k2713006032w6668/abstract/. Springer.
B. Hanson, A. Sugden, and B. Alberts. Making Data Maximally Available. Science, 331(6018): 649, 2011. American Association for the Advancement of Science.
W. E. Hart, C. Laird, J.-P. Watson, and D. L. Woodruff. Pyomo: Optimization Modeling in Python, volume 67. Springer Verlag, 2012.
D. Helm, C. Mandil, J. Vasconcelos, D. MacKay, F. Birol, A. Mogren, F. Hauge, B. Bach, C. Van der Linde, E. Toczylowski, I. J. P´erez-Arriaga, W. Kr¨oger, G. Luciani, and F. Matthes. Final Report of the Advisory Group on the Energy Roadmap 2050. Commission Staff Working Paper 1569, 2011. European Commission.
M. Henrion. Open-Source Policy Modeling. Presentation at Carnegie Mellon University, Feb 2011. URLhttp://cedm.epp.cmu.edu/files/slides/Henrion.pdf. (Accessed Aug, 2012).
J. S. Hodges and J. A. Dewar. Is It You or Your Model Talking?: A Framework for Model Validation. 1992.
M. Howells, H. Rogner, N. Strachan, C. Heaps, H. Huntington, S. Kypreos, A. Hughes, S. Silveira, J. DeCarolis, M. Bazillian, and A. Roehrl. OSeMOSYS: The Open Source Energy Modeling System: An Introduction to Its Ethos, Structure and Development. Energy Policy, 39 (10):5850–5870, Oct 2011. ISSN 0301-4215. doi: 10.1016/j.enpol.2011.06.033. URL http:
//www.sciencedirect.com/science/article/pii/S0301421511004897.
IEA. A Hybrid Modelling Framework to Incorporate Expert Judgment in Integrated Economic and Energy Models – The IEA WEM-ECO Model. 2008. International Energy Agency (IEA), Economic Analysis Division.
IEA. Energy Technology Perspectives 2010: Scenarios & Strategies to 2050. International Energy Agency, Paris, France, 2010.
IEA. World Energy Model: Methodology and Assumptions. (website), 2011. URL http: //www.worldenergyoutlook.org/. International Energy Agency (IEA). (Accessed Apr, 2012).
IEW. IEW: International Energy Workshop. (website), 2012. URL http://www. internationalenergyworkshop.org/. (Accessed Apr, 2012).
IIASA. Energy Modeling Framework: Model for Energy Supply Strategy Alternatives and Their General Environmental Impact (MESSAGE). (website), 2011. URLhttp://www.iiasa. ac.at/Research/ENE/model/message.html. International Institute for Applied Systems Analysis. (Accessed Sep, 2011).
T. Imielinski and W. Lipski Jr. A Systematic Approach to Relational Database Theory. In
Proceedings of the 1982 ACM SIGMOD International Conference on Management of Data, pages 8–14. ACM, 1982.
D. C. Ince, L. Hatton, and J. Graham-Cumming. The Case for Open Computer Programs.
Nature, 482(7386):485–488, 2012. Nature Publishing Group.
JGCRI. Second Generation Model (SGM). (website), Aug 2011. URL http://www. globalchange.umd.edu/models/sgm/. Joint Global Change Research Institute (JGCRI). (Accessed Sep, 2011).
JPE. Information for Authors. (webpage), 2012. URLhttp://www.jstor.org/page/journal/ jpoliecon/forAuthor.html. Journal of Political Economy (JPE). (Accessed Aug, 2012).
M. Kainuma, Y. Matsuoka, and T. Morita. Climate Policy Assessment: Asia-Pacific Integrated Modeling. Springer Verlag, 2003.
R. Kannan. Uncertainties in Key Low Carbon Power Generation Technologies-Implication for UK Decarbonisation Targets. Applied Energy, 86(10):1873–1886, 2009. Elsevier.
S. Kypreos, L. Barreto, P. Capros, and S. Messner. ERIS: A Mmodel Prototype with Endogenous Technological Change. International Journal of Global Energy Issues, 14(1):347–397, 2000. Inderscience.
J. Loeliger. Version Control with Git: Powerful Tools and Techniques for Collaborative Software Development. Oreilly Series. O’Reilly Media, 2009. ISBN 978-0-596-52012-0.
R. Loulou, G. Goldstein, K. Noble, et al. Documentation for the MARKAL Family of Models.
R. Love. Linux Kernel Development. Addison-Wesley Professional, third edition, 2010. ISBN 978-0-672-32946-3.
A. Makhorin. Modeling Language GNU MathProg. Relat´orio T´ecnico, 2000. Moscow Aviation Institute. Moscow, Russia.
A. S. Manne and R. G. Richels. MERGE: An Integrated Assessment Model for Global Climate Change. Jun 2004. Stanford University, white paper.
B. D. McCullough. Open Access Economics Journals and the Market for Reproducible Economic Research. Economic Analysis and Policy, 39(1):117–126, 2009.
MegaJoule. MegaJoule. (website), 2012. URLhttp://megajoule.org/. (Accessed Apr, 2012).
MERGE. MERGE: A Model for Evaluating the Regional and Global Effects of GHG Reduction Policies. (website), 2011. URL http://www.stanford.edu/group/MERGE/. (Accessed Sep, 2011).
S. Messner and M. Strubegger. User’s guide for MESSAGE III. Rep. WP-95-69, International Institute for Applied Systems Analysis, Laxenburg, Austria, 1995.
M. G. Morgan and D. W. Keith. Improving the Way We Think about Projecting Future Energy Use and Emissions of Carbon Dioxide. Climatic Change, 90(3):189–215, 2008. ISSN 0165-0009. doi: 10.1007/s10584-008-9458-1. URLhttp://www.springerlink.com/content/ p113h768w74215p6/abstract/. Springer.
S. Mori. The Development of Greenhouse Gas Emissions Scenarios Using an Extension of the MARIA Model for the Assessment of Resource and Energy Technologies. Technological Forecasting and Social Change, 63(2):289–311, 2000. Elsevier.
S. MORI. Effects of Carbon Emission Mitigation Options Under Carbon Concentration Stabi-lization Scenarios. 2000. Springer.
S. Mori and M. Takahashi. An Integrated Assessment Model for the Evaluation of New Energy Technologies and Food Productivity. International Journal of Global Energy Issues, 11(1-4): 1–18, 1999.
M. Morrison and M. S. Morgan. Models as Mediating Instruments. IDEAS IN CONTEXT, 52: 10–37, 1999. Cambridge University Press.
MPICH2. MPICH2. (webpage), 2012. URLhttp://www.mcs.anl.gov/research/projects/ mpich2/. (Accessed Apr, 2012).
NASA. MODIS (Moderate Resolution Imaging Spectroradiometer). (website), 2012. URLhttp: //modis.gsfc.nasa.gov/data/. National Aeronautics and Space Administration. (Accessed Apr, 2012).
NCBI. Nucleotide. National Center for Biotechnology Information. (website), 2012. URL http://www.ncbi.nlm.nih.gov/sites/entrez?db=nucleotide. U.S. National Library of Medicine. Bethesda, MD, USA. (Accessed Apr, 2012).
C. Negus.Linux Bible 2010 Edition: Boot Up to Ubuntu, Fedora, KNOPPIX, Debian, OpenSUSE, and 13 Other Distributions, volume 682. Wiley Publishing, Inc., 10475 Crosspoint Blvd., Indianapolis, IN 46256, 2010. ISBN 978-0-470-48505-7.
NERSC. National Energy Research Scientific Computing (NERSC) Center. (website), 2012. URL http://www.nersc.gov/users/science-gateways/. Office of Science, U.S. Department of Energy. (Accessed Apr, 2012).
W. Nordhaus. Economics. Critical Assumptions in the Stern Review on Climate Change.Science (New York, NY), 317(5835):201, 2007.
W. Nordhaus. DICE Model Discussion as of March 2012. (website), Mar 2012. URL http: //nordhaus.econ.yale.edu/DICE2007.htm. (Accessed Aug, 2012).
W. D. Nordhaus. A Question of Balance: Weighing the Options on Global Warming Policies. Yale University Press, 2008.
OSeMOSYS. OSeMOSYS: The Open Source Energy Modelling System. (website), 2012. URL http://osemosys.org/. (Accessed Aug, 2012).
PETSc. Portable, Extensible Toolkit for Scientific Computation. (website), 2012. URL http://www.mcs.anl.gov/petsc/. (Accessed Apr, 2012).
C. M. Pilato, B. Collins-Sussman, and B. W. Fitzpatrick. Version Control with Subversion. O’Reilly Series. O’Reilly Media, Inc., 2008. ISBN 978-0-596-51033-6.
J. Ravetz. Models as Metaphors. Public Participation in Sustainability Science: A Handbook, page 62, 2003. Cambridge University Press.
R. Read. How to Be a Programmer. (webpage), 2003. URL http://samizdat.mines.edu/ howto/HowToBeAProgrammer.html. (Accessed Jul, 2011).
RES. The Economic Journal Data Policy. (webpage), 2012a. URL http://www.res.org.uk/ view/datapolicyEconomic.html. Royal Economic Society (RES). (Accessed Apr, 2012).
RES. The Econometrics Journal Data Policy. (webpage), 2012b. URL http://www.res.org. uk/view/datapolicyEconometrics.html. Royal Economic Society (RES). (Accessed Apr, 2012).
J. Rotmans. Methods for IA: The Challenges and Opportunities Ahead. Environmental Modeling and Assessment, 3(3):155–179, 1998. ISSN 1420-2026. doi: 10.1023/A:1019019024003. URL http://www.springerlink.com/content/xq6r30312ww26133/abstract/.
S. H. Schneider. Integrated Assessment Modeling of Global Climate Change: Transpar-ent Rational Tool for Policy Making or Opaque Screen Hiding Value-Laden Assump-tions? Environmental Modeling and Assessment, 2(4):229–249, 1997. ISSN 1420-2026. doi: 10.1023/A:1019090117643. URL http://www.springerlink.com/content/ w0700w6825080287/abstract/. Springer.
M. Schwab, N. Karrenbach, and J. Claerbout. Making Scientific Computations Reproducible.
Computing in Science & Engineering, 2(6):61–67, 2000. IEEE.
Deep Sky. The Deep Sky Project. (website), 2012. URL http://deepskyproject.org/. (Accessed Apr, 2012).
N. Stern and C. Taylor. Climate Change: Risk, Ethics, and the Stern Review. Science-New York the Washington-, 317(5835):203, 2007. American Association for the Advancement of Science.
TES. Editorial Procedures and Policies of Econometrica, Revised 2011. (webpage), 2012. URL http://www.econometricsociety.org/submissionprocedures.asp#replication. The Econometrics Society (TES). (Accessed Apr, 2012).
H. Turton and L. Barreto. The Extended Energy-Systems ERIS Model: An Overview. Interna-tional Institute for Applied Systems Analysis, (IR-04-010), 2004. Laxenburg, Austria.
UCAR. Community Earth System Model (CESM). (website), Aug 2012. URL http://www. cesm.ucar.edu/. University Corporation for Atmospheric Research (UCAR).
D. van Heesch. Doxygen: Source Code Documentation Generator Tool. (website), 2012. URL http://doxygen.org/. (Accessed Aug, 2012).
J. P. Weyant. A Perspective on Integrated Assessment. Climatic change, 95(3):317–323, 2009. Springer.
XSEDE. Extreme Science and Engineering Discovery Environment. (website), 2012. URL https://www.xsede.org/gateways-overview/. (Accessed Apr, 2012).
Chapter
2
Modeling for Insight Using Tools for Energy
Model Optimization and Analysis
2.1
An Open Model and Framework
With a codified set of recommendations for a transparent modeling process articulated in chapter 1, I have built an open source modeling framework: Tools for Energy Model Optimization and Analysis (Temoa). The heart of the project is a technology explicit EEO model, detailed in §2.3. Temoa aims to address the issues of verification and uncertainty quantification by meeting the following objectives:
1. institute a transparent process for EEO model development and application that enables independent third party verification, and
2. generate new insights into energy systems at the national and global scale through rigorous uncertainty analysis.
Section 2.2 describes how Temoa will meet these two research objectives. Section 2.3 gives an overview of the model’s algebraic formulation, §2.4 describes the software used to implement the Temoa formulation, and§2.5 presents a verification exercise based on careful comparison to a simple MARKAL dataset.
2.2
The Temoa Framework
2.2.1 Transparency
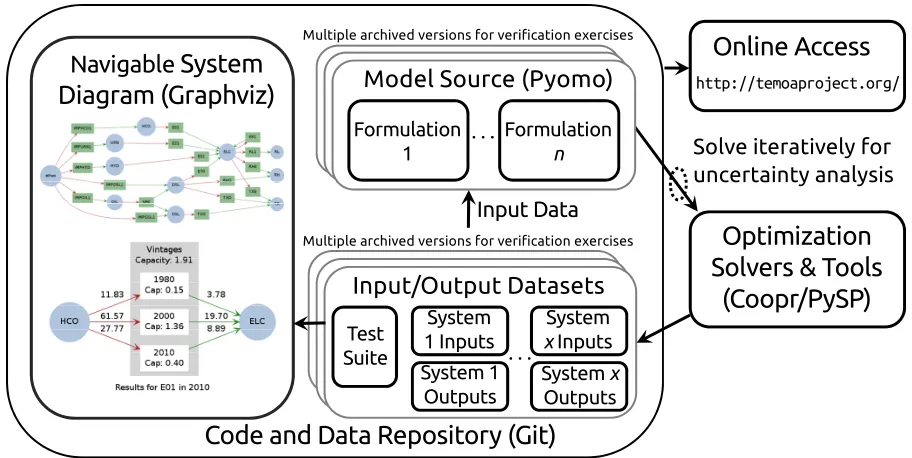
To inform our approach to model transparency, the software engineering practices employed by three large scale scientific software projects were investigated: MPICH2, a high performance parallel programming library (Balaji et al., 2011); the Portable, Extensible Toolkit for Scientific Computation (PETSc), a parallel differential equations solver library (Balay et al., 2011); and the Community Earth System Model (CESM), a fully-coupled, global climate model (UCAR, 2012). Based on careful review of these projects, the Temoa framework has been designed to include the following features: (1) a public, web-enabled interface to model source code and data, (2) developer documentation to encourage community contributions, (3) an avenue for user and developer interaction, and (4) software utilities to visualize output.
Revision Control
The Temoa project provides public, web-enabled access to a revision control system (RCS), which provides the means to digitally store a complete archive of code changes (i.e. “commit” or “change” histories). Best practices suggest the developer briefly summarize each commit to the repository. The resultant electronic archive enables structured development and provides an audit trail that enhances transparency for both Temoa developers and users.
The choice of an RCS is important to developers for whom it is a daily interaction. The MPICH2 project uses Subversion (Pilato et al., 2008) and the PETSc project uses Mercurial (O’Sullivan, 2009). Temoa uses Git (Chacon, 2009), a distributed RCS (DRCS). Because it stores an entire copy of the repository locally on the developer’s machine, Git offers an order of magnitude (or more) speed increase over SVN’s latent network dependency for common interactions. Mercurial is also a DRCS with comparable speed, but it is slightly inflexible for Temoa’s development needs. Git also affords many publicly available services and tools (e.g., github.com), as well as the strength of the various development communities (e.g. the Linux kernel community).
customize model functionality (Howells et al., 2011).
Documentation
While public access to code and data enables interested parties to interrogate the model, it will remain largely opaque in the absence of well-designed user documentation. I have implemented auto-generated documentation that fuses comment blocks in the source code with a clear narrative description. As described below in §2.4, the Temoa model has been implemented in Python (Lutz, 2009). Python stores object comments in a special member variable, allowing third party tools to dynamically introspect a code base to generate documentation accessible to end users. In Temoa, comments interspersed in the source code contain LaTeX (Lamport, 1986) formatted algebraic formulations of associated equations that are automatically queried and combined with a separate descriptive narrative to dynamically create end-user documentation. The latest documentation is available on the project website (Hunter et al., 2012). This streamlines the documentation effort by allowing developers to focus on embedding descriptive comments in the source code, thereby reducing discrepancies that arise from maintaining multiple forms of documentation.
Communication and Interaction
A successful open source model must provide a means for users and developers to interact. The developers of PETSc and MPICH2 are highly responsive to user’s queries on their traffic-intensive mailing lists (Balaji et al., 2011; Balay et al., 2011). While currently Temoa is not as high a profile venture as these other well-established projects, it does have an online forum for communication among developers as well as interaction with end users.1
Visualization
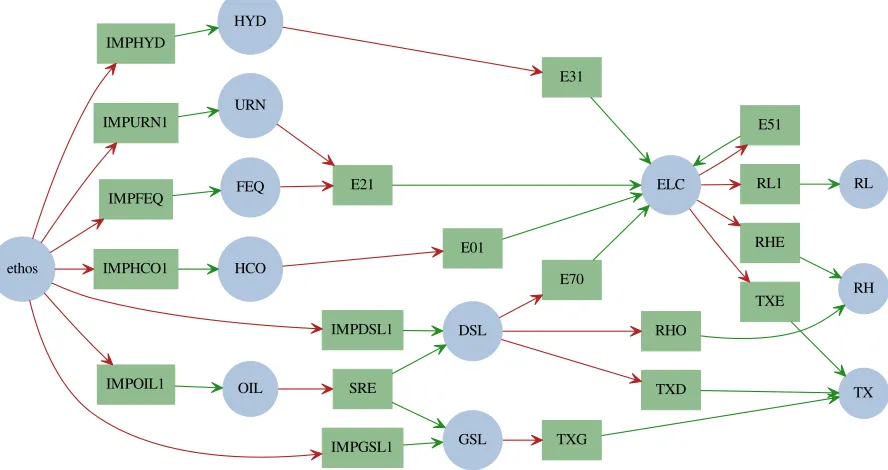
Both PETSc and CESM include visualization tools to help users interrogate model behavior. In Temoa’s case, model accessibility and transparency relies in part on the capability to visualize the energy system network under consideration. To meet this need, Temoa employs an open source graphics package called Graphviz (Ellson et al., 2002) to dynamically generate an energy system map at model runtime. The Graphviz layout programs take descriptions of graphs in a simple text language, and create diagrams in several formats. Graphviz operates on a text file produced at model runtime that describes the nodes and edges within a given graph. Figure 2.1 provides an illustrative energy system map. Temoa also generates a set of navigable output graphics by model time period that superimpose the resultant commodity flows and technology
1
capacities on the graph. In addition to the output graphic, the Graphviz text input provides an auditable record of model output that can be used for debugging and verification purposes.
2.2.2 Replication of Model Results
The RCS serves another important objective: to archive “snapshots” of source code and data used to produce published model analysis. To my knowledge, Temoa is the first EEO modeling effort to publicly archive electronic versions of source code and data used to produce published analysis, providing third parties with the opportunity to precisely replicate any Temoa-based published results. While other open source models exist (Howells et al., 2011; Kainuma et al., 1998; Nordhaus, 1993), none publicly archive source code and data in a consistent manner that enables precise replication of published results by third parties.
2.2.3 Uncertainty Analysis
Many prior efforts have made future uncertainty the focus of model-based analysis (Kanudia and Loulou, 1998; Gritsevskyi and Naki´cenovi, 2000; Labriet et al., 2008). The Temoa project is, however, the first EEO model of its kind to be designed for operation in a high performance computing environment. Model design for a multi-compute node, multi-core environment significantly expands the capability to perform sensitivity and uncertainty analysis.
First, Monte Carlo simulation to test the sensitivity of key outputs to inputs can be set up as an embarrassingly parallel2problem, in which a batch of model runs is performed simultaneously on multiple processing cores. Second, the use of distributed memory and cores in a parallel computing environment can significantly extend the ability to perform stochastic optimization. Multi-stage stochastic optimization embeds the probability of different outcomes within the model formulation via specification of an event tree (Loulou and Lehtila, 2007), which yields a near term hedging strategy that accounts for future uncertainties. Such hedging strategies yield insight relevant to policy makers, investors, and planners, who must make decisions before uncertainty is resolved (Holthausen, 1979). The complexity of event trees is often limited by the computational difficulty in solving the extensive form of the problem specification with classical solution methods. While stochastic optimization has been applied to energy system models, the model complexity and computational requirements have limited analysis to relatively simple probability trees. For example, Kanudia and Loulou (1998) implemented 8 scenarios across 3 time stages, Loulou and Kanudia (1999) implemented 5 scenarios across 2 time stages, Labriet et al. (2008) implemented 8 scenarios across 2 time stages, Bosetti and Tavoni (2009) implemented 3 scenarios across two stages, and Babonneau et al. (2012) implemented 4 scenarios
2In parallel computing, an “embarrassingly parallel” task is a workload that requires only minimal effort to