The influence of the conversion medium stream on the
gasification process of olive pits
Danuta Król1,*, Sławomir Poskrobko2
1Silesian University of Technology, Gliwice, Poland 2Białystok University of Technology, Białystok, Poland
Abstract. The paper presents the results of research on gasification of olive pits and production of a generator gas with calorific value enabling its combustion in microturbines. Gasification was carried out in a laboratory gasification reactor, where the converting factor was air. The influence of the flow rate of its stream on the composition of the generator gas was investigated. The research involved searching for optimal process conditions for gasification of this biomass, to obtain a generator gas with an increased CH4 content (methane is the most calorific component).The air flow in subsequent tests was 0.5m3/h, 0.85m3 /h, 1.1m3/h,. 1.4m3/h 1.7m3/h. The quantitative composition of the generated generator gases differed. These conditions were obtained with an air flow of 1.4m3/h, in a tubular reactor, at the bed temperature T
3 = 456-462oC. A gas was obtained, with a calorific value of 9.2MJ/m3, characteristic for the following gas composition: H2=3.88%, CO=18.52%, CO2=6.27%, CH4=16.02%, O2=1.28%..
1 Introduction
This paper discusses the possibilities of energy use of olive seeds as a biomass fuel in the gasification process. These wastes in southern European countries (such as Greece, Spain, Italy, Turkey) and North Africa (Morocco and Tunisia) represent a significant potential of renewable fuel. The area of olive cultivation is close to 11 million ha. For examp le, the article [1] states that Spain is the main producer of olives in the world. In 2010-2015, the average annual olive production in Spain amounted to 517.000 Mg, which accounted for 32.4% of world production and 75% of production in Eu rope. Olives production increases on all continents. According to FAO 2015, the production of olive oil in the world in 2013 exceeded 20.000.000 Mg. These data indicate that olive waste represents a significant potential of renewable fuel in local fuel markets [2]. Considering that, the research centers in these countries undertake activities aimed at identifying the suitability of waste fro m the production of olive oil (including seeds) for local energy needs. The key high-efficiency way of using these wastes is their combustion [3,4,5]. Because these wastes are of agricultural origin, in their composition we can expect higher content of alkali metal chlorates, mainly KCl. These compounds have an adverse effect on the structure of ash, causing it to soften at as low as 700°C [6]. Lo w ash softening temperature contributes to increased P10 dust emission [7] co mpared to wood biomass. At the same time, it causes volatile dust to settle on the walls of the furnace, which results in the formation of high-temperature chlorine corrosion outbreaks of steel structural elements [8].
Considering operational problems, despite achieving high efficiency, burning of olive pits -like other agricultural waste-is not widespread. Therefore, there is a need to look for new high-efficiency technologies for using this fuel for local energy needs. Therefore, in the field of laboratory research, efficient technologies for generating energy from these wastes are sought. The research activity was directed at identification of gasification processes. These processes take place at lower efficiencies and lower temperatures. Reduced temperatures, when using agro biomass, significantly reduce the ash softening processes. In the paper [9], the results of the research on fluidised gasification of waste fro m o live p rocessing were presented. The efficiency of the process was tested depending on the temperature of the bed and the most effective process took place at a temperature of 850oC where the LHV (calorific value of
gas) was 5.87MJ/kg. The kinetics of the gasification process of residues from the production of olive o il (orujillo), using the TGA method, was analyzed at various temperatures (800-950oC) and various pressures (0.20-0.35-0.50bar) of the gasifying agent CO2 [10]. The
reactivity of the residue relative to the gasification agent CO2 increased with increasing pressure and decreased
overview of the technology of olive mill solid waste energetic usage, where they pay a lot of attention to gasification processes. The authors of the review point to a nature of gasification technology to similar [11]. Gasification was carried out at temperatures of 800– 950oC. The main co mbustible co mponents were CO i H2.
The share of CH4 was within 2-5%, and the gas had a
calorific value of LHV=4-6 MJ/m3.
In this paper, the authors present a new technology of air gasification of olive seeds. The process is conducted under ambient pressure. The new gasification technology will make it possible to obtain fro m olive seeds a syngas with higher proportion of methane. The increased share of methane as a gas with a high LHV calorific value, will significantly increase the LHV calorific value of syngas. Process tests are carried out on a laboratory scale.
2 Experimental setup
Bio mass of crushed olive oil was used for the gasification process (Table 1). Table 1 show the fuel and the physicochemical properties-PN-EN-ISO 18134-2:2015-11; PN-EN-ISO 9029:2005; PN-ISO 1171:2002 and chlorine gram fraction was denoted in compliance to Polish Standard PN-ISO 587/2000, LHV-PN-ISO 1928:2002. Elemental co mposition of the flammable substance-carbon (C), hydrogen (H), nitrogen (N), sulfur (S) has been determined with the use of elemental analyzer CHNS, model 2400, series II by Perkin Elmer.
Table 1. Elemental composition of dry mass of surveyed fuels
and its LHV calorific value
Moisture
[%] 4.97
Inflammable fraction
[A%dry m.] 6.35
Flammable fraction
[%dry m.] 93.65
C [%] 52.09
H [%] 3.67
N [%] 1.21
S [%] 0.03
Cl [%] 0.42
O [%] 41.58
LHV
[MJ/kg dry m.] 24.04
The gasification process was carried out on a laboratory scale in the gas gasifier shown in Fig. 1.
Gasification was carried out in a 1.5kW gasifier (Fig. 1) and dimensions: internal diameter of the reaction chamber dr1=70 mm, external d iameter dr2=75mm and total height h=800 mm, insulation layer thickness 60
mm, sieve grid with holes of diameter φ =2 mm, grid thickness g=5 mm and height of the air chamber ha=70 mm.
Fig. 1. Experimental setup. 1-reaction chamber, 2-fuel feeder, 3- air blower and regulation system, 4-grate, 5-syngas outlet, 6-syngas pipeline (6-syngas sampling point), 7-monitoring of flows and temperatures, 8-biomass fuel, 9-thermal insulation, 10-temperature sensors, 11-air flow measurement m3/h.
1.1m3/h, 1.4m3/h 1.7m3/h . The fuel flow was 0.37kg/h.
The temperature of the blowing air was 20°C. Gasification took place on the grate, in the fuel layer. Above the gas phase (over the fuel layer), in the atmosphere of unreacted oxygen, tar and oil vapors from the gasified olive pits were partially burned. This ensured autothermality of the process and caused the temperature to rise to T=~ 800°C. At this temperature, unburned organic vapors were cracked to form CH4
[12,13].
The fuel was fed into the reaction chamber in a continuous manner by means of a screw feeder. The ash fro m the grate was removed during the process by blowing the grate with air. The measurement of concentrations of gaseous gasification products (CO2,
CO, O2, H2, CH4) was made using the GAS 3000 gas
analyzer. The calorific value of syngas was determined according to the dependence 1 [13]:
LHVsyngas = XH2LHVH2 + XCOLHVCO + XCH4LHVCH4 (1)
where :XH2 – share of hydrogen in the syngas; XCO –
share of carbon monoxide in syngas, XCH4 – share of
methane in the syngas.
3
Results and discussion
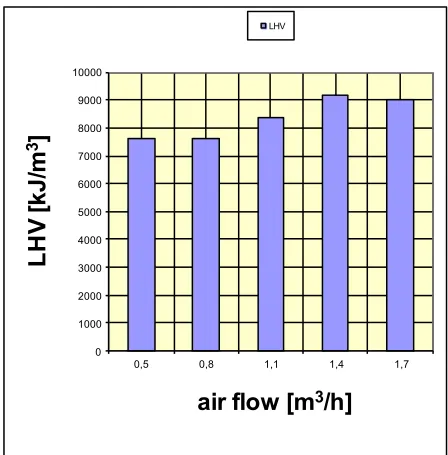
The results of research on the olive oil gasification process are shown in Fig. 2–Fig. 6. The basic test results indicating the efficiency of the process are shown in Fig. 2, where the concentration values of gasification products (CO, CH4, H2, CO2) depend on the flux gasifier
stream value, th is is the air supplied to the reactor.
0 1000 2000 3000 4000 5000 6000 7000 8000 9000 10000
0,5 0,8 1,1 1,4 1,7
L
H
V
[k
J
/m
3
]
air flow [m
3/h]
LHV
Fig. 2. The calorific value of the syngas, characteristic for different gas streams.
In this way, the process-relevant quantity (i.e. the air stream) was determined, at which syngas of different calorific value was obtained - Fig. 2. The great calorific value of the gas expressed by the LHV calorific value,
was determined mainly by the share of the most calorific CH4 component in the synthesis gas.
The experiment confirmed the results of previous researches of the authors [8, 13, 14, 15], carried out with the use of other biomass fuels and RDF fuel. A characteristic feature of the methanation process are hydrogenation reactions, occurring efficiently at temperatures of 300-5000C:
CO+3H2→CH4+H2O (2) CO2+ 4H2→CH4+2H2O (3) C+2H2→CH4 (4)
The formation of CH4 was accompanied by a drop in the
shares of CO and CO2 as well as H2. These processes
occurred in the fuel layer (area III, Fig 1) under the temperature conditions characteristic for zone III - the gasification zone (Table 1). In this zone methanation (hydrogenation) process took place.
Table 2. Temperature distribution in the gasifier
Stream of gasificati
on air [m3/h]
Temp. in zone II
[oC]
Temp. in zone III
[oC]
Temp. in zone IV
[oC]
Temp. in zone V
[oC]
0.5 865 456 742 763
0.8 878 462 751 768
1.1 841 437 815 834
1.4 834 428 823 842
1.7 856 542 862 871
0 5 10 15 20 25 30
0,5 0,8 1,1 1,4 1,7
C
O
, C
H
4, H
2
, C
O
2[%
]
air flow [m
3/h]
CO CH4 H2 CO2
Fig. 3. The effect of changes in the gasifier stream value on the value of gaseous products.
value-9.2MJ/n m3. The increase in the air stream directed
the process towards the combustion reaction. This was evidenced by an increase in CO and CO2 and a decrease
in the concentration of CH4 in the gas fraction (Fig. 3).
In zone II-above the grate, in contact with the excess blowing air, there occured a process of fuel co mbustion, which is why high temperatures of 856– 878oC (Table 1) were maintained (Table 1). In area IV in excess of oxygen (Fig. 4), the increase in temperatures and then their decomposition suggest, that there was a process of partial co mbustion of combustible organic vapor fractions, including tars.
0 0,2 0,4 0,6 0,8 1 1,2 1,4
0,5 0,8 1,1 1,4 1,7
O
2[%
]
air flow [m
3/h]
OFig. 4. Share of oxygen in synthesis gas.
At this temperature, unburned organic vapors were cracked to form CH4 [12,13]. The possibility of cracking
tars (at temperatures related to their partial co mbustion in area IV) and the production of secondary gases, can be modelled using reactions [12,16]:
Tar (CmHn Oj) →υH2 H2 + υCH4 CH4 + υCO2 CO2 + υCO
CO + υH2O H2O (5) Stoichio metric coefficients are included, for example, in
articles [17,18].
Considering the mechanism of reaction (5), a part of the methane component found in the synthesis gas can be formed in zone IV.
Similar heating values of syngas LHV=9.41 MJ/m3 were obtained in [19]. In the air environ ment, the Authors gasified the olive tree cuttings and olive kernels. The priority product in terms of syngas composition was hydrogen, which share in the syngas was about 30%. The share of methane, the most calorific co mponent of gas, was about 10%. The process was carried out at a changing temperature of 750-950oC in a fluid ized bed. The gasification of olive kernels is also discussed in [20]. The authors obtained synthesis gas, which was characterized by a high hydrogen content (about 25%), while the methane share was 4%. The process was carried out at temperatures of 750-850oC, using air as a
gasifying agent. Methanation reactions, due to the high temperature in the fuel bed, did not occur with sufficient efficiency. It should be noted that in [19, 20] the authors obtained an increased share of the CH4 component
(relative to, for examp le, gasification of fuels from wood biomass) [21,22].
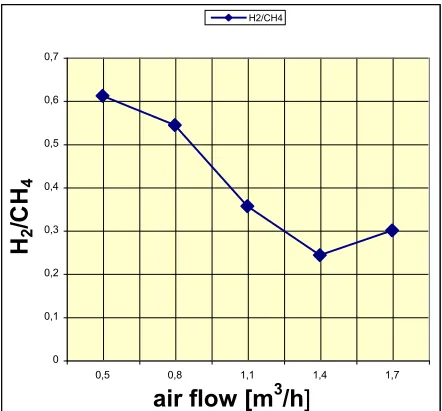
Figures 5, 6 and 7 present an indicator characteristic for methanation reactions - secondary reactions of the gasification process. Methanation reactions lead to higher methane content in syngas.
0 0,5 1 1,5 2 2,5 3 3,5
0,5 0,8 1,1 1,4 1,7
air flow [m
3/h]
C
O
/C
H
4CO/CH4
Fig. 5. Characteristics of the methanation process - the degree of conversion of CO to CH4.
Gas products CO, CO2, H2 formed in the primary
gasification reactions, are involved in the methanation processes. The indicator characteristic of the process is a dimensionless quantity.
0 0,1 0,2 0,3 0,4 0,5 0,6 0,7
0,5 0,8 1,1 1,4 1,7
air flow [m
3/h
]
H
2/C
H
4H2/CH4
This size was defined as the ratio of the gaseous products of the gasification process (in this case CO, CO2, H2
being the substrates for the methanation reaction), to the product of these reactions, i.e. methane. The concentrations of these substrates are exp ressed in% vv. Fig. 5 shows the CO/CH4 ratio as a function of the
gasifier stream (air) flow, fluctuating in the range from 0.5 to 1.7 m3/h. Accordingly, Fig. 6 shows the H2/CH4
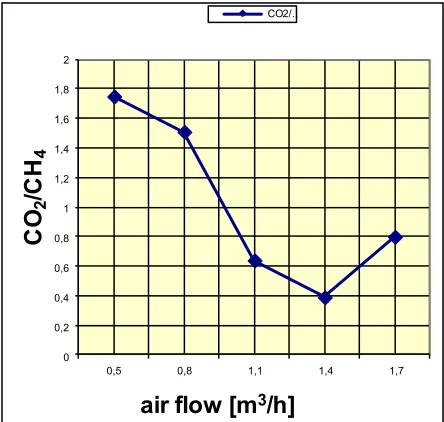
ratio and Fig. 7 the CO2/CH4 ratio. Temperatures
relevant for the methanation process concern zone III [12], where kinetic conditions favor the processes of CO and CO2 hydrogenation, in the direction of obtaining
CH4.
The indicator characteristics obtained in the experiment relate to the gasification factor of air and temperatures in the range of zone III (according to the data in Table 1) and the process taking place under atmospheric pressure.
0 0,2 0,4 0,6 0,8 1 1,2 1,4 1,6 1,8 2
0,5 0,8 1,1 1,4 1,7
CO
2
/C
H
4air flow [m
3/h]
CO2/…Fig. 7. Characteristics of the methanation process - the degree of conversion of CO2 to CH4
Generalizing the problem, such characteristics may be determined for gasification processes occurring at elevated pressure or in other gasification environments, such as: O2, CO2,water vapor, exhaust gases.
In the cases considered in Figures 5-7, methanation indicators in gasification processes: CO/CH4 = 3.1 – 1.2,
CO2/CH4=1.8-0.4 and H2/CH4=0.6 to 0.25 show, that in
the range of the value of blowing air flow 0.5-1.4m3/h,
there are conditions favorable for the formation of CH4
(in the zone of temperatures characteristic for zone III - Table 1). For air flo w 1.4-1.7m3/h, the value of indicators increases.
Fro m the range of CO/CH4 ratio values (Fig.5) it can be
concluded, that a catalyst is needed to intensify the CO methanation reaction (to increase its speed). The CO2/CH4 index values (Fig.7) show, that the CO2
methanation reaction can proceed at a s ufficient rate. Low H2/CH4 values are the effect of high H2 reactivity
in CO and CO2 to CH4 transformations.
4 Conclusions
Agriculture waste biomass in the form of olive pits represent a significant energy potential as an alternative fuel in the countries of southern Europe and North Africa. Considering this fact, the presented research shows the possibility of effective use of this biomass in energy processes. In this context, one can talk about energy recycling. The research involved searching for optimal process conditions for gasification of this biomass, to obtain a generator gas with an increased CH4
content (because methane is the most calorific component). The gasification process was carried out in the atmosphere of the air gasification agent and atmospheric pressure. These conditions were obtained with an air flo w of 1.4m3/h, in a tubular reactor, at the
bed temperature T3=456-462oC. A gas was obtained,
with a calorific value of 9.2MJ/m3, characteristic for the following gas composition: H2=3.88%, CO=18.52%,
CO2=6.27%, CH4=16.02%, O2=1.28%. The gasification
process includes the possibility of methane generation in the cracking process of organic vapors, including tar over the fuel layer (zone III), where the temperature reached the values T4=742-823oC. The increase in
temperature was caused by burning of some combustible components of organic vapors, the remaining part was subject to the cracking process. The increased CH4
content in the synthesis gas, and the reduced H2 content
allo ws gas transport through the pipeline and its storage in tanks. The reduced content of H2 and elevated CH4
stabilizes combustion of syngas in a laminar flame
.
The authors would like to thanks the Silesian University for their financial support under pro-qualitative grant (Ref. No. 08/030/RGJ18/0044)
References
1. E. Christoforou, P .A. Fokaides, WASTE MANA GE., 49, 346-363 (2016)
2. F. J. Lopez., S. Pinzi, J. Ruiz, A. Lopez, M. P. Dorado, FUEL 89, 1386-1391 (2010)
3. A. Ru iz Celma, F. López-Rodríguez, APPL. THERM. ENG. 29, 3394–3400 (2009)
4. E.D. Vicente, M.A. Duarte, L.A.C Tarelho, T. F. Nunes, F. A mato, X. Querol, C. Co lo mbi, V. Gianelle, C. A. Alves, ATMOS. ENVIRON. 120, 15 -27 (2015)
5. H. Topal, T. Taner T., S.A.H. Naqvi, Y. A ltınsoy, E. Amirabedin, M. Ozkay mak, ENERGY 140, 40-46 (2017)
6. S. Arvelakis, H. Gehrmann, M. Beckmann, E. G. Koukios,BIOMASS BIOENERG. 22, 55–69 (2002) 7. E. D. Vicente, M. A. Duarte, L. A. C. Tarelho, T.,F.
Nunes, F. A mato, X. Querol, C.Colo mb i, V. Gianelle, A.C. Alves, ATMOS. ENVIRON. 120, 15-27 (2015) 8. D. Król., A. Borsukiewicz-Go zdur, S. Poskrobko,
DREWNO, 59, 1-8 (2016)
10. P. Ollero, A. Serrera, R. Arjona, S. Alcantarilla, BIOMASS BIOENERG. 24, 151-161 (2003)
11. J. F. Gonzalez, S. Ro man, G. Engo, J. M. Encinar, G. Martınez, BIOMASS BIOENERG. 35, 4324-4330 (2011)
12. D. Kró l, S. Poskrobko, ENERG. FUEL 31, 3935-3942 (2017)
13. D. Król, S. Poskrobko, ENERGY 116, 592-600 (2016)
14. S. Poskrobko, D. Król, A. Borsukiewicz-Go zdur, DREWNO 59, 241-248 (2016)
15. D. Kró l, G. Gałko, PRZEM. CHEM. 96, 2, 341-342 (2017)
16. F. J. A larcón-Gaete, J. C. Elicer-Cortés, J. ADV. THERM. SCI. RES. 3, 46-57 (2016)
17. C.Di Blasi, AICh E J. 50: 2306-2319 (2004)
18. J. Rath, G. Staudinger, FUEL 80, 1379-1389 (2001) 19. V. Skoulou, A. Zabaniotou, G. Stavropoulos., G.
Sakelaropoulos, INT. J. HYDROGEN ENERG. 33, 1185 – 1194 (2008)
20. V. Skoulou, G. Koufodimos, Z. Samaras., A. Zabaniotou, INT. J. HYDROGEN ENERG. 33, 6515 – 6524 (2008)
21. M. Vaezi , M. Passandideh-Fard , M. Moghiman, FUEL PROCESS. TECHNOL. 98, 74– 8 ((2012) 22. L. Liu, Y. Huang, J. Cao, Ch. Liu, L. Dong, L. Xu, J.