Lev Timofeevaand Anatoly Ivanovb
The Yu.G. Shafer Institute of Cosmophysical Research and Aeronomy, Russia
Abstract. A proposed new method for measuring the cherenkov light from extensive air showers (EAS) of cosmic rays (CR), which allows to determine not only the primary particle energy and angle of arrival, but also the parameters of the shower in the atmosphere – the maximum depth and “age”. For measurements it is proposed to use Cherenkov light produced by EAS in a ground network of wide-angle telescopes which are separated from each other by a distance 100–300 m depending on the total number of telescopes operating in coincidence, acting autonomously, or includes a detector of the charged components, radio waves, etc. as part of the EAS. Results of such an array should be developed. The energy measurement and CR angle of the arrival data on the depth of the maximum and the associated mass of the primary particle generating by EAS. This is particularly important in the study of galactic cosmic ray for E>1014eV, where currently there are
no direct measurements of the maximum depth of the EAS.
1. Introduction
Investigation of Cherenkov light induced by cosmic rays (CRs) in the atmosphere began in the middle of the previous century in the UK and USSR. An exhaustive description of early developments is given in the book [1], while recent reviews of the whole area are given, e.g., in Refs. [2,3].
It was realized then that the angular and temporal structure of the Cherenkov light emitted by extensive air shower (EAS) can be used to infer the longitudinal development parameters of the shower [4–7]. the angular distribution of Cherenkov photons from EAS was calculated by V.I. Zatsepin [4] assuming it was determined mainly by that of the electrons in the shower. Then Fomin and Khristiansen proposed [5] to use the pulse shape of the Cherenkov signal, namely the pulse width, to indicate the shower maximum position, Xmax, in the atmosphere.
Experimental measurements of the Cherenkov signal pulse shape were made initially in Yakutsk and at Haverah Park [6,7]. The results were used not only to estimate Xmax
but attempts were made to evaluate cascade parameters of electrons at CR energies around 1017 eV [7,9]. A variety of detectors are used then, for instance, at the Tunka experiment forming an array of Cherenkov detectors functioning currently near Lake Baikal [10].
Our intention to develop a Cherenkov telescope functioning as a differential detector of EAS was motivated by the possibility to measure the depth of the cascade maximum and/or the shower age via angular and temporal distributions of the Cherenkov signal [8]. Combining Xmax
and the shower age with other characteristics measured with surface detectors of the EAS array, e.g. the energy
ae-mail:[email protected] be-mail:[email protected]
and muon content, one is able to estimate the average mass composition of CRs. Experimental arguments in elucidating the origin of the knee and ankle in the CR spectrum will significantly strengthen due to the measurements of the angular and temporal distributions of the Cherenkov signal in the energy range above 1015eV. Existing scenarios of CR acceleration in the
sources are different in the expected model composition around the knee and in the transition region between galactic and extragalactic components [11]. So an accurate estimation of the average mass of the CR nuclei in addition to improved measurements of the sharpness of the knee and ankle should allow us to discriminate some scenarios. The PMT in such a prototype telescope is used as the observing camera and placed at the focal length in front of a spherical mirror see Fig. 1. Since the radius of the photocathode R2486 equals 3 cm, the mirror diameter was chosen to be 26 cm with a radius of curvature of 22.5 cm. Mirror parameters have been chosen from considerations to ensure as wide a field of view as possible, but so that possible distortions do not exceed the pixel size, 3.8 mm. As a result, the width of the field of view is
−14◦≤α≤14◦.
2. Data acquisition system
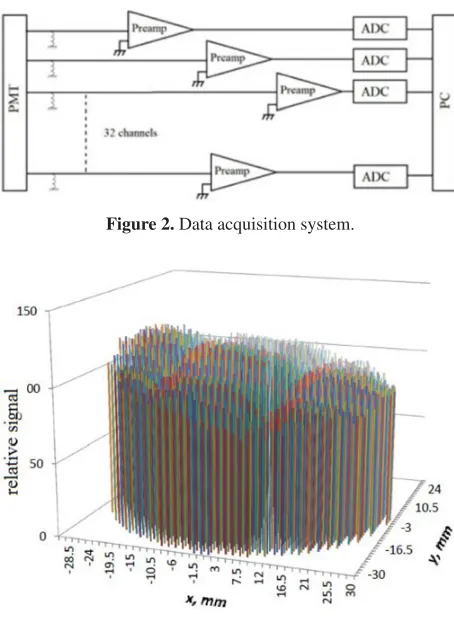
The signals from each channel of the multi-anode PMTs continuously input to preamplifiers and onwards to the Analogue to Digital converters and stored in the buffer memory of a 32-channel industrial computer (Fig.2). On the arrival of a trigger generated by the EAS array, an industrial computer saves the accumulated pre-history as a separate file labeled with the time mark and the assignment of a serial number.
We carried out the photomultiplier sensitivity check from plastic scintillator in the voltage range from 900 to 1300 volts and obtained a coordinate-dependent sensitivity
Figure 1. Wide field of view Cherenkov telescope prototype.
Figure 2. Data acquisition system.
Figure 3. Normalized coordinate-dependent PMT sensitivity.
of the Photo Multiplier Tube from which a radial nonuniformity of sensitivity is seen in Fig. 3. We also measured the angular dependence of the telescope, the energy spectrum of telescope channels, and found that the Photo Multiplier Tube dark current is minimal at a voltage less than 1300 volts. Currently, the telescope is installed at the Yakutsk EAS array at station obscura-3 at a distance 500 meters from the center of the array, where the field test is run.
An example of the output signals from the multi anode PMT is shown in Fig. 4. The average number
Figure 4. Signals of 32 wires from the multi-anode PMT at the focus of the telescope. The EAS parameters in a particular shower are estimated using data of the surface detectors. Pulse durations (τ) are measured at 0.1, 0.5, 0.9 levels of the pulse maximum Vmax. The time difference (tmax) between Vmax and 0.1 Vmax of
the rising signal is shown in the right panel.
of channels triggered in the event, where the signal is definitely exceeds the noise level is 17±6. So we get a good accuracy of the pulse duration by means of several independent measurement channels.
3. Pulse duration as a function of the
distance to the shower core
Here we focus on the pulse shape parameters of the Cherenkov signal from EAS. The main feature of the Cherenkov signal is its rise time with the shower core distance due to geometrical reasons. The data was accumulated during the observation period from 2012 to 2015, when 2000 coincident EAS events were detected. A sample of showers is selected in the energy interval from 1016 to 1019eV. Additional cuts are applied to exclude
Figure 5. Energy distribution for EAS events detected by coincidence scintillation detectors of Yakutsk array and wide field of view Cherenkov telescope.
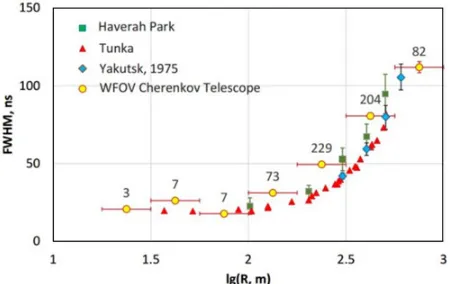
Figure 6. Full width at half-maximum of the Cherenkov signal as a function of the shower core distance, R, measured by EAS arrays.
The main feature of the signal is its rise time variation with the shower core distance due to geometrical reasons. The first measurements of the parameter were made in Yakutsk [12] and Haverah Park [13]. The most recent results are provided by the Tunka array [14]. Our measurement of the full width at half-maximum of the signal confirms the previous results (see Fig. 6). Event numbers are indicated above our data points. The energy ranges relevant are: Haverah Park (E)∼0.2 EeV; Yakutsk, 1975 E∈(0.001, 1) EeV; Tunka E∈(0.003, 0.03) EeV.
We analyzed the full width at half-maximum (FWHM) dependence on other shower parameters such as zenith and azimuth angles, and energy. No significant variation versus angles is found exceeding the instrumental errors. On the other hand, an indication of the energy dependence of the pulse width is found in our data. Application of the FWHM(R) function is possible in the shower core location procedure in the array plane. The method was pioneered by John Linsley [15] using charged particle signal width vs R. While in the Yakutsk array group the particle and Cherenkov photon density distribution functions are used to locate the shower core, the FWHM(R) function can be used additionally (or instead) to refine the core coordinates in the array plane. As an illustration, the signal width is shown as a function of energy in Fig. 7. A systematic variation of the width is visible, although the tendencies are contradictory in the shower core distance intervals. More data is needed, especially at distances to the shower core less than one hundred meters, to reveal the reliable energy dependence. Application of the FWHM(R)
Figure 7. Energy dependence of Full Width at Half-Maximum of the Cherenkov signal.
function is possible in the shower core location procedure in the array plane at least additionally to the Cherenkov photon density distribution.
4. Method to estimate the distance to
the shower maximum via cherenkov
light measurements
Common methods, which rely on Cherenkov light detectors to find the height in the atmosphere, hmax, where
the number of EAS particles reaches a maximum, are based on measurements of the lateral distribution of the photon density and pulse duration [16–18]. We propose another approach to evaluate hmax resulting from our
measurements of the Cherenkov light induced by EAS. Knowing the time delay of the Cherenkov signal maximum in the detector relative to the shower axis crossing the array plane at distance, R, one is able to calculate the distance, hθ, to the height in atmosphere, hmax, where
the emission of Cherenkov photons reaches a maximum. Other shower parameters needed are the coordinates of the shower axis and the EAS arrival angles. In our case, these parameters can be provided by the set of synchronized surface detectors of the Yakutsk array. The time difference, t , is determined by triangles consisting of R, hmax, hθ.
More information about this method can be found in the article [19].
ct =
h2
θ+R2−2Rhθsinθcosφ−hθ,
where φ, θ are shower arrival angles; c=0.3 m/ns. A solution is given by
hθ= 0.5(R
2−(ct )2)
ct+R sinθcosφ·
Figure 8. The height of Cherenkov light emission maximum as a function of time difference,t, between Cherenkov photons arriving at the detector and to the shower core in the array plane. The azimuth angle,φ, is between the detector and the shower axis projected on the array plane.
Figure 9. Estimation of the hmax reconstruction accuracy as a
function of the shower core distance. Different EAS core location and timing errors are given.
array modernization program now in progress includes the best part of the improvements needed. Specifically, a target synchronization accuracy of detectors will equal 5 ns due to Gigabit Ethernet via optical fibers. New scintillation counters and Cherenkov light detectors will provide the core location accuracy of showers within 15–20 m. Accordingly, the modernized array will be able to measure the Cherenkov Xmax to an accuracy of 3–4%,
if the time resolution of the Cherenkov light detectors will be better than 5 ns.
5. Conclusions
As part of the modernization program we developed two new integral Cherenkov telescopes, equipping them with the latest electronics we achieved a significant improvement in the time resolution, and combined them into the Cherenkov light registration system with adjustable zenith angle, to get information about the longitudinal shower development see Fig.10.
A new approach is explored in estimating the distance to the shower maximum based on the time difference between Cherenkov photons arriving at the detector and the shower core in the array plane. Fast optical detectors and a nanosecond-order synchronization system of the array detectors are essential in future implementations of
Figure 10. Integral Cherenkov telescope with Fresnel lens.
the method. A Cherenkov telescope prototype obtained experimental data for the period from 19.10.2012 to 11.04.2016, on 203 clear moonless nights with about 1500 hours of observation, during the observation of the master load 30,000 times, of which the Cherenkov telescope gave a signal to the coincidence of about 1200 times. Measuring the width at half-maximum as function of distance from the shower core, (R), will help determine the shower core in the array plane. Further modernization of the array will enable to calculate the height of the shower maximum by the time delay.
The work is supported in part by RFBR (grants 11-02-00158, 11-02-12193, 12-02-10005, 12-02-31550) and the Russian Ministry of Education and Science (contracts 02.740.11.0248, 16.518.11.7075). Grant NOFMU academic mobility and Head of Sakha Republic Grant for young scientist 17/16.
References
[1] J.V. Jelley, Cherenkov Radiation and its Applications (Pergamon Press, 1958)
[2] A.S. Lidvansky, Radiation Physics and Chemistry 75, 89 (2006)
[3] A.A. Watson,astro-ph/1101.4535
[4] V.I. Zatsepin, J. Exp. Theor. Phys. 47, 689 (1964) [5] Yu.A. Fomin and G.B. Khristiansen, Yad. Fiz. 14,
642 (1971)
[6] N.N. Kalmykov et al., J. Exp. Theor. Phys. Lett. 21, 66 (1975)
[7] R.T. Hammond et al., Nuovo Cim. C1, 315 (1978) [8] M.N. Dyakonov et al., Nucl. Instrum. Meth. A 248,
224 (1986)
[9] V.M. Grigorjev et al., J. Exp. Theor. Phys. Lett. 30, 727 (1979)
[10] S.F. Berezhnev et al., Nucl. Instrum. Meth. A 692, 98 (2012)
[11] E.G. Berezhko et al, Astropart. Phys. 36, 31 (2012)