Article
1
Low-power detection of food preservatives by a novel
2
nanowire-based sensor array
3
Dario Zappa 1,*
4
1 SENSOR Laboratory, DII, Università degli Studi di Brescia, Via Valotti 9, 25133 Brescia, Italy;
5
* Correspondence: [email protected]; Tel.: +39-030-371-5767
6
Received: date; Accepted: date; Published: date
7
Abstract: Food preservatives are compound that are used for the treatment of food to improve the
8
shelf life. In the food industry, is necessary to monitor all processes, for both safety and quality of
9
the product. An electronic nose (or e-nose) is a biomimetic olfactory system that could find
10
numerous industrial applications, including food quality control. Commercial electronic noses are
11
based on sensor arrays composed by a combination of different sensors, which include
12
conductometric metal oxide devices. Metal oxide nanowires are considered among the most
13
promising materials for the fabrication of novel sensing devices, which can enhance the overall
14
performances of e-noses in food applications. In the present work, is reported the fabrication of a
15
novel sensor array based on SnO2, CuO and WO3 nanowires deposited on top of commercial µHPs,
16
provided by ams Sensor Solutions Germany GmbH. The array was tested for the discrimination of
17
four typical compounds added to food products or used for their treatment to increase the shelf life:
18
ethanol, acetone, nitrogen dioxide and ozone. Results are very promising: the sensors array was able
19
to operate for long time consuming less than 50mW for each single sensor, and PCA analysis
20
confirms that the device was able to discriminate between different compounds.
21
Keywords: Metal-oxides nanowires; chemical sensing; sensor array; electronic noses, food
22
preservation;
23
24
1. Introduction
25
We all agree that nowadays we are living in the era of images, in which vision is considered the
26
most important of the human senses. Nevertheless, sometime we forget that vision is only one of the
27
five human senses (vision, hearing, olfaction, taste, and touch), and it cannot be always trusted alone.
28
Our interaction with the surrounding environment, and even our own survival, depend on the
29
combined information that we receive from all of them. Among these senses, olfaction is for sure the
30
most mysterious and complex one, even if historically has been considered of a lower status in
31
relation to the other senses [1]. Apparently, olfaction has lost in humans the importance that has in
32
animals, as it is often involved during prey hunting and feeding [2]. However, it is one of our innate
33
warning systems in case of danger, for example in case of fire. To give an idea on the importance of
34
the olfactory systems, almost the 4% of the genomes of many higher eukaryotes is devoted to encode
35
the proteins that are responsible of smell [3]. Olfaction is related also to cognition, as confirmed by
36
many studies [4]: a particular smell can trigger a series of memories in people. Human beings possess
37
an excellent ability to detect and discriminate odors, but they typically have great difficulty in
38
identifying particular odorants.
39
Artificial olfaction (also called an electronic nose or e-nose) is a biomimetic olfactory system [5–
40
7] that could find numerous industrial applications, such as indoor air & environmental monitoring
41
[8–10], hazardous gas detection & customs security [11,12], medical care [13–15] and food quality
42
control [16–18]. If we exclude the first prototype of a mechanical-based artificial olfaction system [19],
43
the concept of an electronic nose was developed in 1964 by Wilkens and Hatman [20], and then taken
44
up by Persaud in 1982 [21].
45
Among the large number of application of electronic noses, food quality and safety deserve a
46
special mention. We can identify at least two main area in the food industry that benefit from the use
47
of an artificial olfaction system. The first one is the detection of contaminants during food processing
48
chains [22–24]. The preemptive assessment of the source of contaminants during all the steps required
49
for food product preparation and handling is not always possible. Contaminating microorganisms
50
may enter and reach the end-product through many parallel routes: though raw materials, air in the
51
processing plant area, process surfaces, or even inadvertent personnel. Risk assessment tools like
52
Hazard Analysis Critical Control Points (HACCP) are almost the standard approaches to detect
53
processes prone to contamination risks [25–27]. However, built-in mechanisms on the food chain for
54
in-process sampling and contamination screening are necessary, because would allow the food
55
company to preventively stop the production, thus limiting the damage to just a part of the entire
56
batch, without compromising it completely.
57
The second application of e-noses in the food industry is the quality control of raw materials and
58
end-products, and in particular authenticity [28–30], food freshness [31], the presence of allergens
59
and shelf life [32]. The increased demand for the long-term storage and preservation originate the
60
need to develop methods that can easily track and assess food freshness. Moreover, authenticity of
61
food is a rising issue in many countries, even market leaders. As an example, it is estimated that the
62
rate of fraud of Parmigiano Reggiano cheese, a well-known Italian product, is between 20% and 40%
63
worldwide, reaching a dramatic 95% in the United States [30,33].
64
Commercial electronic noses are based on sensor arrays composed by a combination of different
65
sensors, which include conductometric [34][35], piezoelectric [36][37], field effect transistors [38],
66
optical sensors [39] and many more [40], based on different materials and working principles. Among
67
these, metal oxide (MOX) materials represent the current state of the art in the chemical sensing
68
technology, and have been investigated largely due to their abundance, cheap and easy fabrication
69
and high performances. In 1991, Yamazoe demonstrated that reducing the size of metal oxide
70
materials to nanoscale could lead to a substantial enhancement of their sensing properties [41].
71
Therefore, the research focused on the development of these novel nanostructures, constantly
72
improving the performances of the devices [42]. Among this novel generation of nanostructured
73
materials, metal oxide nanowires are considered among the most promising for the fabrication of
74
chemical sensing devices, due to their extremely high surface-to-volume ratio and their unique
75
electrical and chemical properties [43–45]. These features allow quasi-1D structures like nanowires to
76
outperform drastically their bulk counterparts.
77
As all other materials, however, metal oxides have some limitations that have inhibited an even
78
larger diffusion as sensitive materials [46]. One of the critical requirements of these materials is that
79
they are activated thermally, because chemical reactions that take place on their surface are promoted
80
by temperature (usually 200-400°C). Therefore, a substantial part of the energy consumption of an
81
electronic nose is related to its sensors heating. While this is not a big issue in food industries, where
82
devices are always connected to the power line, it is a strong key factor limiting the design of portable
83
equipment.
84
Thanks to the advances in the silicon semiconductor industry, there are now available on the
85
market different micro-machined (MEMS) silicon micro hotplates (µHPs), which consist in a very
86
thin membrane integrating both interdigited electrodes and a heating element able to reach more
87
than 400°C with ease [47]. These substrates allow reducing drastically the energy consumption of a
88
single sensor, moving from hundreds of mW to few tens during continuous operation, and are ideal
89
candidates to be integrated into a portable e-nose. Moreover, due to the reduced thickness of the
90
membrane, these hotplates exhibit a very small thermal inertia which enables the possibility of using
91
smarter sampling techniques and further power saving operating modes, like fast temperature
92
modulation and discontinuous operation [48–50]. Finally, the process steps required for the
93
fabrication of these devices are compatible with the standard planar silicon technology. Therefore, it
94
is possible to scale the fabrication to the mass production, breaking down the price of each unit [51].
95
The aim of the present work is to demonstrate the effective detection of different food
96
For this reason, a novel low-power sensor array was fabricated, which is intended as the heart of a
98
more efficient electronic nose instrument. This portable device could find application as personal
99
safety equipment for food industry workers or for monitoring the quality and the food preservation
100
processes. The proposed array integrates three different types of metal oxide nanowires (SnO2, CuO
101
and WO3) on top of commercial µHPs, provided by ams Sensor Solutions Germany GmbH (72770
102
Reutlingen, Germany). These nanowires were directly synthetized on top of the hotplates using
103
different synthesis techniques, without any transfer of the nanostructures, demonstrating the
104
compatibility of the process with mass production. The morphology and the structure of the sensing
105
materials were investigated briefly, and it was tested the ability of the array to discriminate among
106
different food preservatives: ethanol, acetone, nitrogen dioxide and ozone.
107
Ethanol is a compound largely found in the food industry, like in food fermentation processes
108
and in alcoholic beverage production [52]. However, is strongly used as preservative to increase shelf
109
life also, as deliberate addition of low concentrations of ethanol inhibits the proliferation of many
110
microorganism, increasing the shelf life of packaged food [53,54]. For example, the addition of ethanol
111
at levels between 0.5% - 3.5% to loaf leads to a substantial extension of the shelf life of bread (more
112
than 1000%) [55].
113
Acetone, instead, is traditionally used as a solvent in many industrial processes, including
114
Acetone-butanol-ethanol (ABE) fermentation of soluble and hydrolyzed sugars [56], and is one
115
ketones that is present as aroma compound in many foods [57,58]. However, is a well-known
116
interfering compound in the detection of ethanol, as is present in many food processes and is quite
117
different to discriminate from ethanol at low concentrations by artificial olfaction systems.
118
Nitrogen dioxide is a hazardous compound that has to be monitored in many environmental
119
applications. In the food industry, it is the main source of nitrite, which is a very popular and diffuse
120
compound, for example in aquaculture [59]. In small quantities, it is often added to alcoholic
121
beverages and perishable food like salami, ham and meat [60]. In fact, it is a strong antimicrobial
122
agent, but it can have noxious effects on the human body at concentrations higher than safety
123
standards, binding with haemoglobin and therefore reducing the capability of blood to transport
124
oxygen [61,62]. For drinking water, the US Environmental Protection Agency and the World Health
125
Organization have set a standard of about 3 mg nitrite/L for short-term exposures [61].
126
Finally, ozone is a compound that attracted a significant interest in the last 30 years due to its
127
role in the atmosphere. However, ozone is used in many industrial fields, including as an alternative
128
to conventional fermentation processes [63] and as a powerful antimicrobial agent [64]. The
129
application of low amounts of ozone (5-10 mg/L) has been tested as an intervention for eliminating
130
pathogens (Salmonella, E. coli) from the surface of different seeds and sprouts [65,66], as disinfectant
131
of fruit juices [67] and fresh carrots [68], for example, without leaving residues on food products.
132
133
2. Materials and Methods
134
Commercial state-of-the art µHPs were provided by ams Sensor Solutions Germany GmbH, a
135
leading semiconductor company that recently entered the market of chemical sensors. Micro
136
hotplates are fabricated using planar silicon technology, allowing the preparation of wafers
137
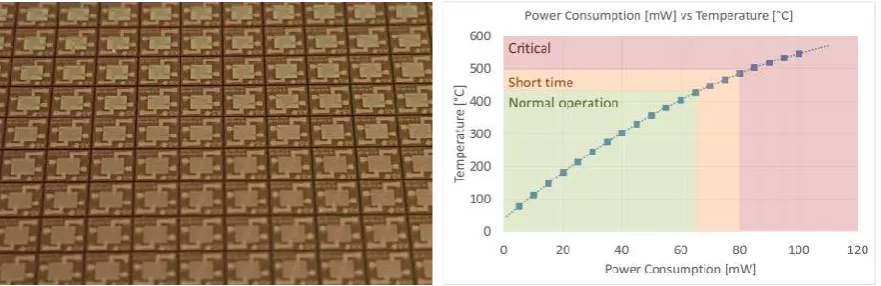
(thickness 450µm) of pre-etched substrates that has to be diced if required (Figure 1, left). Each micro
138
hotplate is 2mm x 2mm size, while the membrane area is 1mm x 1mm with a thickness of only 1µm.
139
Electrodes are deposited on top of the silicon nitride membrane in E120:20 configuration (120µm x
140
20µm), and the heating element is integrated in the membrane itself. According to the specs, these
141
µHPs can work at up to 450°C for long-term normal operation, and up to 500°C for short bursts if the
142
integrated heating element is used. However, the hotplates were stressed at much higher temperature
143
(up to 870°C) inside the furnace during the synthesis of the nanostructures, and they were able to
144
sustain it without any critical breakdown. This is an excellent result considering the very low
145
thickness and the apparent fragility of the membranes. Figure 1 (right) reports the power versus
146
required. As a comparison, sensors prepared by using 2mm x 2mm alumina substrates, integrated in
148
commercial electronic noses, consume ten times more energy [69].
149
150
Figure 1: (Left) Optical image of a wafer of ams E120:20 µHPs. (Right) Power consumption versus
151
temperature calibration.
152
2.1. Synthesis of tungsten trioxide (WO3) nanowires
153
Thermal oxidation techniques was used to synthetize tungsten oxide (WO3) nanowires on ams
154
E120:20 micro hotplates (µHPs). The synthesis process mainly consists in three steps: deposition of
155
metal layer, oxidation and thermal annealing [70].
156
A thin layer (100nm) of metallic tungsten was deposited on the hotplates by RF magnetron
157
sputtering (100 W argon plasma, 5.5x10⁻³ mbar, room temperature). Afterwards, samples were
158
oxidized in a tubular furnace (custom design based on Lenton furnaces, UK) at 600°C for one hour,
159
in order to grow the nanowires. The pressure inside the alumina tube was set at 0.8 mbar, inletting
160
an argon flow of 10 SCCM by using MKS (Germany) massflow controllers.
161
After the growing process, samples underwent a thermal annealing to oxidize completely the
162
material [70]. Samples were heated at 400°C for 12 hours in air at atmospheric pressure, in the same
163
tubular furnace.
164
165
2.2. Synthesis of copper oxide (CuO) nanowires
166
The same thermal oxidation technique was used to synthetize copper oxide (CuO) nanowires on
167
µHPs [71], but this time nanowires were synthetized at atmospheric pressure instead of in a vacuum
168
environment.
169
Firstly, 500nm of metallic copper were deposited on the pre-fabricated electrodes by using RF
170
magnetron sputtering (50 W argon plasma, 5.5x10⁻³ mbar, room temperature). Afterwards, the
171
samples underwent to a forced oxidation in a tubular furnace (Carbolite, UK). Samples were placed
172
in a quartz holder inside the alumina tube at chosen temperature (300°C), gas flow, atmosphere
173
composition and duration. Gas flow was set at 300 SCCM and oxidation time was fixed at 12 hours,
174
in order to obtain a dense mat of nanowires on the surface. The atmosphere inside the furnace
175
consisted in a mixture of argon and oxygen (80% – 20% Ar). The combination of temperature and
176
oxidation time was enough to complete oxidize the material, removing any trace of metallic copper
177
[71].
178
179
2.3. Synthesis of tin oxide (SnO2) nanowires
180
For the synthesis of tin oxide (SnO2) nanowires, a custom physical vapor deposition process
181
(PVD) was used. It mainly consists in an evaporation-condensation process based on vapor liquid
182
solid (VLS) mechanism [72–75].
183
Platinum nanoparticles were deposited on top of the µHPs by DC magnetron sputtering (70 W
184
argon plasma, 5.5x10⁻³ mbar, room temperature), acting as catalyst seeds for the nucleation of the
185
nanowires. Tin oxide powder (Sigma-Aldrich, 99.9% purity) was dispersed on an alumina holder and
186
temperature is high enough to evaporate the material (1370°C). Substrates were placed in a colder
188
region of the furnace (870°C). At this temperature, the catalytic Pt nanoparticles form droplets that
189
are in liquid form, promoting the condensation of the evaporated material on top of the substrates
190
due to the lower energy required by the process. An argon carrier flow (100sccm, MKS massflow)
191
was used to move the cloud of evaporated material towards the substrates. The pressure inside the
192
furnace was kept at 100mbar and the deposition time was 5 minutes [76].
193
194
2.4. Morphological and structural characterization
195
The morphology of prepared nanowires was investigated by using a field emission scanning
196
electron microscope (FE-SEM model LEO 1525, ZEISS), operated at 3-10 keV energy beam. The
197
microscope was coupled with an Oxford energy dispersive x-ray analysis (EDX), to confirm the
198
elemental composition and the rough stoichiometry of the material. Samples were attached with
199
carbon glue to metallic stubs, to reduce charging effects due to the electron beam.
200
Raman spectra were measured by using a fiber coupled confocal HORIBA optical microscope at
201
100x magnification. An iHR320 monochromator was configured with a grating of 1800 g/mm, and
202
was connected to a Peltier-cooled Synapse CCD. A He-Cd blue laser (442 nm) was focused on the
203
samples, to excite the material and promote the Raman scattering. Spectra were recorded in the
204
wavelength range 200-1000 cm-1.
205
206
2.5. Device fabrication and functional characterization
207
The schematic workflow used for the preparation of the sensing devices is reported in Figure 2.
208
In this experimental work, micro-hotplates were diced individually, for greater ease in preparing
209
samples at the prototype level. However, due to the high scalability of the process, all operations
210
could be performed at wafer level, which is a fundamental requirement of a mass-scale production
211
of the devices. After the µHPs dicing, a metal/catalyst layer was deposited by magnetron sputtering,
212
according to the specific metal oxide nanowires, and finally samples were oxidized/underwent VLS
213
process to synthetize the nanowires directly on the hotplates. Functional sensors require a capped
214
hosting case, to interface with the external electronics and to protect the sensing element. Therefore,
215
µHPs were mounted on TO4 package. Pads were connected to TO pins by electro-soldering 50 µm
216
gold wires.
217
Different devices of the same batches were prepared, and repeated measurements were
218
performed on nominally identical sensors under the same experimental conditions, to evaluate the
219
reproducibility and the yield of the process. The lifetime of the present sensors can be estimated to
220
be > 1 year, over which the samples are still working without any evident deterioration of the surface,
221
exhibiting a small drift (<20%) which is typical of metal oxide materials [77]. It is important to stress
222
that the first cause of device failure is the wrong manipulation: suspended MEMS membrane is very
223
fragile, and could break easily if directly touched. Therefore, samples should be handled with
224
extreme care during wire bonding and during the placing of the protective cap. However, after
225
mounting, sensors are very robust to mechanical stresses, and they are vulnerable mainly only to the
226
thermal shocks if working out of specs, which could results in the breakdown of the membrane or in
227
a permanent damage of the electrodes [47,78,79].
228
229
230
Figure 2: Flow-chart of the integration of MOX nanowires on ams µHPs to fabricate chemical sensors.
231
To investigate the conductometric response of the sensors, flow-through technique was used.
232
The sensing devices were mounted in a homemade stainless steel test chamber, able to measure up
233
to ten sensors simultaneously [80]. The chamber was set at 20 °C, to avoid the influence of the external
234
μHP Dicing Metal/Catalyst Deposition
Oxidation/VLS
Process Wire Bonding
temperature. Humidified air was produced by flowing the dry air through a Drechsel bottle, held in
235
a thermostatic bath at 25 °C, and then in a condensation vessel in order to favour the condensation of
236
saturated vapour. The humidified air was mixed with dry air in order to obtain the desired relative
237
humidity (RH) content, in these measurements fixed at 50% @ 20 °C (chamber temperature). Sensor
238
temperatures were controlled by modulating the electric power applied to heaters by
Thurlbly-239
Thandar PL330DP power supplies. A 1 V voltage was applied to the sensors, measuring at the same
240
time the conductance of each sensor using Keithley 6485 picoammetters.
241
Prior to measurements, samples were thermally stabilized at the optimal working temperature
242
for each chemical compound for 12 hours. Selected gas concentration was let in the chamber for 30
243
minutes, followed by a restore with synthetic air flow for 90 minutes, to allow the recovery of the
244
baseline. The response of n-type semiconductor sensors is determined by the variation of the
245
conductance, using, for a reducing gas, the following formula:
246
247
= = (1)
248
249
and for an oxidizing gas:
250
251
= (2)
252
Where and are respectively the resistance and the conductance of the sensor in gas,
253
and and the resistance and the conductance in purified air. For p-type material, the two
254
formulas are swapped.
255
As specified in the Introduction section, the chemical sensing performance of the fabricated
256
array of sensors were evaluated towards four different chemical compounds which are among the
257
most used food preservers: nitrogen dioxide (NO2), ethanol (CH3CH2OH), acetone ((CH3)2CO) and
258
ozone (O3). This allows to highlight the sensing performance and the differences between the
259
materials in the screening of some compounds commonly found in the food industry, demonstrating
260
the capability of the low power array to discriminate among different food preservers. Test gases
261
with a certified composition, supplied by SIAD SpA, (Italy) were mixed in a carrier of dry synthetic
262
air by MKS Instrument mass flow controllers. An UV lamp was used to generate ozone right close to
263
the test chamber, with a maximum concentration of 700ppb. Ozone was then mixed with synthetic
264
air to select the required gas concentration. The total flow inside the chamber was set at 200 SCCM.
265
Short-term reproducibility was taken into account and evaluated for all chemical species and
266
materials. Consecutive measurements were performed at the same concentration and on the same
267
sensor. Results confirm the very good repeatability of the measure, leading to an error less the 10%
268
over four gas injections. All test compound concentrations were selected at much lower values than
269
safety standards, to stress the sensing performances of the portable array.
270
271
3. Results and discussion
272
3.1. Morphological and structural characterization of NWs
273
Prior to the wire bonding of the micro-hotplates on TO packages, devices were characterized
274
morphologically by optical and FE-SEM microscopy, to confirm the presence of the nanowires, their
275
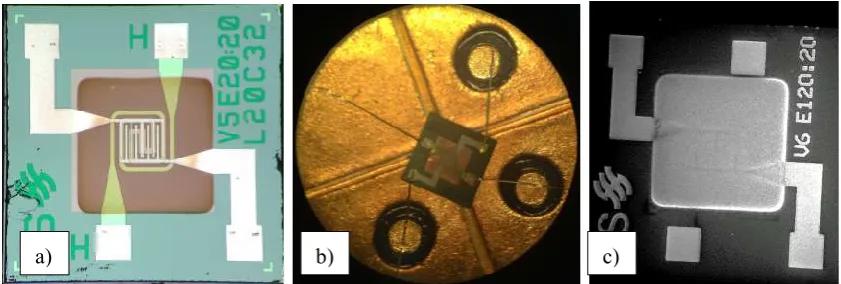
shape and aspect ratio. In Figure 3 (a) and (b) are reported two optical images of a WO3 device. Due
276
to the thermal oxidation technique used, nanowires can be patterned easily by simple shadow
277
masking, and they are visible on top of the membrane and on the interdigited electrodes (dark area).
278
Instead, is not possible to control precisely the synthesis of SnO2 nanowires on the µHPs (Figure 3
279
(c)), as the VLS mechanism is a random condensation process that cannot be confined properly. The
280
Pt catalyst promotes the growth of the nanowires in some specific regions but, due to the presence of
281
located on the membrane, but this secondary growth on the soldering pads could lead to some issues
283
during the soldering process.
284
285
286
287
Figure 3: Optical images of WO3 device as-fabricated (a) and mounted with gold wires on TO package
288
(b). Electrodes and heating element are visible through the thin membrane. (c) SEM image of SnO2
289
device at low magnification (100x).
290
Figure 4 reports some SEM images of WO3, CuO and SnO2 nanowires, at the same magnification
291
level. The density and the dimensions of nanowires are strongly dependant on the material and on
292
the synthesis technique used. Tungsten oxide nanowires are very small and dense, with an average
293
diameter of about 20-30 nm [70]. The mat of copper oxide nanowires is less dense than WO3, and the
294
average diameter is in the range of 70-100 nm [71]. In case of tin oxide, instead, a dense mat is
295
obtained, but the nanowires are irregular and very long (few µm). It is more difficult to control the
296
geometry of the wires, and thus their diameters are spread over a wide range (100-250nm).
297
298
(a) WO3 (b) CuO (c) SnO2
Figure 4: SEM pictures of WO3(a), CuO (b) and SnO2 (c) nanowires directly synthetized on ams
299
hotplates.
300
Raman spectroscopy is a not-destructive investigation technique that was used already for the
301
characterization of the thermal properties of µHPs [81]. In this specific case, this powerful technique
302
allows determining the crystalline structure of the sensing material at micrometer size, directly
303
synthetized on top of the hotplate. Indeed, thanks to the focalized laser source is possible to excite
304
only the small area of the metal oxide, confirming that the synthetized nanostructures on the µHPs
305
are crystalline for real. Raman spectra collected from the three different batches of samples are shown
306
in Figure 5.
307
As reported previously, on tungsten oxide samples the Raman shifts at 260, 322, 703, and 802
308
cm−1 can be attributed mainly to the monoclinic phase of WO3 (Figure 5, green line) [70,82,83]. The
309
bending vibration of the O-W-O bonds generate the first two shifts. The peaks at 703 and 802 cm−1,
310
instead, correspond to W–O–W stretching vibrations of the bridging oxygen. Raman measurements
311
performed on CuO samples confirm the monoclinic crystalline phase of CuO, commonly found in
312
tenorite rocks (Figure 5, red line). The three predicted Raman active lattice modes are detected at
313
293cm−1 (Ag), 344cm−1 (Bg) and 632cm−1 (Bg), in line with literature values [84]. Also for the last
314
observed batch of samples, Raman investigations identify shifts that match the one reported in
315
literature for the tetragonal phase of SnO2 (Cassiterite, Figure 5, blue line) [85]. The three detectable
316
Raman active modes of tin oxide that have been observed are Eg (490 cm-1), A1g (628 cm-1), and B2g (770
317
cm-1).
318
319
320
Figure 5: Raman spectra of SnO2, WO3 and CuO nanowires deposited on µHPs.
321
3.1. Chemical sensing performances
322
As discussed already, the most common working principle of devices integrated in electronic
323
noses is the change of the electrical conductance, due to the interaction of the chemical species in the
324
atmosphere with the surface of the sensing material [86]. Essentially, conductometric chemical
325
sensors works as resistors, in which the electrical resistance of the sensing layer is modulated by the
326
adsorption or interaction of chemical species with the surface. In Figure 6 are shown the electrical
327
conductance of three different devices in presence of ozone, a typical oxidizing gas. The effect of
328
adsorbed species on the surface of the metal oxide depends on the nature of the semiconducting
329
material. In case of n-type materials, such as SnO2 and WO3, the presence of a oxidizing gas, like
330
ozone, lead to a reduction of free electrical charge on surface, and thus decreasing the overall
331
electrical conductance. In p-type material like CuO, instead, the presence of oxidizing gas lead to an
332
increase of the conductance [87].
333
334
335
Figure 6: Dynamic response of SnO2, CuO and WO3 nanowires in presence of different concentration
336
of Ozone (300-150-150-150-150-20-50-150-300 ppb, respectively). Operating temperature for all
337
sensing devices was 400°C. Relative humidity was 50%@20°C.
338
From the dynamic measure is possible to observe the excellent stability of the baseline of all three
339
requirement for the integration of reliable sensors into electronic noses: a frequent sensors calibration
341
is undesired because it requires personnel attendance, cannot be automated and force the instrument
342
to stop [46]. Figure 6 shows also an example of the very good reproducibility of the measure. The
343
response profile of four consecutive ozone injections is almost identical in all samples, exhibiting an
344
error less than 10% in short term investigations. Moreover, all devices completely recover the
345
baseline, with no sign of surface contaminations or damaging even in presence of a reactive gas like
346
ozone, which is known to be a very strong oxidizer.
347
In electronic noses, each sensor of the array can be powered at the desired temperature,
348
according to the specific compounds fingerprints to detect. According to micro hotplate
349
specifications, investigations were limited to 400°C to avoid any damage during long-time operation,
350
like for example membrane breakdown caused by thermal stress. In this specific case, a temperature
351
of 400°C was selected as the optimal one for the detection of ethanol, acetone and ozone, while for
352
nitrogen dioxide 200°C is chosen. These values are in line with previous investigations [70,71,76].
353
Each metal oxides deposited on the µHPs have different physical and electrical properties,
354
related to the surface chemistry and the defects in the crystalline structure [88]. Therefore, different
355
sensor responses in presence of a specific concentration of the target compounds are expected. To
356
understand which is the most sensitive material towards each compound, the performances of the
357
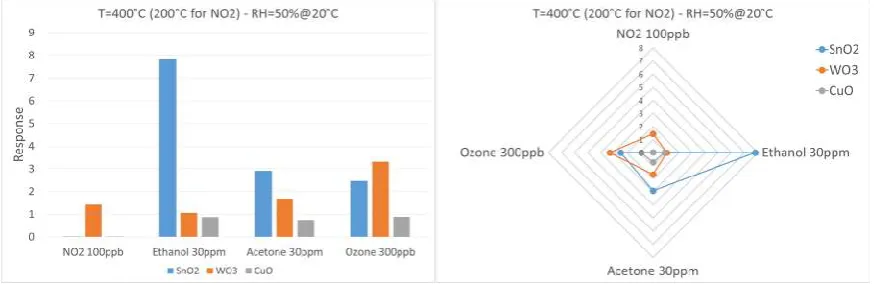
devices were compared directly at the same concentrations, as reported in Figure 7. The interest is to
358
measure very low NO2 concentrations, which are quite difficult to detect with these kind of devices
359
[89]. Among the three metal oxide devices investigated, only WO3 was able to produce an appreciable
360
response towards 100ppb of NO2, a concentration much lower than the safety standard requirements.
361
This result is not unexpected, tungsten trioxide is well known in literature to have good sensing
362
performance in detecting nitrogen dioxide [90]. Tin and copper oxide responses, instead, were
363
negligible. The asymmetry of the response between different materials is the key feature of electronic
364
noses, because helps patter recognition methods in the discrimination between different compounds.
365
Tin oxide is mostly suited, in these tests, to detect VOCs such as ethanol and acetone.
366
Interestingly, SnO2 is more sensitive to ethanol than acetone at the same concentration of 30ppm. On
367
the contrary, WO3 is more sensitive to acetone, even if its overall response is lower than SnO2. CuO
368
was not able to compete with the other two materials in term of response, but does not seem to prefer
369
neither ethanol nor acetone. Again, the different behaviour of the metal oxides in VOCs sensing allow
370
a more efficient discrimination. About ozone, tungsten trioxide is the most sensitive material toward
371
a concentration of 300ppb, followed by tin oxide. On the other hand, copper oxide response is
372
significantly lower.
373
374
375
Figure 7: Comparison of different sensing materials towards specific concentrations of target chemical
376
compounds. Operating temperature for all sensing devices was 400°C towards ethanol, acetone and
377
ozone, while it was 200°C for nitrogen dioxide. Relative humidity was 50%@20°C.
378
In Figure 8, the responses of each different sensing materials in presence of various
379
concentrations of target compounds is reported. Dashed lines in Figure 8 refer to a power-law fitting
380
of data points, according to the typical formula:
381
Response=A[gas concentration]B (3)
383
384
Where A and B are constants depending on the material and the target chemical species. Each
385
data point is the average response of at least three different sensors from the same batch, nominally
386
identical. Error bars refer to intrinsic measured variability between devices.
387
Calibration curves confirm the better performances of WO3 in detecting NO2, outperforming
388
both tin oxide and copper oxide, which was not even reported due to very low response. Defining
389
the detection limit of the devices as the gas concentration producing a unitary response (Response=1),
390
≈100ppb is identified as the limit for nitrogen dioxide.
391
Moving to VOCs, calibration curves confirm the higher responses of SnO2 devices, especially
392
towards ethanol. Detection limits, previously defined, are estimated as ≈5ppm for ethanol and
393
≈15ppm for acetone. However, an increased variability in the response of different tin oxide device
394
is reported. This could be related to the synthesis process: it is more difficult to control the
395
morphology and dimensions of the nanowires, and this is reflected in sensor response. Tungsten and
396
copper oxide devices perform worse, but responses from different devices of the same batch are more
397
consistent.
398
Ozone sensing shows mixed results. For high ozone concentration (>200ppb) tungsten oxide
399
devices exhibit better performance compared to tin and copper oxides. At moderate and low ozone
400
concentrations (<200ppb) instead, tin oxide outperform tungsten oxide devices. Copper oxide
401
response is always less than other two type of sensing devices. Detection limit for tin oxide devices
402
is estimated at ≈40ppb. Detection limits of the three different materials toward specific target
403
compounds are reported in Figure 9.
404
405
406
Figure 8: Calibration curves in presence of different chemical species: NO2, Ethanol, Acetone and
407
Ozone. Relative humidity was 50%@20°C.
408
410
Figure 9: Detection limits of the three different materials toward target chemical compounds
411
Principal Component Analysis (PCA) is by far the most used unsupervised data algorithm
412
to manage the information coming from an electronic nose. It mainly consists in a linear
413
extraction technique that reduces data dimensionality with a minimum loss of information,
414
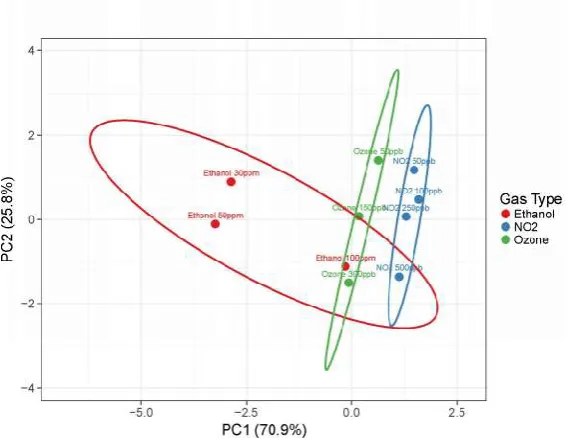
projecting them into lower dimensions (usually 2 or 3) [24]. Figure 10 reports a PCA analysis
415
performed using the data previously presented. As expected, efficient discrimination between
416
ethanol and acetone is very difficult using only the three sensors integrated in the array.
417
Therefore, acetone has not been included in this representation. However, is it possible to add
418
new sensors to the array when integrated in the electronic noses, increasing the number of
419
different sensors even up to thousands, which allows more likely the discrimination of specific
420
fingerprints [86]. Nevertheless, WO3, SnO2 and CuO devices were able to discriminate between
421
ethanol, ozone and nitrogen dioxide at low concentrations, demonstrating the capability of the
422
fabricated sensor array to distinguish the correct food preserver.
423
424
Figure 10: Pareto scaling is applied to rows; SVD with imputation is used to calculate principal components.
425
X and Y axis show principal component 1 and principal component 2 that explain 70.9% and 25.8% of the
426
total variance, respectively. Prediction ellipses are such that with probability 0.95, a new observation from
427
the same group will fall inside the ellipse. N = 10 data points.
428
429
4. Conclusions
430
Electronic olfaction systems are becoming used largely in the food safety and security fields, due
431
to high reliability, low cost, easy use and the possibility of on-line monitoring. While research is
432
focusing on the enhancements of their performances to promote further the use of such systems in
433
the food industry, a special attention is devoted to reduce the power consumption of each single
434
sensor, to allow the fabrication of portable or battery operated equipment.
435
In this work, a simple sensor array based on copper, tin and tungsten oxide nanowires was
436
prepared, and its performances in the detection of common food preservatives were evaluated. The
437
nanowires in the sensing array were synthetized on commercial low power micro-hotplates from ams
438
Sensor Solutions Germany GmbH (Germany). This novel sensor array combines the advantages of
439
NO2 Ethanol Acetone Ozone
SnO2 >1ppm 5ppm 15ppm 40ppb
WO3 100ppb 25ppm 15ppm 150ppb
conductometric metal oxides together with the increased sensing performances of nanowire
440
technology and the reduced power consumption from silicon MEMS technology. The three sensing
441
materials were characterized, to investigate the morphology and the structure of synthetized
442
nanowires, by using FE-SEM, XRD and Raman spectroscopy.
443
The fabricated array was testes towards four different food preservatives commonly used in the
444
food industry, specifically nitrogen dioxide, ethanol, acetone and ozone. Tungsten oxide resulted as
445
the most sensing material to detect nitrogen dioxide, even in low concentration (100ppb). Tin oxide,
446
instead, showed higher performance in detecting VOCs such as ethanol and acetone. The response
447
of copper oxide devices was always less than other two material, but still measurable.
448
Results confirm the ability of the sensing array to detect concentrations of food preservers that
449
are much smaller than safety standard requirements. The sensing performance of these different
450
materials resulted complementary: the combination of all sensor readouts may provide significant
451
information when integrated as in arrays or e-noses. Moreover, the use of a common technological
452
platform allows the mass production of these sensors, helping to reduce the fabrication costs. Finally,
453
the very small thermal inertia of the micro hotplates allows fancy operating modes, such as
454
discontinuous operation or pulsed temperature [48]. This is considered the frontier of sampling,
455
because not only reduces further the power consumption of the system, but enables also the use of
456
more advanced data algorithms such as advanced fuzzy and pattern recognition, which can give a
457
boost in the accuracy of the fingerprint and aroma recognition [91].
458
459
Supplementary Materials: No supplementary materials.
460
Funding: This work was supported by the European Community’s 7th Framework Programme, under the grant
461
agreement n° 611887 “MSP: Multi Sensor Platform for Smart Building Management”.
462
Acknowledgments: The author would like to thank Martin Herold (ams Sensor Solutions Germany GmbH,
463
72770 Reutlingen, Germany) for providing the micro hotplates. Moreover, the author thanks all SENSOR
464
Laboratory staff and personnel.
465
Author Contributions: D.Z. conceived the work, designed & performed the experiments and wrote the
466
manuscript.
467
Conflicts of Interest: The authors declare no conflict of interest.
468
References
469
1. Low, K.E.Y. Ruminations on Smell as a Sociocultural Phenomenon. Curr. Sociol. 2005, 53, 397–417.
470
2. Kelley, J.L.; Magurran, A.E. Learned predator recognition and antipredator responses in fishes. Fish Fish.
471
2003, 4, 216–226.
472
3. Firestein, S. How the olfactory system makes sense of scents. Nature 2001, 413, 211–218.
473
4. Richardson, J.T.E.; Zucco, G.M. Cognition and Olfaction: A Review. Psychol. Bull. 1989, 105, 352–360.
474
5. Röck, F.; Barsan, N.; Weimar, U. Electronic nose: Current status and future trends. Chem. Rev. 2008, 108,
475
705–725.
476
6. Sankaran, S.; Khot, L.R.; Panigrahi, S. Biology and applications of olfactory sensing system: A review.
477
Sensors Actuators B Chem. 2012, 171–172, 1–17.
478
7. Brattoli, M.; De Gennaro, G.; De Pinto, V.; Demarinis Loiotile, A.; Lovascio, S.; Penza, M. Odour
479
Detection Methods: Olfactometry and Chemical Sensors. Sensors 2011, 11, 5290–5322.
480
8. Zampolli, S.; Elmi, I.; Ahmed, F.; Passini, M.; Cardinali, G.C.; Nicoletti, S.; Dori, L. An electronic nose
481
based on solid state sensor arrays for low-cost indoor air quality monitoring applications. Sensors
482
Actuators B Chem. 2004, 101, 39–46.
483
9. Wolfrum, E.J.; Meglen, R.M.; Peterson, D.; Sluiter, J. Metal oxide sensor arrays for the detection,
484
levels. Sensors Actuators B Chem. 2006, 115, 322–329.
486
10. Szulczyński, B.; Wasilewski, T.; Wojnowski, W.; Majchrzak, T.; Dymerski, T.; Namieśnik, J.; Gębicki, J.
487
Different Ways to Apply a Measurement Instrument of E-Nose Type to Evaluate Ambient Air Quality
488
with Respect to Odour Nuisance in a Vicinity of Municipal Processing Plants. Sensors 2017, 17.
489
11. Wu, Y.; Liu, T.; Ling, S.H.; Szymanski, J.; Zhang, W.; Su, S.W. Air Quality Monitoring for Vulnerable
490
Groups in Residential Environments Using a Multiple Hazard Gas Detector. Sensors 2019, 19.
491
12. Haddi, Z.; Amari, A.; Alami, H.; Bari, N. El; Llobet, E.; Bouchikhi, B. A portable electronic nose system
492
for the identification of cannabis-based drugs. Sensors Actuators B Chem. 2011, 155, 456–463.
493
13. Huang, C.-H.; Zeng, C.; Wang, Y.-C.; Peng, H.-Y.; Lin, C.-S.; Chang, C.-J.; Yang, H.-Y. A Study of
494
Diagnostic Accuracy Using a Chemical Sensor Array and a Machine Learning Technique to Detect Lung
495
Cancer. Sensors 2018, 18.
496
14. Scarlata, S.; Finamore, P.; Santangelo, S.; Giannunzio, G.; Pennazza, G.; Grasso, S.; Santonico, M.; Incalzi,
497
R.A. Cluster analysis on breath print of newly diagnosed {COPD} patients: effects of therapy. J. Breath
498
Res. 2018, 12, 36022.
499
15. Wilson, A.D.; Baietto, M. Advances in Electronic-Nose Technologies Developed for Biomedical
500
Applications. Sensors 2011, 11, 1105–1176.
501
16. Wijaya, D.R.; Sarno, R.; Zulaika, E. Electronic nose dataset for beef quality monitoring in uncontrolled
502
ambient conditions. Data Br. 2018, 21, 2414–2420.
503
17. Macías, M.M.; Manso, A.G.; Orellana, C.J.G.; Velasco, H.M.G.; Caballero, R.G.; Chamizo, J.C.P. Acetic
504
Acid Detection Threshold in Synthetic Wine Samples of a Portable Electronic Nose. Sensors 2013, 13, 208–
505
220.
506
18. Hasan, N.U.; Ejaz, N.; Ejaz, W.; Kim, H.S. Meat and Fish Freshness Inspection System Based on Odor
507
Sensing. Sensors 2012, 12, 15542–15557.
508
19. Moncrieff, R.W. An instrument for measuring and classifying odors. J. Appl. Physiol. 1961, 16, 742–749.
509
20. WILKENS, W.F.; HARTMAN, J.D. An Electronic Analog for the Olfactory Processesa. J. Food Sci. 1964,
510
29, 372–378.
511
21. Persaud, K.; Dodd, G. Analysis of discrimination mechanisms in the mammalian olfactory system using
512
a model nose. Nature 1982, 299, 352–355.
513
22. Núñez Carmona, E.; Sberveglieri, V.; Ponzoni, A.; Galstyan, V.; Zappa, D.; Pulvirenti, A.; Comini, E.
514
Detection of food and skin pathogen microbiota by means of an electronic nose based on metal oxide
515
chemiresistors. Sensors Actuators, B Chem. 2017, 238.
516
23. Núñez-Carmona, E.; Abbatangelo, M.; Sberveglieri, V. Innovative Sensor Approach to Follow
517
Campylobacter jejuni Development. Biosensors 2019, 9.
518
24. Peris, M.; Escuder-Gilabert, L. A 21st century technique for food control: Electronic noses. Anal. Chim.
519
Acta 2009, 638, 1–15.
520
25. LaBorde, L.F. HACCP and HACCP-Based Programs for Controlling Food Safety Hazards in the
521
Vegetable Industry. In Handbook of Vegetables and Vegetable Processing; John Wiley & Sons, Ltd, 2018; pp.
522
969–987 ISBN 9781119098935.
523
26. Mariana, R.R.; Hidayati, L.; Soekopitojo, S. Implementing the HACCP system to the production of Bakso
524
Malang-Indonesia. J. Culin. Sci. Technol. 2018, 0, 1–22.
525
27. Feng, H.; Chen, J.; Zhou, W.; Rungsardthong, V.; Zhang, X. Modeling and evaluation on WSN-enabled
526
and knowledge-based HACCP quality control for frozen shellfish cold chain. Food Control 2019, 98, 348–
527
28. Gliszczyńska-Świgło, A.; Chmielewski, J. Electronic Nose as a Tool for Monitoring the Authenticity of
529
Food. A Review. Food Anal. Methods 2017, 10, 1800–1816.
530
29. Abbatangelo, M.; Núñez-Carmona, E.; Duina, G.; Sberveglieri, V. Multidisciplinary Approach to
531
Characterizing the Fingerprint of Italian EVOO. Molecules 2019, 24.
532
30. Abbatangelo, M.; Núñez-Carmona, E.; Sberveglieri, V.; Zappa, D.; Comini, E.; Sberveglieri, G.
533
Application of a novel S3 nanowire gas sensor device in parallel with GC-MS for the identification of
534
rind percentage of grated Parmigiano Reggiano. Sensors (Switzerland) 2018, 18.
535
31. Wang, M.; Gao, F.; Wu, Q.; Zhang, J.; Xue, Y.; Wan, H.; Wang, P. Real-time assessment of food freshness
536
in refrigerators based on a miniaturized electronic nose. Anal. Methods 2018, 10, 4741–4749.
537
32. Ramírez, H.L.; Soriano, A.; Gómez, S.; Iranzo, J.U.; Briones, A.I. Evaluation of the Food Sniffer electronic
538
nose for assessing the shelf life of fresh pork meat compared to physicochemical measurements of meat
539
quality. Eur. Food Res. Technol. 2018, 244, 1047–1055.
540
33. Popping, B.; De Dominicis, E.; Dante, M.; Nocetti, M. Identification of the Geographic Origin of
541
Parmigiano Reggiano (P.D.O.) Cheeses Deploying Non-Targeted Mass Spectrometry and
542
Chemometrics. Foods 2017, 6.
543
34. Maout, P. Le; Wojkiewicz, J.-L.; Redon, N.; Lahuec, C.; Seguin, F.; Dupont, L.; Mikhaylov, S.; Noskov,
544
Y.; Ogurtsov, N.; Pud, A. Polyaniline nanocomposites based sensor array for breath ammonia analysis.
545
Portable e-nose approach to non-invasive diagnosis of chronic kidney disease. Sensors Actuators B Chem.
546
2018, 274, 616–626.
547
35. Vergara, A.; Fonollosa, J.; Mahiques, J.; Trincavelli, M.; Rulkov, N.; Huerta, R. On the performance of
548
gas sensor arrays in open sampling systems using Inhibitory Support Vector Machines. Sensors Actuators
549
B Chem. 2013, 185, 462–477.
550
36. Magna, G.; Zor, S.D.; Catini, A.; Capuano, R.; Basoli, F.; Martinelli, E.; Paolesse, R.; Natale, C. Di Surface
551
arrangement dependent selectivity of porphyrins gas sensors. Sensors Actuators B Chem. 2017, 251, 524–
552
532.
553
37. Catini, A.; Kumar, R.; Capuano, R.; Martinelli, E.; Paolesse, R.; Di Natale, C. An Exploration of the Metal
554
Dependent Selectivity of a Metalloporphyrins Coated Quartz Microbalances Array. Sensors 2016, 16.
555
38. Jeong, Y.; Shin, J.; Hong, Y.; Wu, M.; Hong, S.; Kwon, K.C.; Choi, S.; Lee, T.; Jang, H.W.; Lee, J.-H. Gas
556
sensing characteristics of the FET-type gas sensor having inkjet-printed WS2 sensing layer. Solid. State.
557
Electron. 2019, 153, 27–32.
558
39. Natale, C. Di; Martinelli, E.; Paolesse, R.; D’Amico, A.; Filippini, D.; Lundström, I. An artificial olfaction
559
system based on the optical imaging of a large array of chemical reporters. Sensors Actuators B Chem.
560
2009, 142, 412–417.
561
40. Tonezzer, M.; Dang, L.T.T.; Tran, H.Q.; Iannotta, S. Multiselective visual gas sensor using nickel oxide
562
nanowires as chemiresistor. Sensors Actuators B Chem. 2018, 255, 2785–2793.
563
41. Yamazoe, N. New approaches for improving semiconductor gas sensors. Sensors Actuators B Chem. 1991,
564
5, 7–19.
565
42. BARSAN, N.; KOZIEJ, D.; WEIMAR, U. Metal oxide-based gas sensor research: How to? Sensors
566
Actuators B Chem. 2007, 121, 18–35.
567
43. Comini, E.; Sberveglieri, G. Metal oxide nanowires as chemical sensors. Mater. Today 2010, 13, 36–44.
568
44. Rakshit, T.; Santra, S.; Manna, I.; Ray, S.K. Enhanced sensitivity and selectivity of brush-like SnO 2
569
nanowire/ZnO nanorod heterostructure based sensors for volatile organic compounds. RSC Adv. 2014,
570
45. Comini, E. Metal oxide nanowire chemical sensors: innovation and quality of life. Mater. Today 2016, 19,
572
559–567.
573
46. Romain, A.C.; Nicolas, J. Long term stability of metal oxide-based gas sensors for e-nose environmental
574
applications: An overview. Sensors Actuators B Chem. 2010, 146, 502–506.
575
47. Udrea, F.; Gardner, J.W.; Setiadi, D.; Covington, J.A.; Dogaru, T.; Lu, C.C.; Milne, W.I. Design and
576
simulations of SOI CMOS micro-hotplate gas sensors. Sensors Actuators B Chem. 2001, 78, 180–190.
577
48. Vergara, A.; Ramírez, J.L.; Llobet, E. Reducing power consumption via a discontinuous operation of
578
temperature-modulated micro-hotplate gas sensors: Application to the logistics chain of fruit. Sensors
579
Actuators B Chem. 2008, 129, 311–318.
580
49. Vergara, A.; Llobet, E.; Brezmes, J.; Ivanov, P.; Vilanova, X.; Gracia, I.; Cané, C.; Correig, X. Optimised
581
temperature modulation of metal oxide micro-hotplate gas sensors through multilevel pseudo random
582
sequences. Sensors Actuators B Chem. 2005, 111–112, 271–280.
583
50. Kunt, T.A.; McAvoy, T.J.; Cavicchi, R.E.; Semancik, S. Optimization of temperature programmed sensing
584
for gas identification using micro-hotplate sensors. Sensors Actuators B Chem. 1998, 53, 24–43.
585
51. Viricelle, J.-P.; Pijolat, C.; Riviere, B.; Rotureau, D.; Briand, D.; de Rooij, N.F. Compatibility of
screen-586
printing technology with micro-hotplate for gas sensor and solid oxide micro fuel cell development.
587
Sensors Actuators B Chem. 2006, 118, 263–268.
588
52. Adley, C.C. Past, Present and Future of Sensors in Food Production. Foods 2014, 3, 491–510.
589
53. Katsinis, G.; Rigas, F.; Doulia, D. Synergistic effect of chemical preservatives with ethanol on the
590
microbial shelf life of bread by factorial design. Int. J. Food Sci. Technol. 2008, 43, 208–215.
591
54. Kalathenos, P.; Russell, N.J. Ethanol as a food preservative. In Food Preservatives; Russell, N.J., Gould,
592
G.W., Eds.; Springer US: Boston, MA, 2003; pp. 196–217 ISBN 978-0-387-30042-9.
593
55. Doulia, D.; Katsinis, G.; Mougin, B. Prolongation of the microbial shelf life of wrapped part baked
594
baguettes. Int. J. Food Prop. 2000, 3, 447–457.
595
56. Jin, Q.; Qureshi, N.; Wang, H.; Huang, H. Acetone-butanol-ethanol (ABE) fermentation of soluble and
596
hydrolyzed sugars in apple pomace by Clostridium beijerinckii P260. Fuel 2019, 244, 536–544.
597
57. Bai, J.; Baker, S.M.; Goodrich-Schneider, R.M.; Montazeri, N.; Sarnoski, P.J. Aroma Profile
598
Characterization of Mahi-Mahi and Tuna for Determining Spoilage Using Purge and Trap Gas
599
Chromatography-Mass Spectrometry. J. Food Sci. 2019, 84, 481–489.
600
58. Rashid, A.; Javed, I.; Rasco, B.; Sablani, S.; Ayaz, M.; Ali, M.A.; Abdullah, M.; Imran, M.; Gondal, T.A.;
601
Afzal, M.I.; et al. Measurement of Off-Flavoring Volatile Compounds and Microbial Load as a Probable
602
Marker for Keeping Quality of Pasteurized Milk. Appl. Sci. 2019, 9.
603
59. Silfiana; Widowati; Putro, S.P.; Udjiani, T. Modeling of nitrogen transformation in an integrated
multi-604
trophic aquaculture ({IMTA}). J. Phys. Conf. Ser. 2018, 983, 12122.
605
60. Manikandan, V.S.; Liu, Z.; Chen, A. Simultaneous detection of hydrazine, sulfite, and nitrite based on a
606
nanoporous gold microelectrode. J. Electroanal. Chem. 2018, 819, 524–532.
607
61. Eytcheson, S.A.; LeBlanc, G.A. Hemoglobin Levels Modulate Nitrite Toxicity to Daphnia magna. Sci.
608
Rep. 2018, 8, 7172.
609
62. Hathazi, D.; Scurtu, F.; Bischin, C.; Mot, A.; Attia, A.A.A.; Kongsted, J.; Silaghi-Dumitrescu, R. The
610
Reaction of Oxy Hemoglobin with Nitrite: Mechanism, Antioxidant-Modulated Effect, and Implications
611
for Blood Substitute Evaluation. Molecules 2018, 23.
612
63. Junior, M.D.M.; Castanha, N.; dos Anjos, C.B.P.; Augusto, P.E.D.; Sarmento, S.B.S. Ozone technology as
613
Food Res. Int. 2019, 123, 56–63.
615
64. Khadre, M.A.; Yousef, A.E.; Kim, J.-G. Microbiological Aspects of Ozone Applications in Food: A
616
Review. J. Food Sci. 2001, 66, 1242–1252.
617
65. Sharma, R.R.; Demirci, A.; Puri, V.M.; Beuchat, L.R.; Fett, W.F. Modeling the inactivation of Escherichia
618
coli O157:H7 on inoculated alfalfa seeds during exposure to ozonated or electrolyzed oxidizing water.
619
Trans. Am. Soc. Agric. Eng. 2004, 47, 173–181.
620
66. Mohammad, Z.; Kalbasi-Ashtari, A.; Riskowski, G.; Castillo, A. Reduction of Salmonella and Shiga
toxin-621
producing Escherichia coli on alfalfa seeds and sprouts using an ozone generating system. Int. J. Food
622
Microbiol. 2019, 289, 57–63.
623
67. Shah, N.N.A.K.; Supian, N.A.M.; Hussein, N.A. Disinfectant of pummelo (Citrus Grandis L. Osbeck)
624
fruit juice using gaseous ozone. J. Food Sci. Technol. 2019, 56, 262–272.
625
68. Evrendilek, G.A.; Ozdemir, P. Effect of various forms of non-thermal treatment of the quality and safety
626
in carrots. LWT 2019, 105, 344–354.
627
69. Abbatangelo, M.; Núñez-Carmona, E.; Sberveglieri, V. Application of a novel S3 nanowire gas sensor
628
device in parallel with GC-MS for the identification of Parmigiano Reggiano from US and European
629
competitors. J. Food Eng. 2018, 236, 36–43.
630
70. Zappa, D.; Bertuna, A.; Comini, E.; Molinari, M.; Poli, N.; Sberveglieri, G. Tungsten oxide nanowires for
631
chemical detection. Anal. Methods 2015, 7, 2203–2209.
632
71. Zappa, D.; Comini, E.; Zamani, R.; Arbiol, J.; Morante, J.R.; Sberveglieri, G. Preparation of copper oxide
633
nanowire-based conductometric chemical sensors. Sensors Actuators B Chem. 2013, 182, 7–15.
634
72. Roper, S.M.; Davis, S.H.; Norris, S.A.; Golovin, A.A.; Voorhees, P.W.; Weiss, M. Steady growth of
635
nanowires via the vapor-liquid-solid method. J. Appl. Phys. 2007, 102, 034304.
636
73. Her, Y.-C.; Chiang, C.-K.; Jean, S.-T.; Huang, S.-L. Self-catalytic growth of hierarchical In 2 O 3
637
nanostructures on SnO 2 nanowires and their CO sensing properties. CrystEngComm 2012, 14, 1296–1300.
638
74. Kaur, N.; Zappa, D.; Ferroni, M.; Poli, N.; Campanini, M.; Negrea, R.; Comini, E. Branch-like NiO/ZnO
639
heterostructures for VOC sensing. Sensors Actuators, B Chem. 2018, 262.
640
75. Kolasinski, K.W. Catalytic growth of nanowires: Vapor–liquid–solid, vapor–solid–solid, solution–
641
liquid–solid and solid–liquid–solid growth. Curr. Opin. Solid State Mater. Sci. 2006, 10, 182–191.
642
76. Comini, E.; Faglia, G.; Sberveglieri, G.; Pan, Z.; Wang, Z.L. Stable and highly sensitive gas sensors based
643
on semiconducting oxide nanobelts. Appl. Phys. Lett. 2002, 81, 1869–1871.
644
77. Korotcenkov, G.; Cho, B.K. Instability of metal oxide-based conductometric gas sensors and approaches
645
to stability improvement (short survey). Sensors Actuators B Chem. 2011, 156, 527–538.
646
78. Puigcorb, J.; Vogel, D.; Michel, B.; Vil, A.; Gr cia, I.; Can, C.; Morante, J.R. High temperature degradation
647
of Pt/Ti electrodes in micro-hotplate gas sensors. J. Micromechanics Microengineering 2003, 13, S119–S124.
648
79. Gardner, J.W.; Pike, A.; de Rooij, N.F.; Koudelka-Hep, M.; Clerc, P.A.; Hierlemann, A.; Göpel, W.
649
Integrated array sensor for detecting organic solvents. Sensors Actuators B Chem. 1995, 26, 135–139.
650
80. Sberveglieri, G.; Faglia, G.; Perego, C.; Nelli, P.; Marks, R.N.; Virgili, T.; Taliani, C.; Zamboni, R.
651
Hydrogen and humidity sensing properties of C60 thin films. Synth. Met. 1996, 77, 273–275.
652
81. Deluca, M.; Wimmer-Teubenbacher, R.; Mitterhuber, L.; Mader, J.; Rohracher, K.; Holzer, M.; Köck, A.
653
In-Situ Temperature Measurement on CMOS Integrated Micro-Hotplates for Gas Sensing Devices.
654
Sensors 2019, 19.
655
82. Sadek, A.Z.; Zheng, H.; Breedon, M.; Bansal, V.; Bhargava, S.K.; Latham, K.; Zhu, J.; Yu, L.; Hu, Z.;
656
Langmuir 2009, 25, 9545–9551.
658
83. Zheng, H.; Tachibana, Y.; Kalantar-zadeh, K. Dye-Sensitized Solar Cells Based on WO 3. Langmuir 2010,
659
26, 19148–19152.
660
84. Hagemann, H.; Bill, H.; sadowski, W.; Walker, E.; François, M. Raman spectra of single crystal CuO.
661
Solid State Commun. 1990, 73, 447–451.
662
85. Marina N. Rumyantseva, †; Alexander M. Gaskov, †; N. Rosman, ‡; T. Pagnier, ‡ and; Juan R. Morante*,
663
§ Raman Surface Vibration Modes in Nanocrystalline SnO2: Correlation with Gas Sensor Performances.
664
2005.
665
86. Chiu, S.-W.; Tang, K.-T. Towards a Chemiresistive Sensor-Integrated Electronic Nose: A Review. Sensors
666
2013, 13, 14214–14247.
667
87. Barsan, N.; Simion, C.; Heine, T.; Pokhrel, S.; Weimar, U. Modeling of sensing and transduction for
p-668
type semiconducting metal oxide based gas sensors. J. Electroceramics 2010, 25, 11–19.
669
88. Arafat, M.M.; Dinan, B.; Akbar, S.A.; Haseeb, A.S.M.A. Gas Sensors Based on One Dimensional
670
Nanostructured Metal-Oxides: A Review. Sensors 2012, 12, 7207–7258.
671
89. Andringa, A.-M.; Smits, E.C.P.; Klootwijk, J.H.; de Leeuw, D.M. Real-time NO2 detection at ppb level
672
with ZnO field-effect transistors. Sensors Actuators B Chem. 2013, 181, 668–673.
673
90. Zeng, J.; Hu, M.; Wang, W.; Chen, H.; Qin, Y. NO2-sensing properties of porous WO3 gas sensor based
674
on anodized sputtered tungsten thin film. Sensors Actuators B Chem. 2012, 161, 447–452.
675
91. Llobet, E.; Brezmes, J.; Ionescu, R.; Vilanova, X.; Al-Khalifa, S.; Gardner, J.W.; Bârsan, N.; Correig, X.
676
Wavelet transform and fuzzy ARTMAP-based pattern recognition for fast gas identification using a
677
micro-hotplate gas sensor. Sensors Actuators B Chem. 2002, 83, 238–244.