Indoor Localization Systems for Passive UHF RFID Tag Based on
RSSI Radio Map Database
Mugahid Omer1, Yachao Ran2, and Gui Yun Tian1, 2, *
Abstract—A classification algorithm is applied to UHF radio frequency identification (RFID) system to estimate the indoor position of a passive tag utilizing a received signal strength indicator (RSSI). Passive tag signals are collected by conventional UHF RFID reader antenna located at two different positions. K-NN and curve fitting are used for distance estimation and examined at different frequencies within the range 902–928 MHz to find suitable frequencies which can minimize the average error. In the proposed method, the measured RSSI values are compared with the fingerprint database in different frequencies to find the nearest neighbor. The best accuracy achieved at frequency range 926–928 MHz is 18.3 cm. The monitoring system is composed of a reader and tags under test, which makes the proposed system robust, easy to set up, and with low cost. The limitation of the proposed method is also discussed.
1. INTRODUCTION
Recently, RFID technologies have been widely used in modern logistics and tracking systems as a reliable monitoring and identification platform. RFID technology is emerged as low-cost and flexible implementations which provide an efficient form of automatic identification, as well as carrying sensing capability which can be used to monitor environmental changes and physical phenomena in the real world. These features encourage the vendors to use the RFID system in different applications such as airport baggage tracking, animal identification, and race timing. Therefore, this technology emerges to be integrated with the internet of things (IoT) [1, 2]. The main advantages of the RFID technology include low budget cost and ability to deploy in differently sized area, and it provides successful support in a harsh environment. These advantages motivate researchers to use it for localization in indoor environments [3]. The RFID system is composed of reader and tag. The reader interrogates the tag by sending an electromagnetic signal through a wireless medium. The tag receives the signal and employs it to power up the tag chip for demodulation and backscatter the signal to the reader.
The indoor environments affect the signal propagation and increase the difficulties to predict the received signal level due to the multipath effect, which is caused by fixed walls or moving objects. The positioning of both RFID tag and reader have been discussed in different studies, and there have been many solutions based on various kinds of information such as frequency, phase, and RSSI. Popular RFID localization methods could be divided into three main categories: 1) a time-based method [4], 2) phase-based methods [5–8], 3) RSSI-based (Received Signal Strength Indicator) methods [9–12]. The time-based method from a budget perspective is relatively costly, as well as the synchronization requirements, which increase the system complexity. Good accuracy is not guaranteed when using the time-based techniques due to the bandwidth limitation since the total bandwidth for UHF RFID is defined in USA standard limited to a 27 MHz ranged 902–928 MHz [4].
Received 29 August 2018, Accepted 3 December 2018, Scheduled 17 December 2018
* Corresponding author: Gui Yun Tian ([email protected]; [email protected]).
1 School of Automation Engineering, University of Electronic Science and Technology of China, Chengdu 611731, China. 2School
Regarding the “passive” object positioning, time of arrival (TOA) algorithm has been developed using UWB signals, but it is a complicated and high-cost method [13]. The phase of the backscatter signal depends on both the propagation path and tag modulating properties. The propagation path depends on both the power level and frequency of the transmitted signal. These requirements have made the phase based techniques more complicated. However, the usage of an RSSI signal for localization is widespread in the area of wireless sensor networks (WSN) because it could be measured in a simple way with low cost. Tag identifier and RSSI are directly extracted by the reader from the received signal information. The classification techniques applied on RSSI signal for position sensing can be achieved by radio map or fingerprint technique to observe tag movement in the area of interest [14], utilizing distributed reference tags or both techniques. The concept of building a radio map depends on locating the tag at known positions and complete information about the selected positions, which is collected then stored in a database. This database is used as a trained sample which is compared with a measured signal to estimate tag position and to calculate the average error. The concept behind utilizing the reference tags for localization is as follows, firstly relying on distributing a number of tags at known locations. Tags at the known locations are used to estimate the target tag position by applying different techniques [15, 16]. Shao and Burkholder [16] link the reference tag technique and radio map fingerprint to improve localization accuracy. The RSSI based techniques utilize the attenuation of the transmitted power to estimate the distance between the interrogator and the target tag. The RSSI based technique has low complexity compared with other techniques. However in most of the studies, it does not achieve high accuracy because the signal strength can be affected by different factors, e.g., multipath, antennas interaction and noise.
There have been various studies investigating the ability to implement the algorithms and methods for tag localization using different RFID techniques in practice [17, 18]. Regarding the requirement for high accurate indoor localization, the traditional methods are not suitable to be adaptive for indoor-localization using passive RFID technology. The reason is that these traditional methods may either use a simple algorithm [8] or need more hardware such as reference tags or additional reader antennas to maintain the environment changes, or use complex techniques [17] with additional hardware [18]. Most studies [10, 15, 19] using K-NN for UHF RFID location sensing rely on the measured RSSI value at the frequency of 915 MHz, and power strength at this frequency is used as a classification feature. Therefore, the basic K-NN algorithm achieves low accuracy when it deals with a single frequency in the multi-path effect and noisy indoor environment [20]. The value of RSSI may not linearly decrease with the increase of distance due to the noise and multipath effect [15]. In indoor environments, several measured points might map to the same RSSI value [21] leading to significant estimation errors.
To improve the accuracy of RSSI-based algorithms, this article proposes a new idea about distance estimation by combining K-NN algorithm with fingerprint database. Instead of utilizing only the center frequency signals which operate at 915 MHz for both reference and target tags, a wide range of frequencies is included in the investigation. The measured RSSI values are compared with radio map database in different frequencies to investigate and find the frequencies which can mitigate the multipath effects. The main contribution of this research includes testing the conventional center frequency localization result and comparing with the result of the signals which are transmitted in different frequencies within the USA standard band for UHF RFID. The goal of this comparison is to find a suitable frequency range that has high immunity to indoor environment effects. The nearest neighbor is selected by sweeping the frequency of the transmitted signal to find the best frequency range that can achieve higher accuracy for target localization. The measured values of RSSI are set to 0 if the tag cannot be detected with a particular frequency.
This article is organized according to the following description. Section 2 shows related work including characterizing of tag factors and classification algorithm based on RSSI fingerprint database. Section 3 includes training and blind test approach. Section 4 provides experimental results. Finally, Section 5 concludes the manuscript.
2. RELATED WORK
distance (d) between the reader and tag, and other conditions, e.g., interrogator power and operating frequency. Indoor environment influences the RSSI signal with various factors such as free space loss factor, multipath reflection, and interference effects [16]. Utilization of RSSI signal for distance estimation can be achieved by using one of the following procedures 1) characterize the Tag parameters before locating tagged object which is called indirect techniques, 2) use one of the machine learning or probabilistic algorithms directly on the received signal based on fingerprint database which is called direct technique.
2.1. Tag Factors Characterization
Depending on the received power the distance could be estimated by using a signal propagation model [1, 13, 22] as shown in Equation (1). Most methods and algorithms for monitoring and locating objects are based on signal propagation. Anyhow, the received power at the reader antenna depends on various factors which affect the strength of the signal [17]. However, the type of reader antenna and orientation specify the backscatter link budget [23]. The three types of backscatter link budgets are monostatic, bistatic collocated and bistatic dislocated link budget. In the monostatic backscatter link the reader utilizes one antenna for both transmission and receiving, where in the bistatic collocated backscatter link two different antennas are used, one for transmitting and the other for receiving, and they are located in the same local area (within a few wavelengths about centimeters of each other). The bistatic dislocated backscatter-link describes an RF tag reader where two different antennas at two separate locations are used. The monostatic backscatter power is used to calculate the distance d
between the tag and reader antenna by Equation (1) [23]:
d= 4
PTG2TG2tλ4X2M
PR(4π)4Θ2B2F2 (1)
wherePT is the reader transmitted power [W],PR the reflected power received by the reader [W], GT the gain of the interrogator transmitter antenna,Gtthe gain of the tag antenna,λthe signal wavelength [m],X the polarization mismatch,M the modulation factor, Θ the gain penalty due to tag attachment to different object materials, B the path loss due to blockage, and F2 the fade margin for monostatic.
On-object gain penalty Θ affects the amount of received power. When the object is attached with different materials it returns different powers to the receiver, thus it is very challenging to use the UHF RFID tag in an indoor localization system while it is attached to various objects. Furthermore, it is not easy to estimate the specifications of the commercial tag. Therefore, it will be difficult to predict the distance directly from Equation (1). Instead, classification methods can be used as illustrated in Subsection 2.2.
2.2. Classification Algorithm Based on RSSI Fingerprint Database
The fingerprinting technique estimates the location by referring it to remark points. This term is used commonly to explain how to identify the target object location from the detected RSS signals and register all of the information in a computer-based storage system. Fingerprint location-based technique is composed of two processing stages, first building a training data set then testing to identify the target position. In the first process stage, a radio map of the detected RSSI signal, which is measured from different locations, is recorded and saved in the server. Then, for the position estimation process, the signal strength received from the monitored device is compared with the recorded radio map using any of closeness matching techniques, such as k-nearest neighbor (K-NN), to predict the location of the current device.
interrogator antennas are M, while the distributed reference tags at the area of interest are N. The received power from any jth target tag is in the formTj = (t(j,1), t(j,2),. . ., t(j,M)), while t(j,m) defines the backscattered power from thejthtarget and received by themthinterrogator reader antenna where
m∈(1, M). The received signal from thenth reference tag by the mth interrogator antenna is formed as Rn = (r(n,1), r(n,2), . . ., r(n,M)), where n ∈ (1, N). The Euclidean distance formula E(i,n) linked betweenTj and Rn target tag and the reference tag respectively formed as
E(j,n)=
M
m=1
(t(j,m)−r(n,m))2 (2)
The jth target tag has its Euclidean distance vector Ej = (E(j,1), E(j,2), . . ., E(j,N)). The reference tag closer to the target tag is assumed to have a smaller Euclidean distance. The calculation of weight coefficient for each reference tag is given by
w(j,k)=
1/E2(j,k) K
k=1
1/E2(j,k)
(3)
Ej represents the sorted Euclidean distance in ascending order. According to the first k values, k represents the order of the nearest neighbor of reference tag. The estimated location of thejth target, (ˆxj,yˆj), is calculated by
(ˆxj,yˆj) = K
k=1
w(j,k)(xk, yk) (4)
where (xk, yk) represents the location of thekth selected reference tag [24].
3. TRAINING AND BLIND TEST APPROACH
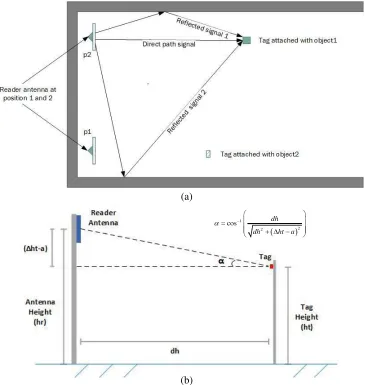
Experiments are conducted by using Thingmagic M6e universal RFID Platform, with 6 dBi reader antenna gain. The platform is used to monitor C1G2 passive tag which is attached to cork and carton objects. These objects are widely used in goods packaging [21]. The transmitter of the reader adjusted to maximum power 35 dBm to increase the coverage area of the monitoring system. Tag is located at different positions as shown in Fig. 1. In data training process all distances are registered with its corresponding RSSI values in the fingerprint database.
Fingerprint database contains 25 data records collected from 25 different positions; each record has 27 fields, which represents the frequency range (902–928) MHz for UHF RFID. At least three samples
for each frequency are taken, then the average value of these three samples is saved as one record. The experiments are applied at aisle which has a width 2.45 m, and the total length exceeds 50 m, but the radio map is limited to 4 m of length.
Specifically, an extensive study of the system behavior is needed. This article focuses on observing RSSI variations of RFID tag located at different positions in an indoor environment. Two way uplink and downlink radar equations are commonly used with localization systems based on RSSI signal [25]. The two way path loss in free space is depicted in Equation (5)
P ath loss=
λ
4πd
4
(5)
λ is the wavelength of the received signal, and d is the separated distance between the tag and the interrogator antenna. In this study, RSSI is measured and investigated depending on UHF RFID universal reader, where RSSI is manufacturer dependent and not standardized [16]. The tag is placed at a different height from the reader antenna height level and is 30 cm higher above the ground while reader antenna is 57 cm higher above the ground. To detect the tag position and find the horizontal distancedhbetween the reader antenna and the tag, angleαis used for calibration as shown in Fig. 2(b). A tagged object placed in different positions at the interrogation zone IZ and the RSSI value is registered for each location to create a radio map database, which is used as a trained record in the estimation
( )
1
2 2
cos dh
dh ht a
α= −⎛⎜ ⎞⎟
⎜ ⎟
⎜ + Δ − ⎟
⎝ ⎠
(b) (a)
algorithm. The received UHF RFID signal is frequency dependent, and the tag used in the experiments is compatible with USA frequency band ranging from 902 to 928 MHz. The reader antenna is located at two different positions to collect signal from train points and test points as shown in Fig. 2(a).
The distance between the reader antennas at position 1 (p1) and position 2 (p2) is 157 cm, and the distance between reader at p1 and the right side wall is 45 cm, where the reader at position p2 is 44 cm from the left side wall. In experimental work, three RSSI samples or more have been taken for each position in the whole frequency range. For more illustrations Fig. 3 shows the relationship between the frequency and RSSI values for different distances.
905 910 915 920 925 928
-80 -40
905 910 915 920 925 928
-80 -40
910 912 914 916 918 920 922 924 926 928 -80
-40
920 921 922 923 924 925 926 927 928 -80
-60
914 916 918 920 922 924 926 928
-80 -70 (b) (a) (d) (c) (e) RSSI ( d B m ) Frequency (MHz)
Figure 3. The RSSI signal received by reader antenna from position1 where the separated distance between tag and reader is (a) 1 m, (b) 2 m, (c) 3 m, (d) 4 m, (e) 5 m.
From Fig. 4, we can observe that when the distance is increased, the bandwidth of the frequency response is decreased. But still, it is hard to infer a direct relationship between the RSSI and frequency bandwidth for tag localization. Fig. 4 shows the relationship between the frequency and the average RSSI value measured from different distances, and the received RSSI samples at each frequency are grouped together to calculate the average of the specified frequency.
RSSI ( d B m )
900 905 910 915 920 925 930
-80 -70 -60 -50 -40 -30 -20 -10 0 1m 2m 3m 4m 5m Tag not respond substitute with zero
Tag respond
Frequency (MHz)
Figure 4. The average value of the received signal measured from different distances.
Sometimes, the tag does not respond to lower frequencies within ISM frequency range as shown in Fig. 4. To overcome this problem the corresponding RSSI values of these frequencies are substituted by zero. Therefore, all distances are represented in the same vector length.
Figure 5. Relationship link between the estimated distanceT, fingerprint neighborsP i, and two reader antenna’sR1 and R2.
by comparing the target received signal with the fingerprint database records using K-NN algorithm. Fig. 5, shows the difference between the estimated distance and the assigned neighbor from the database using the following equations.
Di = d(1)i 2
+d(1)B 2−2d(1)i d(1)B cos(ϕi−θ) (6)
(b) (a)
Real distance (m)
Distance (m)
Estimated distance (m)
(c)
Estimated error (cm)
Cumulative probability
Figure 6. Distance estimation experimental result for K-NN algorithm (a) localization error for various frequency range, (b) average error comparison between K-NN & K-NN+ curve fitting, (c) estimation error vs. cumulative probability for K-NN & K-NN + curve fitting.
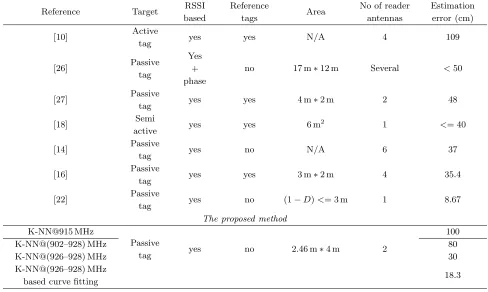
Table 1. Comparison of localization methods.
Reference Target RSSI
based
Reference
tags Area
No of reader antennas
Estimation error (cm)
[10] Active
tag yes yes N/A 4 109
[26] Passive
tag
Yes + phase
no 17 m∗12 m Several <50
[27] Passive
tag yes yes 4 m∗2 m 2 48
[18] Semi
active yes yes 6 m
2 1 <= 40
[14] Passive
tag yes no N/A 6 37
[16] Passive
tag yes yes 3 m∗2 m 4 35.4
[22] Passive
tag yes no (1−D)<= 3 m 1 8.67
The proposed method K-NN@915 MHz
Passive
tag yes no 2.46 m∗4 m 2
100
K-NN@(902–928) MHz 80
K-NN@(926–928) MHz 30
K-NN@(926–928) MHz
based curve fitting 18.3
where
ϕi = cos−1
|d12|2+d(1)i 2
−d(2)i 2
/2|d12|d(1)i
(7)
θ = cos−1
|d12|2+d(1)T 2
−d(2)T 2
/2|d12|d(1)T
The parameters in Equations (6) to (8) are defined as|d(ik)|(i= 1, . . . , N;k= 1,2) which represents the separated distance between the Pith fingerprint point and the reader antenna at positions R1 and
R2. |d(Tk)|, where (k= 1,2), represents the distance separation between the unknownT target tag and the two readers. |d12|represents the distance separation between the two reader antennas R1 and R2.
4. EXPERIMENTAL RESULTS
After studying the behavior of the signal when the tag moves away from the reader as shown in Fig. 6, the bandwidth of the frequency response is decreased. This observation leads to enhancing the performance of the K-NN algorithm, and it is obvious in Fig. 6 that the tag responds to the frequencies 926 to 928 MHz in all cases of the distance change. Therefore, the accuracy is increased when applying the algorithm in this frequency range.
The comparative results, as shown in Table 1, illustrate the accuracy enhancement by applying the K-NN algorithm based on frequency range (926–928) MHz. This frequency range increases the accuracy with about 62.5% compared with the same algorithm applied to the total frequency range (902– 928) MHz, while it enhances the algorithm efficiency with about 70% compared with center frequency 915 MHz estimation error result. Curve fitting is applied to the K-NN@(926–928) MHz to get a further improved result.
5. CONCLUSION
In the current article, K-NN algorithm with fingerprint technique is applied to the RSSI signal, which is received from the RFID system. The proposed method is tested with different frequency ranges, to localize a tag attached to a cork and carton. It is clear that the accuracy is influenced by a number of coefficients in an indoor environment, such as signal reflection from different paths, fading, plus the presence of barriers. In the experimental setup, there is always a line of sight path between the interrogator and the tag.
The average error of the estimated distance in the final experimental result is 18.3 cm which is the average measurement collected at multiple times within the frequency range 926–928 MHz. The center frequency 915 MHz gets the lowest accuracy, which means that it is most affected by the indoor environment. In future work, different types of signals such as phase and RSSI can be combined to improve localization accuracy.
REFERENCES
1. Zhu, X. W., S. K. Mukhopadhyay, and H. Kurata, “A review of RFID technology and its managerial applications in different industries,”J. Eng. Technol. Manag., Vol. 29, No. 1, 152–67, 2012. 2. Erguler, I., “A potential weakness in RFID-based Internet-of-things systems,” Pervasive Mob.
Comput., Vol. 20, 115–126, 2014.
3. Zhang, J., G. Y. Tian, A. Marindra, A. Sunny, and A. Zhao, “A review of passive RFID tag antenna-based sensors and systems for structural health monitoring applications,” Sensors, Vol. 17, No. 2, 265, 2017.
4. Duroc, Y., G. A. Vera, and J. G. Martin, “Modified RSSI technique for the localization of passive UHF RFID tags in LOS channels,”Int. J. Microw. Wirel. Technol., Vol. 5, No. 5, 645–651, 2013. 5. Nikitin, V., R. Martinez, S. Ramamurthy, H. Leland, G. Spiess, and K. V. S. Rao, “Phase based
spatial identification of UHF RFID tags,” 2010 IEEE International Conference on RFID (IEEE
RFID 2010), 102–109, 2010.
6. S¨arkk¨a, S. V. Viikari, S. Member, and M. Huusko, “Phase-based UHF RFID tracking with non-linear Kalman filtering and smoothing,”IEEE Sens. J., Vol. 12, No. 5, 904–910, 2012.
7. Mittra, R. and U. Pujare, “Real time estimation of motion and range of RFID tags,” Proceedings
8. Li, X., Y. Zhang, and M. G. Amin, “Multifrequency-based range estimation of RFID tags,” 2009
IEEE International Conference on RFID, 147–154, 2009.
9. Whitney, A., J. Parker, M. Engelhard, Z. Kratzer, and J. Fessler, “RSSI informed phase method for distance calculations,”2015 IEEE International Conference on Advanced Intelligent Mechatronics
(AIM), 1138–1142, 2015.
10. Ni, L. M., Y. Liu, Y. C. Lau, A. Patil, and E. Lansing, “LANDMARC: Indoor location sensing using active RFID,”Proceedings of the First IEEE International Conference on Pervasive Computing and
Communications, 2003, (PerCom 2003), Vol. 10, No. 6, 701–710, 2003.
11. Xiao, X., X. Jing, S. You, and J. Zeng, “An environmental-adaptive RSSI based indoor positioning approach using RFID,” 2010 International Conference on Advanced Intelligence and Awareness
Internet (AIAI 2010), No. 1, 127–130, 2010.
12. Saab, S. S. and Z. S. Nakad, “A standalone RFID indoor positioning system using passive tags,”
IEEE Trans. Ind. Electron., Vol. 58, No. 5, 1961–1970, 2011.
13. Decarli, N., F. Guidi, D. Dardari, and S. Member, “Passive UWB RFID for tag localization: Architectures and design,” Vol. 16, No. 5, 1385–1397, 2016.
14. Parlak, S. and I. Marsic, “Non-intrusive localization of passive RFID tagged objects in an indoor workplace,”2011 IEEE International Conference on RFID-Technologies and Applications, 181–187, 2011.
15. Zhang, Z., Z. Lu, V. Saakian, X. Qin, Q. Chen, and L. R. Zheng, “Item-level indoor localization with passive UHF RFID based on tag interaction analysis,” IEEE Trans. Ind. Electron., Vol. 61, No. 4, 2122–2135, 2014.
16. Shao, S. and R. J. Burkholder, “Item-level RFID tag location sensing utilizing reader antenna spatial diversity,” IEEE Sens. J., Vol. 13, No. 10, 3767–3774, 2013.
17. Martinelli, F., “A robot localization system combining RSSI and phase shift in UHF-RFID signals,”
IEEE Trans. Control Syst. Technol., Vol. 23, No. 5, 1782–1796, 2015.
18. Scherh¨aufl, M., M. Pichler, and A. Stelzer, “UHF RFID localization based on evaluation of backscattered tag signals,” IEEE Trans. Instrum. Meas., Vol. 64, No. 11, 2889–2899, 2015.
19. Zhao, Y., K. Liu, and Y. Ma, “Similarity analysis-based indoor localization algorithm with backscatter information of passive UHF RFID tags,” IEEE Sens. J., Vol. 17, No. 1, 185–193, 2017.
20. Chen, X., L. Xie, C. Wang, and S. Lu, “Adaptive accurate indoor-localization using passive RFID,”
Proceedings of the International Conference on Parallel and Distributed Systems — ICPADS, 249–
256, 2013.
21. Uhf, R. L. Using, J. S. Choi, H. Lee, D. W. Engels, and S. Member, “Passive UHF RFID-based localization using detection of tag interference on smart shelf,” 268 IEEE Trans. Syst., Vol. 42, No. 2, 268–275, 2012.
22. Omer, M. and G. Y. Tian, “Indoor distance estimation for passive UHF RFID tag based on RSSI and RCS,”Measurement, Vol. 127, 425–430, 2018.
23. Griffin, J. D. and G. D. Durgin, “Complete link budgets for backscatter-radio and RFID systems,”
IEEE Antennas Propag. Mag., Vol. 51, No. 2, 11–25, 2009.
24. Zhao, Y., K. Liu, Y. Ma, and Z. Li, “An improved k-NN algorithm for localization in multipath environments,”EURASIP J. Wirel. Commun. Netw., Vol. 2014, No. 1, 208, 2014.
25. Objects, I. and I. R. Power, “Propagation mechanisms,” Wireless Communications, 2nd Edition, 2011.
26. Lyu, Y., J. Patton, S. C. G. Periaswamy, and T. Roppel, “BFVP: A probabilistic UHF RFID tag localization algorithm using Bayesian filter and a variable power RFID model,”IEEE Trans. Ind.
Electron., Vol. 65, No. 10, 8250–8259, 2018.
27. Djuric, M. B. M. R. M., “Proximity detection with RFID: A step toward the internet of things,”