ABSTRACT
CHOI, BYOUNGHOAN. TOPICS IN RISK-BASED DESIGN AND PERFORMANCE EVALUATION OF STRUCTURES. (Under the direction of Abhinav Gupta)
This dissertation focuses on three topics that are critical to the development of a risk-based criteria for life-cycle design, analysis, and operation of power plant piping systems. One of three topics describes an exploratory study conducted on the application of risk-based load and resistance factor design approach to Section III of ASME Boiler and Pressure Vessel Codes for piping design. This study considers a straight pipe subjected to pressure and seismic load for service load D in class 2 and class 3 piping systems. The failure criterion needed to characterize the limit-state is considered as plastic instability.
The second topic in this dissertation relates to the analysis of coupled building-piping systems subjected to seismic loads. More specifically, it describes the effect of uncertainties in the modal properties of individual primary and secondary systems on the seismic response of coupled systems. Monte Carlo simulation and First-order reliability methods are used to study the problem in detail and identify critical aspects of this problem. Simple formulations are then developed for incorporation in a response spectrum method so that the design response is consistent with a desired probability of non-exceedence.
TOPICS IN RISK-BASED DESIGN AND PERFORMANCE
EVALUATION OF STRUCTURES
by
BYOUNGHOAN CHOI
A dissertation submitted to the Graduate Faculty of North Carolina State University
in partial fulfillment of the requirements for the Degree of
Doctor of Philosophy
DEPARTMENT OF CIVIL ENGINEERING
Raleigh 2003
DEDICATION
BIOGRAPHY
ACKNOWLEDGEMENTS
This research was partially supported by the Center for Nuclear Power Plant Structures, Equipment and Piping at North Carolina State University. Resources for the Center came from the dues paid by member organizations, Department of Energy through a sub-award to
Westinghouse Electric Company under the Nuclear Energy Research Initiative grant, and from the Civil Engineering Department and College of Engineering in the University.
I wish to express my appreciation to Professor Abhinav Gupta for his constant inspiration and guidance throughout the course of this research. Appreciation is also extended to the
members of my advisory committee : Professors Ajaya Kumar Gupta, Amir Mirmiran, and C.C. Tung.
TABLE OF CONTENTS
Page LIST OF TABLES ..………..
LIST OF FIGURES ………..
PART I INTRODUCTION …….………..………..……….…….
1. Introduction ....……….………..….. 2. Proposed Research …..………. 3. Organization …..……….. References ……….…... PART II RELIABILITY-BASED LOAD AND RESISTANCE FACTOR DESIGN
FOR PIPING: AN EXPLORATORY CASE STUDY ………... Abstract ……….………... 1. Introduction ……….. 2. Reliability-Based Limit State Design ………..……….……… 3. Performance Function for Plastic Instability of Piping ……… 4. Characterization of Random Variables and Code Calibration ……… 5. System-Based Target Reliability ……… 6. Computation of Partial Safety Factors ………. 7. Sensitivity Analysis ……… 8. Summary and Conclusions ……… References ………..
viii x 1 2 6 9 11
PART III CONSIDERATION OF UNCERTAINTIES IN SEISMIC
ANALYSIS OF COUPLED BUILDING-PIPING SYSTEMS ………. Abstract ………..……..…………. 1. Introduction ……… 2. Coupled System Analysis ………. 3. Relative Significance of Uncertainty in Earthquake Input and Modal
Properties ……… 4. Monte Carlo Simulation: Time History Analysis versus Response
Spectrum Analysis ………... 5. First Order Reliability Method (FORM) Approach ……….. 6. Proposed Methods ……….……….. 6.1 Mean of Conditional Responses ………. 6.2 Square-Root-of-Mean-of-Squares (SRMS) ………. 8. Summary and Conclusions ……… References ………. Appendix A ………... PART IV PROBABILISTIC FRAMEWORK FOR CONDITION
ASSESSMENT ………. Abstract ……… 1. Introduction ………... 2. Formulation of the Inverse Problem ……….. 3. Proposed Probabilistic Approach ………. 4. Additional Example ……….
52 53 54 55
56
58 61 64 65 68 69 71 84
5. Sensitivity Analysis ……… 6. Summary and Conclusions ……… References ……… Appendix A ..……….
PART V SUMMARY AND CONCLUSIONS ………
1. Summary and Conclusions ……… 2. Recommendations for Future Research ……… References ……….
LIST OF TABLES
Page PART II RELIABILITY-BASED LOAD AND RESISTANCE FACTOR DESIGN
FOR PIPING: AN EXPLORATORY CASE STUDY
1. Statistical characteristics of random variables……… 2. Minimum reliability index β corresponding to equation (10) ………. 3. Total safety factors ………. 4. Type of distribution of parameters ………
PART III CONSIDERATION OF UNCERTAINTIES IN SEISMIC ANALYSIS OF COUPLED BUILDING-PIPING SYSTEMS
1. Modal properties of uncoupled primary and secondary systems ……… 2. List of real earthquake records ………. 3. Properties of uncoupled primary and secondary systems ……… 4. Properties of uncoupled primary and secondary systems ……… 5. Percentile value of R1 and R2 corresponding to design response
defined at 84% NEP ………
PART IV PROBABILISTIC FRAMEWORK FOR CONDITION ASSESSMENT 1. Natural frequencies (Hz) for 5-DOF system ………..………. 2. d
j
P values corresponding to 95% non-exceedence probability
for 5-DOF system ……… 39 39 39 40
73 73 77 77
78
3. Mean values of DLI for 5-DOF system ……….. 4. Representative piping with both ends fixed ………. 5. Natural frequencies (Hz) for representative piping ……….. 6. Natural frequencies (Hz) for 5-DOF system
in sensitivity analysis ……… 7. Effect of uncertainty in the mean of mode shape ………. 8. Effect of uncertainty in the mean of frequency ……… 9. Effect of number of modes considered ……….
115 116 116
LIST OF FIGURES
Page PART II RELIABILITY-BASED LOAD AND RESISTANCE FACTOR DESIGN
FOR PIPING: AN EXPLORATORY CASE STUDY
1. Probability density functions for S, L, and Z ……… 2. Variation of reliability index with mean stress ratior ……….. 3. Verification with Monte Carlo simulation ……… 4. Effect of ΩP on load factor γP ………
5. Effect of ΩP on load factor γM ………..
6. Effect of ΩP on resistance factor φS ………..
7. Effect of ΩS on load factor γP ………
8. Effect of ΩS on load factor γM ………
9. Effect of ΩS on resistance factor φS ………
10. Effect of ΩM on load factor γP ……….
11. Effect of ΩM on load factor γM ……….
12. Effect of ΩM on resistance factor φS ………
13. Effect of ron load factor γP ……….
14. Effect of ron load factor γM ………..
15. Effect of ron resistance factor φS ………
16. Effect of distribution types on load factor γP ……….
17. Effect of distribution types on load factor γM ……….
18. Effect of distribution types on resistance factor φS ……….
19. Effect of statistical correlation on load factor γP ……….
20. Effect of statistical correlation on load factor γM ………
21. Effect of statistical correlation on resistance factor φS ……….
PART III CONSIDERATION OF UNCERTAINTIES IN SEISMIC ANALYSIS OF COUPLED BUILDING-PIPING SYSTEMS
1. SDOF primary - SDOF secondary system ……… 2. Relative significance of uncertainties in base excitation and modal
properties ……… 3. Input response spectrum corresponding to 84% NEP
(75 real earthquakes) ………. 4. Response corresponding to 84% NEP in Monte Carlo simulation …………. 5. Values of NEP for R1 needed to evaluate design response defined
at 84% NEP ……….. 6. Values of NEP for R2 needed to evaluate design response defined
at 84% NEP ……….. 7. Maximum error in mean of conditional Response, ………..
8. Response corresponding to 84% NEP in Monte Carlo simulation ………….. 9. Maximum error in SRMS method, ………..
10. Response corresponding to 84% NEP in Monte Carlo simulation …………3 i
Z R
R
ν
ν
ν
=
i
Z R
R
ν
ν
ν
=
50 51
79
79
80 80
81
81 82
82 83
PART IV PROBABILISTIC FRAMEWORK FOR CONDITION ASSESSMENT 1. Simple representative 5-DOF system ……… 2. Probability density functions fZ(z) for 1st storey rigidity ………..
3. Probability density functions fZ(z) for 2nd storey rigidity ……….
4. Probability density functions fZ(z) for 3rd storey rigidity ………..
5. Probability density functions fZ(z) for 4th storey rigidity ………..
6. Probability density functions fZ(z) for 5th storey rigidity ………..
7. Degradation likelihood index for 1st storey ………. 8. Degradation Likelihood Index for 2nd Storey ……….………..
9. Degradation Likelihood Index for 3rd Storey ……….………. 10. Degradation Likelihood Index for 4th Storey ………….……… 11. Degradation Likelihood Index for 5th Storey ………..….……….. 12. Fixed-Fixed Beam Considered for Representative Piping System ……….
PART I
1. Introduction
In recent years, significant emphasis has been placed on developing methods for risk-based design, operation, and inspection for power plant structural systems including equipment and piping. This research addresses the following three problems with emphasis on seismic loads, i.e., (i) Reliability-based load and resistance factor design of piping components, (ii)
Consideration of the effects of uncertainties on piping response in a coupled building-piping system analysis, and (iii) Probabilistic framework for condition assessment of piping systems using recorded vibration data. Each of these three topics is discussed in detail below.
(a) Reliability-based load and resistance factor design of piping components
random variables and γ and φ are respective partial factors of load and resistance determined for a given reliability ( or probability of failure). A design code developed using LRFD concept provides risk consistency, is likely to result in more economical use of materials, provides compatibility in design for different structural materials, and permits future modifications due to increased knowledge of failure mechanisms, material characterization, and loading environment. The WSD based ASME Section III rules address the design of various piping components such as straight pipes, elbows, bends, supports, valves, etc. The design rules, however, vary depending upon the loading and failure criteria. In this research, as a first step, we study the LRFD approach in the seismic design of a straight pipe segment subjected to seismic loads for failure by plastic instability. The design equations are used to arrive at an acceptable design for the piping components such as straight pipes and elbows. The adequacy of the design is then checked by analyzing the complete piping system consisting of various components and supports. As studied in detail by Gupta and Gupta [9], the seismic behavior of a piping system depends not only upon its own dynamic characteristics but also upon the interaction with the building on which it is supported. For consistency with the risk-based design, it is important to consider the effect of uncertainties in such analyses. The effect of uncertainties in the input earthquake and structural properties of the building and the piping systems on the seismic response of coupled building-piping systems is discussed below.
in the primary system characteristics due to material properties, soil-structure interaction or modeling techniques can lead to a significant variation in the secondary system response. In conventional analysis, uncertainties in frequency of primary system are taken into account by broadening or shifting peaks associated with floor spectra at the location of secondary system supports. Reed et. al. [12] proposed three alternative methods to account for these uncertainties, the probabilistic simulated method, approximate probabilistic method, and the simplified
method. These methods provide a floor spectra corresponding to 84% non-exceedance probability (NEP). However, these methods are not suited for the coupled primary-secondary system analysis as the floor response spectra are neither generated nor required. Traditionally, the analysis of a system subjected to earthquake input is handled using the response spectrum method. In the response spectrum method, the design spectra are typically defined at 84% NEP resulting in modal responses that correspond to 84% NEP. This only accounts for uncertainty in the earthquake input. It is considered that the total response obtained after combing individual modal responses will, in general, be close to the corresponding 84% NEP. Such a consideration represents upper bound and has served its purpose well. However, it cannot be extended directly to a situation where uncertainties in the primary and secondary system properties are also
(c) Probabilistic framework for condition assessment
For nuclear power plant piping, in-service inspection with nondestructive examination is used to ensure continued operability and safety against degradation related failures. Presently used in-service inspection methods are deterministic and require that the general location of damage be known a priori. Most of the methods use ambient or forced vibration data to evaluate the changes in dynamic properties for condition assessment [6, 10, 13]. These methods can be characterized as either deterministic or probabilistic depending upon the computational approaches used in condition assessment. The concept of estimating degradation of likelihood is more achievable than damage detection in an absolute sense due to unavoidable uncertainties and omissions as well as due to the difficulty in defining absolute damage [1]. A probability-based framework for condition assessment using changes in vibration data can be useful for non-destructive condition assessment. While some recent studies have used probabilistic methods for condition assessment [14,15], these methods often suffer from inconsistency in identifying the likelihood of
2. Proposed Research
The specific tasks required to achieve the objectives of this research are described below.
(a) Reliability-based load and resistance factor design of piping components
● Define/ Select an appropriate performance function for class 2 and 3 piping in accordance with Equation (9) of ND3600, ASME Section III given below.
3.0 for LevelD
2 2
1 m
e
S Z
M B t PD
B + ≤
where, B1, B2 = primary stress indices for the specific piping component.
P = design pressure, psi
D = outer diameter of the pipe, in
Ze = elastic section modulus of the pipe, in3
M = resultant moment due to a combination of mechanical loads, in-lb. Sm = allowable stress, psi
t = thickness, in
The various loads in ASME B&PVC Section III are categorized into four service levels, Levels A through D, respectively. Service level D, in addition to other mechanical loads, corresponds to the loads resulting from a Design Basis Earthquake (DBE).
● Evaluate the minimum reliability associated with Equation (9) of ND3600, ASME Section III conditioned upon the occurrence of a DBE. This process is often referred
to as code calibration.
● Non-dimensionalize the performance function for evaluating the partial load and strength factors in the framework of LRFD
● Evaluate load and resistance factors for specified target reliability values.
● As a check, compare the total safety factors associated with the presently used and the modified equations for the same reliability level.
● Validate the results using Monte Carlo simulation.
● Perform sensitivity analysis to evaluate the effects of changes in probabilistic distribution characterizing the random variables and their statistical properties.
(b) Consideration of uncertainties in seismic analysis of coupled building-piping systems
● Characterize the performance function for combining modal responses in accordance with response spectrum method.
● Non-dimensionalize the performance function for evaluating percentile values of each modal response corresponding to 84% NEP of the total response.
● Evaluate the percentile values of modal responses that give 84%NEP of the total response for uncertainties in base excitation and the properties of the primary and secondary system.
● Investigate the effects of variations in correlation between modal responses.
● Validate the results using Monte Carlo simulation.
(c) Probabilistic framework for condition assessment
● Use the knowledge gained in conducting uncertainty analysis for evaluating the dynamic properties of secondary systems and in risk-based design method to conduct an exploratory study for developing a probability-based framework for condition assessment using changes in recorded vibration data.
● Evaluate the consistency and accuracy of some recently proposed approaches that also consider uncertainties in the frequency and mode shape data before and after degradation.
● Consistent with existing studies, characterize degradation in terms of changes in rigidities associated with the element stiffness matrices.
● Unlike existing studies that are based on perturbation of modal properties, use changes in response to harmonic excitations for evaluating the changes in rigidity values. To do so, evaluate the steady-state responses analytically using modal properties before and after degradation.
● Unlike existing studies that are based on the assumption of Gaussian distribution, evaluate the probability density functions for changes in rigidity values before and after degradation numerically using Monte Carlo simulation within a simulation-based decision making framework.
● Since the probability density functions evaluated in this approach are highly dependent upon the frequency of input excitation, use a sine-sweep type of input and characterize the
likelihood of degradation statistically over the complete range of input frequencies.
● Conduct sensitivity analysis to study the accuracy and consistency of the proposed
3. Organization
This dissertation consists primarily of three manuscripts. The first manuscript, part II of the dissertation, describes the methodology used and the results obtained from our study related to reliability-based load and resistance factor design of piping components. The specific tasks related to the objective of this work are listed above under section 2(a). This manuscript has been accepted for publication in the international journal of Nuclear Engineering and Design. This work has also been presented on more than one occasion to the ASME committee on piping design that has recently setup a working group to further explore the development of a reliability-based piping design code.
The second manuscript, part III of the dissertation, gives the details of our work and the corresponding results for consideration of uncertainties in seismic analysis of coupled building-piping systems. The specific tasks related to the objective of this work are listed above under section 2(b). Certain aspects of this work were presented at the 16th International Conference on Structural Mechanics in Reactor Technology (SMiRT-16) and the corresponding paper was published in the conference proceedings. Another paper describing additional results has been accepted for publication and presentation at SMiRT-17 to be held later this year. We anticipate sending the manuscript contained in this dissertation for review and possible publication in the International Journal of Nuclear Engineering and Design soon after the completion of the requirements for this dissertation.
comprehensive, additional work is needed before this manuscript can be considered for review by a technical journal. It is so because the results presented in this manuscript are based on very simple systems. While the simplicity of these systems was extremely useful in understanding the complex problem and in developing the framework, additional systems with somewhat greater complexities are needed to evaluate the accuracy and consistency of the proposed framework.
References
1. Abdelghani, M., Basseville, M., and Benveniste, A.(1997). “In-operation damage
monitoring and diagnostics of vibrating structures, with applications to offshore structures and rotating machinery.” In proceedings of the15th International Modal Analysis
Conference, Orlando, Florida.
2. ASME (2001). “Rules for construction of nuclear facility components.” Boiler & Pressure Vessel Code Section III, ASME.
3. Assakkaf, I.A., Ayyub, B.M., and Mattei, N.J. (2000). “Reliability-based load and resistance factor design (LRFD) of hull structural components of surface ships.” Association of Scientists and Engineers-37th Annual Technical Symposium, May 10.
4. Ayyub, B. M., Beach, J., and Packard, T. (1995). “Methodology for the development of reliability-based design criteria for surface ship structures.” Naval Engineers Journal, ASNE, 107(1), 45-61.
5. Ayyub, B. M.and McCuen, R. H. (2002). “Probability, statistics, & reliability for engineers.” CRC Press LLC.
6. Cawley, P. and Adams, R.D. (1979). “The location of defects in structures from measurements of natural frequencies.” Journal of Strain Analysis, 4(2), 49-57.
7. Ellingwood, B., Macgregor, J.G., Galambos, T.V., and Cornell, C.A. (1982). “Probability based load criteria-load factors and load combinations.” Journal of the Structural Division, ASCE, 108(5), 978-997.
Mechanics in Reactor Technology, Porto Alegre, Brazil.
10. Messina, A., Jones, I.A., and Williams, E.J. (1997). “Multiple damage evaluation using natural frequency changes.” 15th International Modal Analysis Conference, Orlando, Florida.
11. Mirza, S. A. (1996). “Reliability-based design of reinforced concrete columns.” Structural Safety, 18, 179-194.
12. Reed, J. W., Kennedy, R.P., Lashkari, B., and Manuel, L. (1994). “In-structure response for calculating equipment capacities in SMA and SPRA reviews.” Current Issues Related to Nuclear Power Plant Structures,Equipment and Piping, Proceedings of the 5th International
Symposium, Orlando, Florida.
13. Shi, Z.Y., Law, S.S., and Zhang, L.M. (2000). “Damage localization by directly using incomplete mode shapes.” Journal of Engineering Mechanics, ASCE, 126(6), 656-660. 14. Sohn, H. and Law, K.H. (1997). “A Bayesian probabilistic approach for structure damage detection.” Earthquake Engineering and Structural Dynamics, 26, 1259-1281.
PART II
RELIABILITY-BASED LOAD AND RESISTANCE
FACTOR DESIGN FOR PIPING:
AN EXPLORATORY CASE STUDY
Abhinav Gupta and Byounghoan Choi
RELIABILITY-BASED LOAD AND RESISTANCE FACTOR DESIGN FOR PIPING: AN EXPLORATORY CASE STUDY
Abhinav Gupta and Byounghoan Choi
1. Introduction
Development of structural design methodology involves consideration of safety factors to account for uncertainty in loading, material characteristics, geometrical properties, modeling, analysis, etc. Management and control of risk due to uncertainties through proper design is a major engineering goal. The design codes and standards address uncertainties through safety factors that may be defined either implicitly such as those used for the Working Stress Design (WSD) format or explicitly such as those used for the Load and Resistance Factor Design (LRFD) format. Currently used piping design codes such as the Section III of the American Society of Mechanical Engineers' (ASME) Boiler and Pressure Vessel and ASME B31 codes rely primarily on the traditional WSD format in which the safety factors are prescribed
deterministically. These deterministic safety factors are based on several years of experience and supporting observations from the test data. While the Section III rules have worked very well over several years, the reliability of these designs can vary considerably leading sometimes to excessively conservative designs.
In recent years, consistency in design has been achieved by formally addressing
(1995) and Assakkaf et al. (2000) proposed the LRFD methodology for the structural design of surface ship structures and Mirza (1996) that for reinforced concrete columns. The ASME Section XI and Operation & Maintenance codes have adopted risk-informed methodologies for decisions involving in-service inspection, preventive maintenance, repair, and replacement. An effort is underway to evaluate the benefits of LRFD concept in the ASME-Section III piping design methodology (ASME 2002). Consistency in Sections III and XI is likely to provide a risk-informed lifecycle approach that would encompass construction which includes design,
operation, and maintenance.
A design code developed using LRFD concept provides risk consistency, is likely to result in more economical use of materials, provides compatibility in design across different structural materials, and permits future modifications due to increased knowledge of failure mechanisms, material characterization, and loading environment. It also provides a framework to account for the time-dependent degradation within a risk-based framework. Such a framework is useful in developing strategies for not only inspection and maintenance but also for life extension and license renewal. Other advantages include but are not limited to simplifications in system reliability analysis, and management of uncertainty in strength, loads and analytical models. Specific to piping design, consistency by using the LRFD concept in Section III is expected to reduce the quantity of seismic restraints or supports needed in a piping system. The consequent savings over the plant lifetime are likely to be significant due to reduced inspection and
maintenance costs.
of a straight pipe segment for failure by plastic instability. In recent years, significant progress has been made towards using risk-informed design and regulation for power plant systems. Several studies have suggested frameworks for a system-based approach to characterize the acceptable risk associated with a particular piping or equipment. In such a scenario, it is desirable to evaluate the load and resistance factors as a function of reliability and not just a value corresponding to the specified single target reliability as is the case in AISC and ACI codes. The discussion in this paper focuses on: (1) definition of a performance function and random variables to characterize the intended limit-state, (2) characterization of different random variables with appropriate probability distributions, (3) evaluation of the reliability with respect to the defined limit-state for piping designed using the existing code equations, (4) identification of a range for reliability levels to compute the partial safety factors, (5) computation of load and resistance factors (also known as partial safety factors), and (6) sensitivity analysis and the effect of correlation between the random variables. It is anticipated that this study will provide useful input to the work being undertaken by the ASME working group on piping design (ASME 2002).
2. Reliability-Based Limit State Design
A design equation that is based on the LRFD principles is very similar in appearance to the one that is based on deterministic factors of safety. However, the deterministic factors for the loading and the strength terms are selected depending upon a level of reliability acceptable to
failure modes. In the AISC code for the design of steel structures and the ACI code for the design of concrete structures, limit states are grouped into two categories. First, the ultimate limit states are used to characterize the strength requirements for preventing collapse. Second, the serviceability limit states are used to characterize the requirements for functional use of the structure. In general, if S denotes the strength and L the load, the reliability R can be defined as the probability when S > L. Mathematically,
) (S L P
R= > (1)
where P(-) denotes the probability of an event. The performance function can be written as
S L L S g
Z = ( , )= − (2)
or in general,
) , , ,
(X1 X2 Xn g
Z = K (3)
where Xi represents probabilistically defined variables for the loads and the strength. The
function g(-) is a limit state function that describes the failure criterion. That is,
g(-) > 0 failure state (4a)
g(-) = 0 limit state (4b)
g(-) < 0 survival state (4c)
The probability of failure Pf is then given by the joint probability distribution of Xi's.
n n
g
X X X
f f x x x dxdx dx
P n( , 2,... ) 1 2...
0 ) (
1 ...
2 1
∫ ∫
> −
= K (5)
where fX1X2...Xn(x1,x2,...xn)is the joint probability density function of the random variables
Xi's. In general, the joint density function is unknown and the evaluation of the integral is a
corresponding to a target reliability index are evaluated using the Advanced First-Order Reliability Method (AFORM) or also known as the Hasofer-Lind method. In AFORM, the performance function Z is expressed by a linear function obtained from a Taylor series expansion about the most probable failure point (x1*,x*2,K,xn*) at whichZ =g(x1*,x*2,K,xn*)=0. As shown in Figure 1 for the simple case of X1=S and X2=L, the reliability is then expressed in
terms of the reliability index β such that Pf =1−Φ(β), where Φ is the cumulative distribution function of the standard normal variate (Ang and Tang 1990). For a specified target reliability index, the probability distributions of the load and strength variables are used to evaluate the mean load and resistance factors. To do so, an iterative procedure such as that given by Ayyub and McCuen (2002), by Ang and Tang (1990), or by Haldar and Mahadevan (2000) is usually employed. The mean load factors γi and the mean resistance factor φs are expressed as
Xs s s X
i
i x x
i µ
= φ µ
=
γ * , * (6)
where Xi’s represent the random variables for loads and Xs that for the strength with respective
means denoted by
i
X
µ and µXs. The load and resistance factors together are also referred to as partial safety factors. The design equation based on LRFD concept can then be written as
S s Ln n L
L γ µ γ µ φ µ µ
γ1 1+ 2 2+K+ ≤ (7)
As in the AISC and ACI codes, the above equation can be modified further using the appropriate "bias factors" and express the load and the strength in terms of the nominal values (Ravindra and Galambos 1978) as
S L
L
L n nn n ns
n γ γ φ
s s ns i i
ni ν
φ φ ν γ
γ = , = and
s s Li
i i
S L
µ ν µ
ν = , =
where νiand νsare bias factors corresponding to load and strength, respectively. For simplicity, the bias factors are not used in the exploratory case study presented here and the partial safety factors are expressed in terms of their mean values.
3. Performance Function for Plastic Instability of Piping
The piping design criteria in Section III of the ASME Boiler and Pressure Vessel Code (ASME 2001) gives allowable stress limits for protecting the structural integrity of the pressure
boundary. There are two main aspects of piping design, the pressure design and the design of piping components for other mechanical loads. Pressure design involves sizing of the pipe for minimum wall thickness requirements. Design of piping components such as straight pipe or elbows involves evaluating the combined effects of pressure and moment. The various loads in Section III are categorized into four service levels, Levels A through D, respectively. Service level D, in addition to other mechanical loads, corresponds to the loads resulting from a Design Basis Earthquake (DBE). Further, piping supports and components in Section III are classified as Class 1, Class 2, or Class 3 depending upon the consideration of their importance to safety. The piping design rules for each class are given in the sub-articles NB-3600, NC-3600, and ND-3600 for Class1, Class 2, and Class 3, respectively. For exploratory case study presented in this paper, we do not consider any thermal effects. In accordance with ND-3600, the maximum allowable design pressure for a pipe with outer diameter D and thickness t is defined by
yt D
t S
P m
a
2 2
−
in which y = 0.4 and Sm is the allowable stress that is defined as the smaller of (i) one-fourth of
the ultimate stress (SU / 4), or (ii) two-third of the yield stress (2Sy / 3). Piping components are
designed according to Equation (9) of ND-3600 for the stresses due to pressure and moment.
D Level for 0
. 3
C Level for 25
. 2
B Level for 8
. 1
A Level for 5
. 1 2 2
1
m m m m e
S S S S Z
M B t PD B
≤ ≤ ≤ ≤ +
(10)
where,
B1, B2 = primary stress indices for the specific piping component.
P = design pressure, psi
Ze = elastic section modulus, in3
M = resultant moment due to a combination of mechanical loads, in-lb.
For a straight pipe, B1 and B2 are 0.5 and 1.0, respectively. The above equation is primarily
concerned with plastic instability of the piping components. As stated earlier in the context of working stress method of design, Equation 10 considers safety factors on the strength to specify allowable stresses for various load levels. No safety factors are considered for the loads – pressure and the moment terms. In the LRFD concept, the ultimate strength limit-state
corresponding to Equation 10 is given by the equation for the formation of a plastic hinge at a particular cross-section. Assuming the material behavior to be elastic-perfectly plastic, we get
where ZP is the plastic section modulus for a straight pipe cross-section.The corresponding
performance function is given by rearranging the above equation as 0
4 )
(− = − − =
P U
Z M t PD S
g (12)
Selection of the above performance function does not indicate that the formation of a plastic hinge is permitted in the new designs. Instead, the new designs would correspond to a specified acceptable reliability against the formation of the plastic hinge. It should also be noted that the formation of a plastic hinge does not mean a loss of integrity in the pressure boundary. The final design equations are arrived at by probabilistically determining the load and the resistance factors corresponding to a specified level of target reliability. If γP and γM represent the load
factors for the pressure and the moment, respectively, and φS that for the strength, the design
equation is written as
S U
P M
P S
Z M t
PD
φ γ
γ + ≤
4 (13)
It should be noted that the moment term in the above equation can be further separated into individual parts for moments due to each mechanical load such as the deadweight and the earthquake. For simplicity in illustrating the LRFD concept, we consider the combined moment and not the individual terms corresponding to each mechanical load. Further, we consider only the service Level D and also assume that the moment due to deadweight is much less than that due to earthquake such that the effect of deadweight moment is neglected. Finally, the stress indices B1 and B2 for a straight pipe are implicitly included in Equation 13. For other piping
U S P 2 M 1
PB PD2t +γ B ZM ≤φ S
γ (14)
Note that ZP is the plastic section modulus for a straight pipe and not the piping component.
At this point in the discussion we would like to mention that a performance function can also be specified corresponding to the design for internal pressure which is dictated by Equation 9. One may argue that the design for both the internal pressure and the plastic hinge should correspond to the same reliability levels for risk-consistency. However, it is extremely important to consider the nature of structural failure modes before doing so. Excessive internal pressure can cause, among other things, a sudden pipe-burst type of failure. Unlike plastic hinge formation which must progress to the formation of plastic hinge mechanism before failure in which the integrity of pressure boundary is not violated and a ductile failure mode provides sufficient response time, pipe-burst is a sudden (brittle) failure that is highly undesirable. Parallels to this situation can be drawn from the building design codes such as the ACI code for concrete structures in which a bending failure of the structural members is ductile and a shear failure is brittle. The brittle failure mode is avoided by overdesigning in shear relative to bending. Likewise, it would be desirable to avoid a failure due to excessive internal pressure by
overdesigning for it. One way to achieve this would be to use a much higher value of reliability level in the probabilistic analyses. In this paper, we do not apply LRFD concept to the design for internal pressure. The premise is that Equation 9 which is based on the traditional WSD format with deterministic safety factors has worked well over the years and provides a good basis for overdesigning against excessive internal pressure It should also be noted that overpressure relief is required for pressured piping systems which also limits the potential for failure due to
4. Characterization of Random Variables and Code Calibration
Calculation of partial safety factors requires probabilistic characterization of the load and strength variables in the limit-state equation. Such a characterization of these variables requires quantification of uncertainty and variability in them. Therefore, means, coefficients of variation, and distribution types need to be specified for each variable. This process is based on collection of relevant data and its statistical analysis. In this exploratory case study, meaningful estimates of the relevant quantities are taken based on those used previously by the ASME working group on piping design (Stevenson et al. 2000) with minor modifications based on communication with industry professionals. Stevenson et al. (2000) and Barnes et al. (2000) provide one such ASME sponsored study in which the various variables in Equation 10 are characterized probabilistically for evaluating the failure probabilities of piping systems. Based on this study, a lognormal distribution is first used to characterize the random variables. The effect of other distribution types on the partial safety factors is also studied later. We calculate the partial safety factors by considering the diameter to thickness ratio (D/t) as constant and the pipe material is taken as ASME SA 106 Gr B Carbon Steel pipe having a minimum specified ultimate strength SU equal
to 60 ksi and a minimum yield strength Sy equal to 35 ksi. According to Stevenson et al. (2000),
factor for the pressure term is relatively insensitive to the changes in the quantities like the mean design pressure and the type of probability distribution. The distributions, means, and
coefficients of variation for various random variables used in this study are summarized in Table 1. Later, the sensitivity of the partial load factors is studied by considering deviations in these estimates. To begin with, the random variables are considered to be statistically independent. The effect of correlated variables is studied later.
Once the random variables representing the load and the strength are characterized, the partial safety factors can be evaluated corresponding to a specified target reliability level using the advanced second moment method (Ayuub and McCuen 2002, Haldar and Mahadevan 2000, Ang and Tang 1990). The target reliability levels are typically selected based on the reliability levels that are implicit in the current designs. Such a process of developing LRFD guidelines to meet the target reliability levels that are implicit in the current practices is called code
associated with the present practice, i.e. Equation 10. If the maximum allowable design pressure
Pa for a piping with known D/t and Sm is calculated from Equation 9, piping can be designed to
withstand a maximum value of seismic moment that can be calculated as
t PDZ Z
S
M e
e m code
4 0
.
3 −
= ; 0 ≤ P ≤ 2Pa (15)
The maximum value of allowable moment calculated from the above equation corresponds to 84 percent non-exceedence probability conditioned upon a given design earthquake because the DBE response is typically calculated at the corresponding probability of non-exceedence (Kennedy 1999). For convenience, the performance function can be rewritten in a non-dimensional form by defining a mean stress ratio r
t D
Z r
P P M
4 µ
µ
= (16)
Figure 2 shows the minimum conditional reliability index β (reliability index for a given design earthquake)calculated by the AFORM for different values of the mean stress ratior. It should be noted that for mean design pressure µP less than equal to 2Paand the corresponding mean
design moment µM calculated from an 84 percent non-exceedence value given by Equation 15,
the minimum value of r that satisfies the limit-state equation is equal to 0.9. For r < 0.9, the mean design pressure µP is greater than 2Pa. As shown in Table 2, the reliability values are
5. System-Based Target Reliability
Conventionally, the partial safety factors are calculated for a target reliability value that is identified based on the minimum reliability levels calculated in the previous section. Specific to power plant piping, such an approach would, however, result in piping designs that may either be conservative or unconservative with respect to their contribution to the overall plant risk
calculated from a plant wide Probabilistic Risk Assessment (PRA). In other words, the
contribution of different piping systems to the overall plant risk varies significantly. Therefore, selection of a single target reliability for all piping systems in a plant will be governed by the reliability of a piping that has the maximum impact on the overall risk. Consequently, this target value is likely to be excessively conservative for piping that does not contribute significantly to the overall risk.
factors corresponding to the reliability levels identified for a particular piping in the plant-wide PRA. Such an approach would also provide a basis of determining the degree of redundancy and diversity needed in a design. To do so, it would be desirable to calculate partial safety factors for a range of target reliability index βο. To strike a balance with the current practice, the range can be chosen based on the minimum reliability levels calculated in the previous section and given in Table 2. Based on the β values in Table 2 and Figure 2, we take the lower bound as 1 and the upper bound as 3, i.e., 1≤β0 ≤3. Even though the highest value in Figure 2 is less than 2.5, the upper limit is taken as 3 primarily for academic purpose. Note that these β0 values represent reliability index conditioned upon a given design earthquake.
6. Computation of Partial Safety Factors
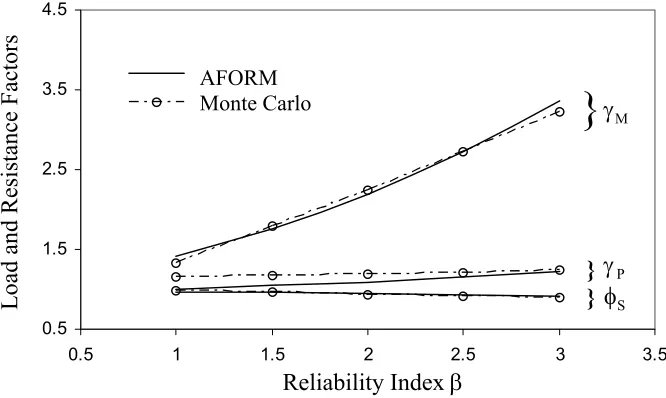
To begin with, we compare the partial safety factors calculated using the advanced second moment method with those calculated using the Monte Carlo simulation. The purpose is to evaluate the effect of non-linearity in the performance function on the computation of partial safety factors using the AFORM. For calculating the partial safety factors corresponding to a target reliability level, the AFORM does not require prior knowledge of the mean moment µM
because the mean values for the design pressure, the plastic section modulus, and the strength are known. However, this is not the case in a Monte Carlo simulation wherein the mean for the moment term is needed to calculate the failure point and the partial safety factors. Such a limitation is typically overcome by using AFORM within the Monte Carlo to evaluate
approximate values of µM. For illustration purposes, let us consider a linear performance function
∑
+ =i i i o a X
a x
g( ) (17)
in which ai are constants and Xi are the random variables. According to the AFORM, we can
write
∑
∑
Ω + = =
i
X i i
i X i o
g g
i i
a a a
2 0
)
( µ
µ σ
µ
β (18)
where µ, σ, and Ω represent the mean, standard deviation, and coefficient of variation, respectively. If a particular µXi is unknown, Equation 18 can be solved directly to evaluate its
value corresponding to a given value of target reliability β0. For non-linear performance function, a direct solution is not possible and the unknown mean is evaluated by an iterative solution. The iterative solution used for this purpose can be like the one suggested by Rackwitz and Fiessler (1978) with a slight modification that the equations are solved for the unknown mean corresponding to a given value of β0 and not vice versa. The mean calculated by such a procedure is then used in the Monte Carlo simulation for evaluating the partial safety factors. Approximately one million simulation sets are used for computing γ and φ factors corresponding to each value of β0. Figure 3 shows that the partial safety factors calculated using the AFORM and those calculated using the Monte Carlo simulation are close to each other.
Step 1. Express the design equation as S s P M M P P e M P L Z t D Z t D µ φ µ γ µ γ µ µ γ = + ≤ + 4 4 (19)
Step 2. Define a mean stress ratio
t D Z r P P M 4 µ µ =
Step 3. Calculate the total safety factor
(
r)
t D SF P S S L + = = 1 4 µ µ φ γ (20)
The total safety factors for various values of design pressure and rare compared in Table 3 which shows that the two sets of results are same, as they should be. As in case of Table 2, the safety factors are same irrespective of the value of D/t. Consequently, we consider only a single value of D/t in the rest of this study.
7. Sensitivity Analysis
In this section, we present the results of a parametric study conducted to explore the sensitivity of the partial safety factors to the changes in the characterization of various random variables summarized in Table 1. We study the effect of variability in the following four quantities: (i) coefficient of variation values for the P, M, and SU, (ii) mean stress ratio r, (iii) distribution
types used for characterizing the random variables, and (iv) the statistical correlation between the random variables.
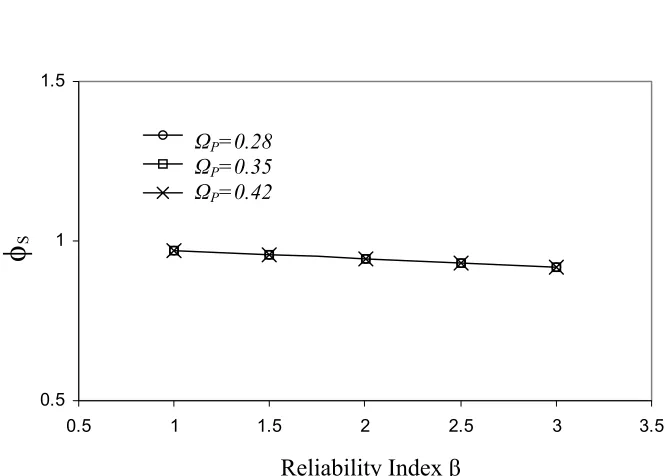
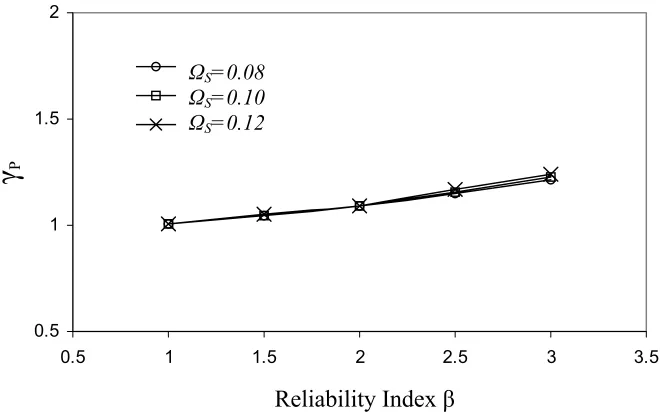
ignored as its value is very small relative to the corresponding values for other random variables. Each of the coefficient of variation is varied between ±20% of the values given in Table 1. Figures 4 to 12 give the partial load factors for each such case. As anticipated, a high value of
ΩM controls the calculation of load factors and a variation in its value significantly influences γM.
The effect of variations in ΩP, ΩM, and ΩS is relatively much smaller on γP and on φS.
(ii) Mean Stress Ratios: For different values of r, Figures 13 to 15 show the effect on partial safety factors. For a given value of target reliability index β0, it is observed that the load and the
resistance factors γM,γP and φS are insensitive to values of r when r ≥0.9. Even though the
safety factors are highly sensitive to the value of rand β0 for r <0.9, such small values of r correspond to a mean design pressure greater than 2Pa that is highly impractical.
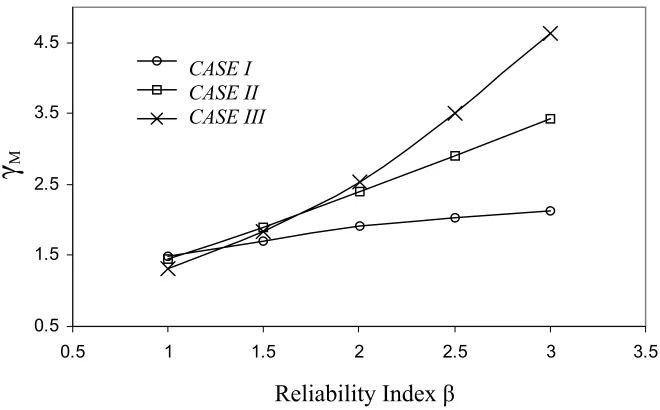
(iii) Distribution Types: Selection of the distributions for characterizing the random variables can be critical in the probabilistic analysis using AFORM. As stated earlier and given in Table 1, the random variables in this study are characterized as log-normal based on the existing studies conducted by the ASME working group on piping design (ASME 2002). We study the effect of distribution types by considering two additional cases. In one case all the random variables are characterized by normal distributions. In the second case, the pressure and the section modulus are characterized by log-normal distributions whereas the moment and ultimate strength are characterized by extreme value distributions, the Type II extreme value distribution for the moment and the Weibull distribution for the ultimate strength. Table 4 summarizes all the three cases and the effect on partial safety factors is shown in Figures 16 to 18. It is observed that characterization of variables by normal distribution, case I, gives conservative estimates for γP
distributions. It is important to note that the differences in γM for the lognormal and the Type II
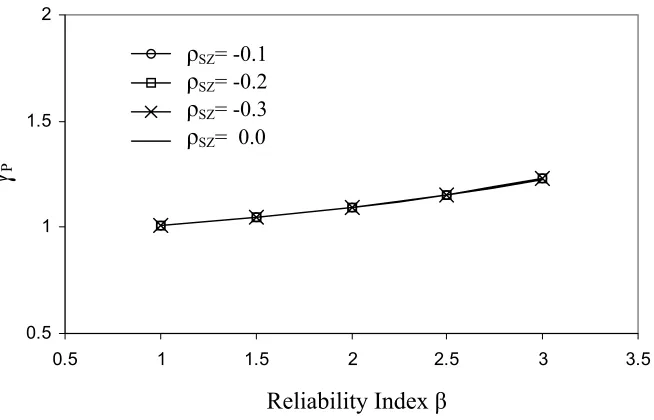
extreme value distributions are negligible for β0 less than 2.25. As discussed in detail earlier, the minimum reliability values associated with the current code are on the order of 2.25 or less. The upper limit, β0 = 3, is chosen primarily for academic purposes. Further, the uncertainty in moment is much larger than that in the pressure. Therefore, case II in which all the random variables are characterized as lognormal appears to be suitable in calculating the safety factors. (iv) Correlated Variables: Next, we study the effect of statistical correlation that may exist between certain random variables. For example, selection of a material with higher ultimate strength would result in a reduction in the lower section modulus. Therefore, the two variables appear to be negatively correlated. However, no statistical correlation exists between the design pressure and any other variable. Similarly, the moment is not correlated with any other variable. If ρ represents the statistical correlation and the subscripts p, s, m, and z the random variables for pressure, ultimate stress, moment, and section modulus, then we can write ρps =ρpz = ρzm =
ρpm = ρsm = 0. In this study the maximum value of correlation coefficient ρszis taken as -0.3.
Figures 19 to 21 illustrate the effects of statistical correlation for ρsz= 0.0, -0.1, -0.2, and -0.3. As
shown in these figures, the effect of statistical correlation on load and resistance factors is insignificant for reliability values.
8. Summary and Conclusions
ASME working group on piping design. While a complete piping system consists of several components such as straight pipes, elbows, branch connections, etc., only a cold straight pipe section is considered in this study. The performance function is defined with respect to a failure mode that is defined by plastic instability. For simplicity, only Service level D is considered and the effects of pressure and seismic moment are considered. Since the effect of dead weight is insignificant with respect to the DBE loading in service level D, it is neglected in the present study. As a first step in this process, the presently used design equation that is based on the working stress method of design is calibrated by calculating the minimum reliability levels associated with it for various values of design pressure and the diameter to thickness D/t ratio. It is observed that the minimum reliability index varies between a narrow range of 1.86 and 2.21 when mean design pressure is less than equal to 2Pa. The D/t ratio has no influence on the
minimum reliability levels. It is also shown that the D/t ratio has no influence on the partial safety factors calculated using LRFD approach. Monte Carlo simulation is used to verify the computation of partial safety factors using the First Order Reliability Method. It is illustrated that the total safety factor for the presently used design equation is same as that for a design equation based on the LRFD format in which the target reliability is equal to the minimum reliability of the presently used design equation.
approach also assists in the appropriate allocation of redundancies for defense in depth. Finally, the sensitivity of the partial safety factors is studied by (i) considering a variability in the values of the coefficient of variation for various random variables, (ii) varying the ratio of mean design pressure to mean design moment, (iii) considering different distribution types for each random variables, and (iv) considering the statistical correlation between specific random variables. The observations made from the sensitivity studies show that corresponding to a specified target reliability level β0 the safety factors are insensitive to the values of mean stress ratio when the mean design pressure is less than equal to 2Pa. The load factor γM is quite sensitive to the value
of coefficient of variation for the moment especially for larger values of β0. This is so because a large uncertainty in moment characterized by a higher value of its coefficient of variation governs the design. The effect of changes in the coefficient of variation for the pressure and the strength is relatively negligible on γP and φS. It is also observed that the load factors can vary
significantly for different types of distributions considered. For reliability index values corresponding to those encountered in practical applications, consideration of a lognormal distribution for the moment gives almost similar values of γM as those given by the consideration
of the Type II extreme value distribution. Significant differences exist for target β0 values greater than 2.25. Characterization of variables by normal distribution gives higher values for γP and φS
but much lower values for γM. Consideration of lognormal distribution for all the variables
Acknowledgement
This research was partially supported by the Center for Nuclear Power Plant Structures,
Equipment and Piping at North Carolina State University. Resources for the Center come from the dues paid by member organizations, Department of Energy through a sub-award to
References
Ang, A. H-S. and Tang, W. H.(1990). “Probability concepts in engineering planning and design.” Vol. II, Decision, Risk, and Reliability, John Wiley & Sons, NY.
Apostolakis, G. E. (1985). “Some issues related to goal allocation and performance criteria.”
Proceeding s of the 8th International Conference on Structural Mechanics and Reactor
Technology, Brussels, Belgium, Paper M2 4/3.
Apostolakis, G. E., Golay, M. W., Camp, A. L., Duran, F. A., Finnicum, D., and Ritterbusch, S. E. (2001). “A new risk-informed design and regulatory process.” Proceedings of the Advisory Committee on Reactor Safeguards Workshop on Future Reactors, June 6-6, NUREG/CP- 0175, Washington, DC.
ASME (2002). “Development of alternative reliability-based load and resistance factor design methods for piping,” A proposal submitted to ASME Center for Research and Technology Development, developed by the ASME working group on piping design, endorsed by ASME code committee and ASME research committee on risk technology, PI: B.M. Ayyub.
ASME (2001). “Rules for construction of nuclear facility components." Boiler & Pressure Vessel Code Section III, ASME.
Assakkaf, I.A., Ayyub, B. M., and Mattei, N. J. (2000). “Reliability-based load and resistance factor design (LRFD) of hull structural components of surface ships.” Association of Scientists and Engineers-37th Annual Technical Symposium, May 10.
Ayyub, B. M. and McCuen, R. H. (2002). “Probability, statistics, & reliability for engineers.” CRC Press LLC.
Barnes, R. W., Harris, D. O., Stevenson, J. D. (2000). “Demonstration of risk-informed design procedures for the ASME Nuclear Code.” ICONE8-8256, April 2-6, Baltimore, MD. Duran, F. A., Camp, A. L., Apostolakis, G. A., and Golay, M. W. (2000). “A framework for
regulatory requirements and industry standards for new nuclear power plants.” PSAM5- Probabilistic Safety Assessment and Management, November 27-December 1, Osaka, Japan. Ellingwood, B., MacGregor, J. G., Galambos, T. V., and Cornell, C. A. (1982). “Probability
based load criteria-load factors and load combinations.” Journal of the Structural Division, ASCE, 108(5), 978-997.
Fredenthal, A. M. (1947). “Safety of structures.” Transactions of the ASCE, 112, 125-180. Galambos, T. V. and Ravindra, M. K. (1973). “Tentative Load and resistance factor design
criteria for steel buildings.” Research Report No. 18, Civil Engineering Department, Washington University, St. Louis.
Gupta, A and Gupta, A. K. (1995).“Application of new developments in coupled seismic analysis of piping systems.” Transactions of the 13th International Conference of Structural Mechanics in Reactor Technology, Porto Alegre, Brazil, August.
Haldar, A. and Mahadevan, S. (2000). “Probability, reliability, and statistical methods in engineering design.” John Wiley & Sons, NY.
Hasofer, A.M. and Lind, N.C. (1974). “Exact and invariant second moment code format.” Journal of Engineering Mechanics, ASCE, 100(1), 111-121.
Kennedy, R. P. (1999). “Risk based seismic design criteria.” Nuclear Engineering and Design, 192,117-135.
MacGregor, J. D. (1976). “Safety and limit state design for reinforced concrete.” Canadian Journal of Civil Engineering, 3(4), 484-513.
Mirza, S. A. (1996). “Reliability-based design of reinforced concrete columns.” Structural Safety, 18, 179-194.
Nowak, A. S. (1993). “Calibration of LRFD bridge design code.” Department of Civil and Environmental Engineering Report UMCE 92-25, University of Michigan, MCHRP 12-33. Rackwitz, R. and Fiessler, B. (1978). “Structural stability under combined random load sequences.” Computers and Structures, 9, 489-494.
Ravindra, M. K. and Galambos, T. V. (1978). “Load and resistance factor design for steel.” Journal of the Structural Division, ASCE, 104(9), 1337-1353.
Stevenson, J. D., Harris, D. O., Hill, R. S., and Ghiocel, D. (2000).“Analysis of the reliability of
Table 1. Statistical characteristics of random variables
Variable Distribution Type Mean Value Coefficient of Variation
P Log-normal ≤2Pa* 0.35
Zp Log-normal From D/t value 0.05
M Log-normal N/A 0.50
Su Log-normal 75 ksi 0.10
*P
a is calculated from equation 8
Table 2. Minimum reliability index β corresponding to equation 10 Mean Design Pressure(µP)
D/t
0 Pa 2Pa
20 1.86 2.02 2.21 40 1.86 2.01 2.20 60 1.86 2.01 2.20 80 1.86 2.01 2.20
Table 3. Total safety factors Mean Design Pressure
(µP)
Mean Stress Ratio (r)
Current Design Equation
LRFD Based Equation
2.0 3.20 3.20
Pa
3.0 2.40 2.40
0.5 3.20 3.20
2Pa 1.5 1.92 1.92
Table 4. Type of distribution of parameters Distribution Type Variable
CASE I CASE II CASE III
P Normal Log-normal Log-normal
Z Normal Log-normal Log-normal
M Normal Log-normal Type II extreme value
Figure 1. Probability density functions for S, L, and Z
Z
βσ
Density
Fun
ctio
n
Z
µ
µ
Lµ
SFailure probability g ( ) < 0
1.7 1.9 2.1 2.3 2.5
0 1 2 3 4 5 6
Mean Stress Ratio r
Reliability Index
β
Figure 2. Variation of reliability index with mean stress ratior
fZ(z)
fL(l)
Figure 4. Effect of ΩP on load factor
γ
PFigure 3. Verification with Monte Carlo simulation
0.5 1.5 2.5 3.5 4.5
0.5 1 1.5 2 2.5 3 3.5
AFORM Monte Carlo
M
γ
}
P
γ
}
S
φ
}
Reliability Index β
Load and Resistance Factors
0.5 1 1.5 2
0.5 1 1.5 2 2.5 3 3.5
ΩP=0.28
ΩP=0.35
ΩP=0.42
Reliability Index β
Figure 5. Effect of ΩP on load factor
γ
MFigure 6. Effect of ΩP on resistance factor φS
0.5 1.5 2.5 3.5 4.5
0.5 1 1.5 2 2.5 3 3.5
ΩP=0.28
ΩP=0.35
ΩP=0.42
Reliability Index β
γ
M0.5 1 1.5
0.5 1 1.5 2 2.5 3 3.5
ΩP=0.28
ΩP=0.35
ΩP=0.42
Reliability Index β
Figure 8. Effect of ΩS on load factor
γ
MFigure 7. Effect of ΩS on load factor
γ
P0.5 1 1.5 2
0.5 1 1.5 2 2.5 3 3.5
ΩS=0.08
ΩS=0.10
ΩS=0.12
Reliability Index β
γ
P0.5 1.5 2.5 3.5 4.5
0.5 1 1.5 2 2.5 3 3.5
ΩS=0.08
ΩS=0.10
ΩS=0.12
Reliability Index β
Figure 9. Effect of ΩS on resistance factor φS
Figure 10. Effect of ΩM on load factor
γ
P0.5 1 1.5
0.5 1 1.5 2 2.5 3 3.5
ΩS=0.08
ΩS=0.10
ΩS=0.12
Reliability Index β
φ
S0.5 1 1.5 2
0.5 1 1.5 2 2.5 3 3.5
ΩM=0.40
ΩM=0.50
ΩM=0.60
Reliability Index β
Figure 11. Effect of ΩM on load factor
γ
MFigure 12. Effect of ΩM on resistance factor φS
0.5 1.5 2.5 3.5 4.5
0.5 1 1.5 2 2.5 3 3.5
ΩM=0.40
ΩM=0.50
ΩM=0.60
Reliability Index β
γ
M0.5 1 1.5
0.5 1 1.5 2 2.5 3 3.5
ΩM=0.40
ΩM=0.50
ΩM=0.60
Reliability Index β
Figure 13. Effect of ron load factor
γ
P0 0.5 1 1.5 2 2.5 3
0 1 2 3 4 5
β0 =1.0
β0 =1.5
β0 =2.0
β0 =2.5
β0 =3.0
Mean Stress Ratio r
γ
PFigure 14. Effect of ron load factor
γ
M0.5 2.5 4.5 6.5
0 1 2 3 4 5
Mean Stress Ratio r
γ
Mβ0 =1.0
β0 =1.5
β0 =2.0
β0 =2.5
Figure 16. Effect of distribution types on load factor
γ
P0.5 1 1.5 2
0.5 1 1.5 2 2.5 3 3.5
CASE I CASE II CASE III
Reliability Index β
γ
PFigure 15. Effect of ron resistance factor φS
0.5 1 1.5
0 1 2 3 4 5
Mean Stress Ratio r
φ
Sβ0 =1.0
β0 =1.5
β0 =2.0
β0 =2.5
Figure 17. Effect of distribution types on load factor
γ
MFigure 18. Effect of distribution types on resistance factor φS
0.5 1.5 2.5 3.5 4.5
0.5 1 1.5 2 2.5 3 3.5
CASE I CASE II CASE III
Reliability Index β
γ
M0.5 1 1.5
0.5 1 1.5 2 2.5 3 3.5
CASE I CASE II CASE III
Reliability Index β
Figure 19. Effect of statistical correlation on load factor
γ
PFigure 20. Effect of statistical correlation on load factor
γ
M0.5 1 1.5 2
0.5 1 1.5 2 2.5 3 3.5
ρSZ= -0.1
ρSZ= -0.2
ρSZ= -0.3
ρSZ= 0.0
Reliability Index β
γ
P0.5 1.5 2.5 3.5 4.5
0 0.5 1 1.5 2 2.5 3 3.5
ρSZ= -0.1
ρSZ= -0.2
ρSZ= -0.3
ρSZ= 0.0
Reliability Index β
Figure 21. Effect of statistical correlation on resistance factor φS
0.5 1 1.5
0 0.5 1 1.5 2 2.5 3 3.5
ρSZ= -0.1
ρSZ= -0.2
ρSZ= -0.3
ρSZ= 0.0
Reliability Index β