Identification of Arsenic Content in Soil Using
Spectral Signature
Vaibhav N. Lokhande1, Dr. Ratnadeep R. Deshmukh2
P.G. Student, Department of Computer Science and Information Technology, Dr. Babasaheb Ambedkar Marathwada
University, Aurangabad, Maharashtra, India1
Professor, Department of Computer Science and Information Technology, Dr. Babasaheb Ambedkar Marathwada
University, Aurangabad, Maharashtra, India2
ABSTRACT: The world is facing huge problem of soil pollution. The result of soil pollution leads to thrashing of environment and health. So it is important to know about soil quality with metals. This research aims to identify content of arsenic within soil samples having use of FieldSpec4 Spectroradiometer. The instrument ASD FieldSpec4 Spectroradiometer is used for gathering spectral signature measurement of soil samples collected from Aurangabad district of Maharashtra India. We used regression technique Partial Least Squares (PLS) to calculate the expected reflectance spectroscopy in the VNIR ranges to identify the arsenic content in the soil samples. It is used with several spectral processing techniques including first derivative, Savitzky-Golay smoothing, Median Filter, Gaussian Filter are used. The high-quality results illustrate that soil spectroscopy in VNIR is a capable method for calculation of As content in soil. For identification of content of arsenic we used Normalized Difference Spectral Index which gives content value of element arsenic in each samples.
KEYWORDS: Arsenic (As), NDSI, NIR, PLS, VNIR.
I. INTRODUCTION
Arsenic (As) is a poisonous element to the atmosphere procedure and it is often called carcinogenic aspect. In view that final few years as a result of human made movements, such as smelting, mining, pesticides ,animal manures, chemical fertilizers and irrigation with polluted water, have prompted the steady increases of As content material in the soil of agriculture land. The immoderate As accumulation in agricultural soils no longer simplest hinders the progress and reduces the production of crops but additionally damage the crops, reduces the best of agricultural lands. In addition, if As enters the human physique by means of meals system, it could intent a major health hazard.
Polluted factors concentrations in soils can even be measured, but their happening supported with massive-scale sampling and technical analysis systems that needs additional time, not economical, and splendid once when utilized on a great scale. The spectral value gives provides helpful choice to usual ways in which soil factors investigation as a result of its correct, convenience and celerity.. With the sooner decades, arsenic and copper content in the soils of Agriculture field inflated quickly and down the quality of crops. People are having threat of excessive pollution in soils and meals. As luck, progressively concentration has been given to control the heavy metals in soils and estimation of its impact on agro ecosystems. Looking forward based on usual chemical analysis methods and enormous-scale sampling, Cu and As concentrations in soils will likely be measured, however the hostile importance is that they are time-drinking, not effective, and really expensive once applied at an outsized scale in polluted agriculture fields.
within the soil samples. They equated PLS with OPLS [1]. Tiezhu Shi et al. they have experimented to find new technique of controlling pollution in the soil samples with various pre-processing methods to get the desired output with rice crops.
J. Kobza examined problem with soil pollution with crops in Slovakia region. They tested the metal contamination in different agriculture sites. The major toxic elements are observed are As, Cd, the Problem of crop and soil contamination with heavy metals in Slovakia..The result concluded with o.4% region affected with soil pollution. [3].Antoine Stevens et al. gained the Soil Organic Carbon content was often used in identification of greenhouse emission fluxes which s major sign of soil quality. VNIR range allows different method to analysis process. This leads to better utilization of time for carbon content [4].
H.M. Bartholomeus et al. has done research on various soil sample in various zones he identified large difference in organic carbon content that are specially taken in various climate zones. The readings are taken at various environment .The data is taken to preprocessing having modeling with partial least square technique. [5].REN Hong-Yan et al. have did study on investigating toxic elements in the soil with Spectroradiometer which is used for the environment system by remote sensing. The project is taken for finding As, Cu for soil quality improvement checking in different areas. [6].
Chang CW et al. have obtained the content of As,Cu,cd in soil samples from fields of Baoshan Mine, that are identified with ASD FieldSpec FR Spectroradiometer using spectral reflectance. The regression technique is used for identifying content. [7].Mark Cave et al. identified approach for soil pollution with various methods. The various soil samples are taken for testing. The toxicity reduces the soil quality due to toxic elements. Particularly affected metals they identified with spectral reflectance [8].
II. MATERIALS AND METHODOLOGY A. Study Area:
The Soil Samples collected from Aurangabad District of Maharashtra India. The district Aurangabad is in Maharashtra state in western India. It is located at 19° 53' N and 75° 23' E having annual mean temperature at the study point from 17 to 33 °C. Total 15 samples were collected from different agriculture lands in the district. They are sieved through 2 mm sieve and taken for measurements.
B. Spectral Measurements and Pre-processing
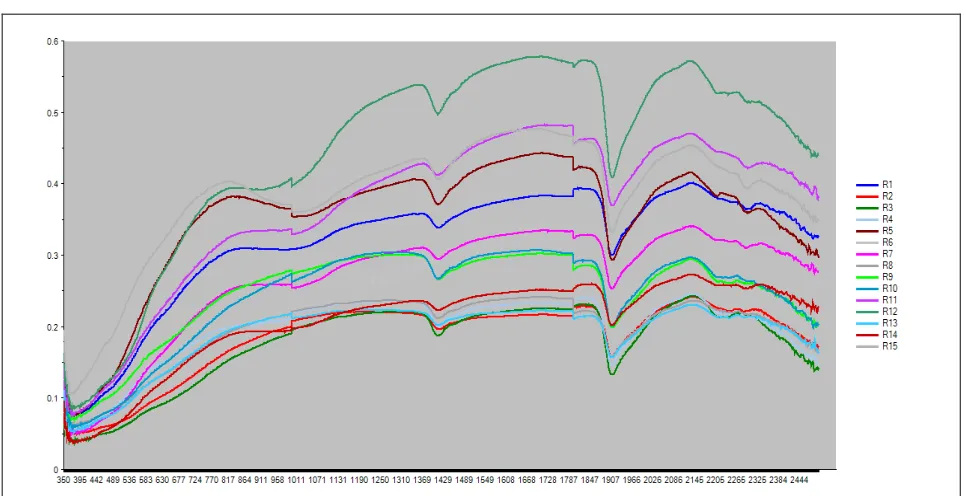
The FieldSpec4 Spectroradiometer is used for measurements of soil samples. The instrument recorded spectra with a resolution of 1.4nm i.e.(350-1000nm)and 2nm i.e.(1000-2500nm)and interpolated the data to produce 1-nm-spaced data. Spectral Reflectance collected with the wavelength starting from 350nm to 2500 nm. The measured values are interpolated, and finally the Spectroradiometer gives a spectrum of 2151 bands with a uniform spectral interval of 1 nm.The light source is having height 44.5 cm, height of Gun is 5 cm and distance between gun and the light source is 50cm. The Sample spectral reflectance is taken on 7/04/2016 between 3 pm to 4 pm.
Fig 1: Reflectance measurement of all soil samples
C. Methodology
1. Soil Arsenic Content Prediction Using PLSR
The measured accuracy strongly relies over the input data pretreatment method which is used to process the spectral reflectance. For multivariate calibration, the partial least squares (PLS) regression is used. PLS is a valuable system for setting up predictive models when there are numerous variables and high collinearity. It can take care of severe multicollinearity and the drawback of number of samples lower than predictor variables. All calculations performed using Unscrambler X 10.4(64 bit) [6].
Table 1: Comparison between processing Techniques
Processing Technique RMSE Calibration RMSE Validation R2 Calibration R2 Validation
First Derivative 0.7401627 0.7620824 0.9995654 0.9995407
Savitzky-Golay 0.5829342 0.6029395 0.9997305 0.99997117
Median Filter 0.4772098 0.4892473 0.9998193 0.9998138
2. Soil Arsenic Content Prediction Using Normalized Difference Spectral Index
NDSI values are calculated from the field spectra which are processed by the data pretreatment methods adopted by the best calibrated PLSR model of the soil Samples. And the NDSI value which has the highest correlation with soil As contents are used for predicting the soil As contents in the soil samples [2].
NDSI (x, y) = (y −x) / (x + y)
Where x and y are the reflectance at the wavelengths of i and j nm over the spectral region of 350−1200 nm. NDSI (R812, R782) = (R812-R782) / (R812+R782)
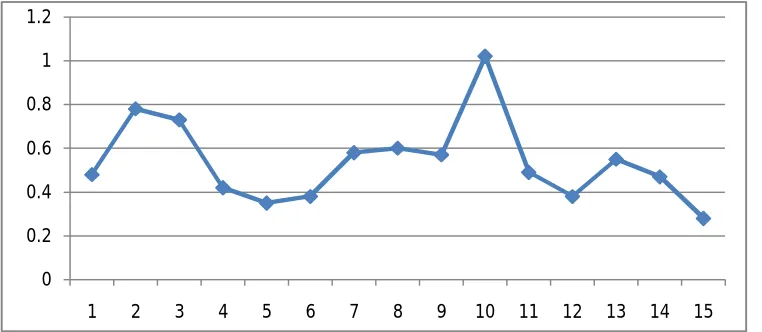
Fig 2: Arsenic content (%) of all samples from 1 to 15
III.RESULT AND DISCUSSION
The content of Arsenic varies with different soil samples. These contents are obtained from normalized difference spectral index. The range is obtained from 0.28 to 1.02.Soil contamination is related with toxicity of element affects on soil quality and reduces crop growth. These results on crop may lead to crop damage. Hence the level decides in what extent it matters on soil quality. The arsenic content level is specified with different levels that are varied from 0 to 0.5 are in safe mode with this there is no threat to soil or crop. The range between 0.5-1.0 is particularly less harmful and above it more harmful to soil quality. The below table shows the toxicity levels of arsenic content in soil.
Table 1: Toxicity Level of Arsenic in Soil
Range (%) Level
0-0.5 Safe
0.5-1.0 Less Harmful
> 1.0 More Harmful
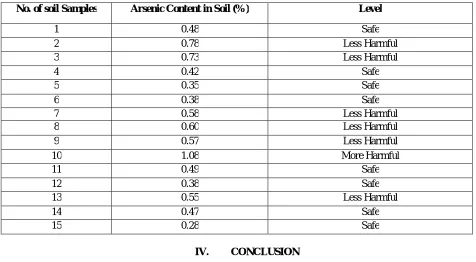
With reference to toxicity table we compare the levels of toxicity within each soil sample and are considered to be safe, less harmful or more harmful.
0 0.2 0.4 0.6 0.8 1 1.2
Table 3: Result of Soil Samples with Arsenic Content No. of soil Samples Arsenic Content in Soil (%) Level
1 0.48 Safe
2 0.78 Less Harmful
3 0.73 Less Harmful
4 0.42 Safe
5 0.35 Safe
6 0.38 Safe
7 0.58 Less Harmful
8 0.60 Less Harmful
9 0.57 Less Harmful
10 1.08 More Harmful
11 0.49 Safe
12 0.38 Safe
13 0.55 Less Harmful
14 0.47 Safe
15 0.28 Safe
IV. CONCLUSION
This research gives content of As in soil samples with the help of spectral data. PLS method used for the determination of Arsenic content. The various pre-processing methods with the spectral data give good effect on the proposed model. Using first Derivative better reduce the noise on spectral data and obtain the best models. The peak reflectance values with NDSI having 812 and 782 nm is measured from the spectral data used as As contents prediction in agricultural soils. The toxicity level of arsenic determines how soil is contaminated which is used for agriculture purpose.
ACKNOWLEDGEMENT
This work is supported by Department of Science and Technology under the Funds for Infrastructure under Science and Technology (DST-FIST) with sanction no. SR/FST/ETI-340/2013 to Department of Computer Science and Information Technology, Dr. Babasaheb Ambedkar Marathwada University, Aurangabad, Maharashtra, India. The authors would like to thank Department and University Authorities for providing the infrastructure and necessary support for carrying out the research
REFERENCES
1 Guanghui Zheng and Shenglu Zhou,Guanghui Zhen, “Possibilities of Reflectance to Predict Soil Arsenic”,(ICISE2009), pp 4990-
4992, Sept, 2009
.
2. Tiezhu SHI,Huizeng Liu,Junjie Wang,Yiyun Chen,TengFei and Guofeng Wu,“Monitoring Arsenic Contamination in Agriculture Soils with Reflectance Spectroscopy of Rice Plants”,(Environmental Science & Technology),pp 6264-6472,May 14,2014.
3. J Kobza, “Soil and plant pollution by potentially toxic elements in Slovakia”,PLANT SOIL ENVIRON pp 243-248,2005. 4. Antonie Stevens a,BAS van Wesemael a, Harm Bartholomeus b,Damien Rosilon c,Bernard Tychon c,Eyal Ben –Dor ,“Laboratory
Field an Airborne spectroscopy for monitoring organic carbon content in agricultural soils”, Geoderma 144, 12 Dec 2007.
5. H.M. Bartholomeus a, M.E. Schaepman a, L. Kooistra a, A. Stevens b, W.B. Hoogmoed, “Spectral reflectance based indices for soil organic carbon quantification”, pp-28–36, 2008.
8. Mark Cave, Helen Taylor & Joanna Wragg, “Estimation of the bioaccessible arsenic fraction in soils using near infrared spectroscopy”, pp 470-478, 17 Jul, 2007.
9. L. Q. Ma, and W. G. Harris, “Arsenic Concentrations in Florida Surface Soils: Influence of Soil Type and Properties”, in Soil Sci. Soc. Am. J. 66:632–640 (2002).
10. Shamsoddini, S. Raval , R. Taplin, “Spectroscopic Analysis Of Soil Metal Contamination Around A Derelict Mine Site In The Blue Mountains, Australia”, ISPRS Technical Commission VII Symposium, Volume II-7, 2014, 29 September – 2 October 2014.
11. Selige, T., Bohner, J., Schmidhalter, U.,“High resolution top soil mapping using hyper spectral image and field data in multivariate regression modelling procedures”,Geoderma 136 (1–2), pp. 235–244,2006.
12. Yong Hea, Min Huanga, Annia Garcıaa, Antihus Hernandezab, Haiyan Song, “Prediction of soil macronutrients content using near- infrared spectroscopy”, pp.144–153,March 2007.
13. REN Hong-Yan, ZHUANG Da-Fang, A.N.SINGH, PAN Jian-Jun, QIU Dong-Sheng and SHI Run-He, “Estimation of As and Cu Contamination in Agricultural Soils Around a Mining Area by Reflectance Spectroscopy: A Case Study”, 719–726, July 2009.
14. M.R. MalekiL.,Van Holm,H. Ramon, R. Merckx, J. De Baerde maeker and A.M Mouazen ,“Phosphorus Sensing for Fresh Soils using Visible and Near Infrared Spectroscopy”, pp. 425–436,sept 2006.
15. Irons, J.R Weismiller, R.A. and Petersen, G.W., Soil Reflectance. In: G. Asrar, “Theory and Applications of Remote Sensing”, John Wiley & Sons, Washington D.C, pp. 66-106. 1989.
16. Henderson, T.L., Baumgardner, M.F., Franzmeier, D.P., Stott, D.E. and Coster, D.C.,“High Dimensional Reflectance Analysis of Soil Organic Matter”, Soil Science Society of America Journal, 56, pp.865-872, 1992.
17. CAVE, HELEN TAYLOR and JOANNA WRAGG, “Estimation of the bio accessible arsenic fraction in soils using near infrared spectroscopy”, Journal of Environmental Science and Health Part A, pp 1293–1301, 17 July 2007.
18. Bhosle Arjun B. and Khadke Parag , “A Soil Analysis And Its Environmental Impact On Nanded City, MAHARASHTRA”, RESEARCH FRONT Vol. 1, No. 1, March, 2013.