This is an open access journal, and articles are distributed under the terms of the Creative Commons Attribution-Non Commercial-ShareAlike 4.0 License, which allows others to remix, tweak, and build upon the work non-commercially, as long as appropriate credit is given and the new creations are licensed under the identical terms.
© 2018 Journal of Advanced Pharmacy Education & Research | Published by SPER Publication
59
Using nanotechnology for enhancing phosphorus fertilizer use
efficiency of peanut bean grown in sandy soils
Rehab H. Hagab
1, Yousra H. Kotp
2*, Doaa Eissa
31 Department of Soil Fertility and Microbiology, Desert Research Center, El-Mataryia, Cairo, Egypt, 2 Department of Hydrogeochemistry, Desert Research Center,
El-Mataryia, Cairo, Egypt, 3 Department of Soil Physics and Chemistry, Desert Research Center, El-Mataryia, Cairo, Egypt.
Correspondence:Yousra H. Kotp, Department of Hydrogeochemistry, Desert Research Center, El-Mataryia, Cairo, Egypt, Email:yoso2000 2000 @ yahoo.com.
ABSTRACT
A field experiment was carried out at Baloza Research Station of the Desert Research Center, North Sinai, Egypt, to study the effect of applying 50, 75 and 100% of the recommended rates of nano-zeolite phosphorus (20.9% P2O5), zeolite phosphorus (8% P2O5), and the
ordinary superphosphate fertilizer (15.5% P2O5) to yield components, nutrients content, uptake by straw, seeds of peanut crop (Giza 6
cultivar), and the level of available nutrients in the sandy soil. Zeolite and nano porous-zeolite measuring a dimension of 730.8 and 90.2 nm, respectively, were used in this study. Application of nano-zeolite phosphorus resulted in the highest values of yield components including 1.89, 3.48, 1.46-ton fed-1 and 53.2 % for pod, straw, seeds crop and oil content, respectively. This study came to the
conclusion that the well-organized use of fertilizers can be enhanced through using nano sources, so the pollution hazard can be reduced.
Keywords:Nano-zeolite phosphorus, zeolite phosphorus, peanut, fertilizer recovery efficiency.
Introduction
The continuous increase in application of fertilizers to soil threatens the sustainability of agricultural frameworks and surroundings. In fact, fertilizers have a significant role in food safety in developing countries, especially when using high yielding sets that require high amounts of fertilizers. In spite of this, it was perceived that yields of many crops began to decline due to the excessive fertilization and the loss in soil organic matter. Moreover, heavy applications of nitrogen (N) and phosphorus (P) fertilizers contaminated the groundwater and led to eutrophication in water ecosystems, as well. The efficient use of fertilizers is about 20-50 percent for N and 10-25 percent for P fertilizers, which implies that food manufactures will have to be much well-organized than previous [1]. Application of nano
fertilizers is a newly emerging technique that could be used in agriculture to improve the plant growth. The superiority of this technique over the conventional fertilizers is mainly managed by decreasing the wastage of fertilizers, and consequently, the risk of environmental pollution would be low as well. Adhikari et al.
reported that one of the compensations of such fertilizers is that they can be used in fewer amounts than the ordinary fertilizers, which reduces the cost of fertilizer application, and would be economical from the farmers’ point of view [2].
Nanotechnology constitutes in several technologies related to the manipulation of the material at a scale of less than 100 nm. Particles in this scale fall in a transitional region between individual atoms or molecules and bulk material, which can lead to significant modifications in the chemical and physical characteristics of the material. Use of nano-fertilizers is one potential option available or enhancing the efficient use of fertilizers and increasing crop yields [3]. In the framework of
sustainable agriculture, applying novel technologies (including nano-fertilizers) is considered as one of the most promising approaches to the substantial increase of crop production [4].
Regarding the low competence of the ordinary fertilizers (merely 30–50%) and the few management options to enhance the rates, DeRosa et al. considered the use of nanotechnology in fertilizer research as a potential solution for the low apply efficiency [3].
Although more than a few agricultural researchers were interested in developing nanomaterials related to fertilizers, the directly-connected research is lacking in Egypt [4-7].
Recently, zeolites have been used in an extensive selection of agricultural developments as soil conditioner, gradually free fertilizer, heavy metals such as (Cu, Cd, Pb, Zn), dietary enhancements in animal nutrition, transporter of insecticides, fungicides, herbicides, and deodorizers and humidity-controlling agents for animal manure [8]. Zeolites and Nano-clays are a
Access this article online
Website: www.japer.in E-ISSN: 2249-3379
How to cite this article: Rehab H. Hagab, Yousra H. Kotp, Doaa Eissa.
Using nanotechnology for enhancing phosphorus fertilizer use efficiency of peanut bean grown in sandy soils. J Adv Pharm Edu Res 2018;8(3):59-67.
60 Journal of Advanced Pharmacy Education & Research | Jul-Sep 2018 | Vol 8 | Issue 3
collection of minerals with a honeycomb-like covered crystal structure and can enhance efficiency of fertilizer utilization. They can be packed with N, K, P, Ca and trace nutrients, and so act as "on demand" nutrients provider. However, Leggo confirmed that the major effect of zeolites in cultivation is N uptake in advantageous amount for plant growth and increasing aeration [9].
The use of soluble P fertilizers is a reason for groundwater pollution. In fact, P releasing dynamics of the engrossed appearance (in zeolites) is slower than ionic shape.
The objective of this study was to prepare a nano-zeolite material that contains P, and to determine its effects on growth, yield, as well as N, P and K nutritional status in peanut bean crop grown in a sandy soil. Finally, the study aimed to compare the efficiency of this material against the ordinary P fertilizer.
Materials and Methods
Synthesis of zeolite Nanoparticle
Natural zeolite (Z) sample was collected from Raatec Company with the chemical composition of zeolite ssz-73 2.6%, Silicon oxide 1%, Donpeacorite 15.3%, and Clinoptiloloite 81.1%. At the initial stage, size of Z mineral reduced to nano-level with a 24 blade FRITSCH Rotar Mill (Model-Pulverizette-14). This process continued for five steps. Afterward, the same material was ball milled at ambient temperature and under high energy intensity, so the Z powder was burned at 400 ˚C for 3 hours.
Fabrication of nano-porous zeolite material
A laboratory test was made to manufacture P fertilizers by means of Z and nano-zeolite (NZ) and to learn the release outline. The Z and NZ-based fertilizers were made-up under ambient circumstances by impregnation and plain liquid interest hydrothermal technique [10]. Z and NZ Adsorbents were heated
at 150°C for 3 days in a warm air oven before use to enhance the professional adsorption of P. The necessary quantity of di-potassium hydrogen orthophosphate crystals was uniformed with distilled water with constant shaking. The di-potassium hydrogen orthophosphate solution was heated at 120°C till it altered from the crystal arrangement to liquid, and then the necessary amount of adsorbents (Z or NZ) were added at a ratio of 1:1 (w/w). The set blender was constantly stirred until the liquid fertilizer totally absorbed on the Z or NZ. Afterward, the blender was cooled down with air (80ºC) and a crystal structure formed. A continuous cooling of the material was done at 50ºC, and carboxyl methyl cellulose sodium salt was added to the solid mixture (about 10% of the weight of the Z or NZ). The combination was air desiccated and pulverized for further study. Two different ranges of fertilizers of dipotassium hydrogen orthophosphate loaded Z and NZ (1:1) were set with constant shaking. The total P content of the fertilizers was predictable and the formed fertilizers called zeolite-P(ZP) and nano-zeolite-P (NZP) for zeolite and nano-zeolite loaded with phosphate fertilizer, respectively [11].
Characterization of ZP and NZP using X-ray
diffraction, SEM, IR spectra and TGA
thermal analysis
Powder X-ray diffraction (XRD) patterns were carried out using Shimadzu X-ray diffractometer, model XD 490 Shimadzu, Japan, with a nickel filter and Cu–Kα radiation tube. The scanning electron microscopy (SEM) photographs were approved for Z, NZ, ZP and NZP samples using SEM Quanta FEG attached to EDX unit, with accelerating voltage of 30 k.v, (magnification 250x up to 20000 and resolution for Gun.1m). Samples were coated with gold or carbon. FTIR spectra were considered with BOMEM FT-IR spectrometer, MB 147, Canada, with KBr disk technique using a range of 400–4000 cm−1. Thermal stabilities
and the solid-state dehydration changes of the obtained fertilizers were approved using a DT-60H thermal analyzer, Shimadzu, Japan. The samples were measured from 25 °C up to 1,000°C with a heating rate of 10 deg min−1 in nitrogen gas atmosphere.
Particle size distribution
Both adsorbents (Z and NZ) and fertilizers (ZP and NZP) were sieved through 40 μm sieves and the sizes of particle were measured using dynamic light scattering (DLS, Malvern Zetasizer Nano-ZS Nano Series). About 0.1 mg of sample was dispersed in 10 ml of water and sonicated for 30 min with 10 seconds on-off cycle. The samples were discreted in water and the size measurements were carried out at 25°C at 90º/173º scattering angle.
Field validation study
A field experiment was carried out at Baloza Research Station of the Desert Research Center, Egypt, located at 31° 3′ 0″ N, 32° 36′ 0″ E on peanut bean crop for two successive seasons, i.e. 2016 and 2017. The objective of this study was to evaluate the effect of application of Nano Zeolite Phosphor (NZP 20.9% P2O5), Zeolite Phosphor (ZP 8% P2O5) fertilizers-loaded P from
solid KH2PO4 compared with the conventional fertilizer Super
Phosphate fertilizer (SP 15.5% P2O5) on growth, yield, nutrient
contents and uptake of peanut plants.
The experiment was carried out in a factorial randomized complete block design with three replications. Two factors were studied; the first factor was P fertilizer source as control, SP, NZP and ZP, while the second factor was the rate of application as 50, 75 and 100% of the recommended rate of P, which is 30 kg P2O5/fed and represents 144 kg/fed of NZP (20.9% P2O5),
375 kg/fed of ZP (8% P2O5) and 194 kg/fed super phosphate
fertilizer (15.5% P2O5).
Peanut bean seeds (Giza 6 variety) were sown in 15 May in rows spacing 50cm apart and 15cm between seed hills (56,000 plant/fed) for two seasons. All treatments received 30 kg P2O5
fad-1 as ordinary superphosphate and 24 kg K
2O fad-1 as potassium
sulphate and 45 kg N fad-1 as ammonium sulphate 4T/fed.
Compost as organic matter and P were useful during soil preparation, while potassium fertilizer was applied in two equal doses with nitrogen fertilizer. Peanut plants were harvested at maturity at the end of September in both seasons. Soil samples were collected from the studied plots at two depths (0-30 cm and 30-60 cm) for physical and chemical analysis (Table 1). Soil analyses were made according to Page et al. and Klute [12, 13].
Plant samples were analyzed for N, P and K [14]. At maturity,
Journal of Advanced Pharmacy Education & Research | Jul-Sep 2018 | Vol 8 | Issue 3 61
weighed within the field, and then collected for further analyses. The collected samples were dried in a hot air oven at 70 ºC for three days and ground. The samples were wet digested in H2SO4
- H2O2 mixture for N, P and K analysis. Nutrient efficiency
parameters were evaluated using the following equations [15]:
Recovery efficiency of P (%) =
P uptake in fertilized plot−P uptake in control plot The amount of P fertilizer applied × 100
The data were statistically analyzed and the differences between the means of the treatments were important, as they were more than the least significant differences (L.S.D) at the 5% level by using computer program of Statistix version 9 (Analytical software, 2008).
Table 1: Initial status of some chemical and physical properties of the experimental soil.
Depth 0-30 cm 30-60 cm
Particle size distribution % Sand
Silt Clay
89.12 6.34 4.54
90.73 5.56 3.71
Texture class sandy sandy
pH saturated soil paste 8.20 8.06
EC(ds/m) 1.37 1.21
Soluble ions in saturated soil extract (meq/L)
Na K Ca Mg
Cl HCO3
SO4
5.13 0.54 3.65 4.40 3.30 3.85 6.57
2.84 3.91 4.89 0.48 3.12 3.54 5.47 Available nutrients (mg/kg)
N P K
35 2.66
44
27 1.74
32
Results and Discussion
Characterization of Z, NZ, ZP and NZP
The XRD patterns of Z, NZ, ZP and NZP loaded with phosphate are shown in the Fig.1. The X-ray diffraction of natural Z showed seven crystalline peak with low intensity and these peaks were recorded at 2 θ = 9.4, 9.6, 9.8, 22.1, 22.6, 30.9 and 50.0. The X-ray diffraction of NZ showed 15 crystalline peaks with high intensity and these peaks were recorded at 2 θ =9.0, 10.0, 12.0, 15.0, 17.0, 19.0, 20.0, 22.0, 26.0, 27.0,0, 30.0, 31.0, 33.0 and 65.0. When comparing data of the adsorbents (Z and NZ) which appeared from X-ray analysis, they closely resembled each other with a slight difference [16, 17]. This indicated that the structural
integrity of material is retained after converting it into nano-particles. There were 10 diffraction peaks of ZP recorded at 2θ
= 9.1, 10.0, 12.5, 15.3, 18.1, 22.8, 30.5, 33.0, 45.0 and 60. In other words, X-ray diffraction curve of NZ loaded with P (NZP) showed 16 diffraction peaks recorded at 2θ =9.0, 9.5, 11.0, 12.3, 15.5, 22.2, 24.8, 27.5, 29.6, 30.1, 31.4, 38.6, 44.0, 50.4, 55.6 and 60.4. Obviously, all samples showed high degrees of crystallinity with slight changes. These alters might be
attributed to the presence of phosphate-adsorbed ions on the Z and NZ surface.
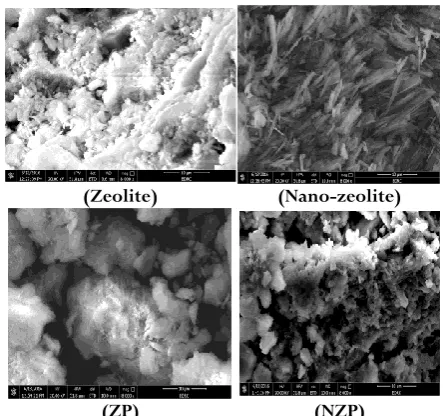
The surface morphology of Z, NZ, and NZ overloaded with phosphate was studied by SEM (Fig. 2). The P loading changed the shapes and geometry of Z from the rounded edges to sharp edges, and changed the morphology of NZ from large rounded edges to small rounded ones besides aggregation of NZ [18, 19]. Fig.
3 shows the FT-IR spectra of Z, NZ, ZP, and NZP in the range of 400–4000 cm−1. The board peak around 3437.4, 3435.6 cm−1
and 1633, 1633 cm−1 can be assigned to the O-H stretching and
bending vibration of adsorbed water, in Z and NZ, respectively, as observed by other researchers [20-22]. As shown in the spectrum
of Z and NZ, the peak at 1065 cm−1 corresponds to the Si-O-Si
stretching vibration. The weak peaks between 800–400 cm−1
correspond to Si-O-Si bending vibration. In contrast to the FT-IR spectra of Z and NZ, the spectra of ZP and NZP obviously changed. The board peak appears around 1000 cm−1 owing to the
phosphate group [23]. The Si-O-Si peaks belong to ZP and NZP
locate at 1072 cm−1, 1070 cm−1, respectively. This may be due
to the interrelationship of adsorption on ZP and NZP, respectively [24].
Figure 1. X-ray diffraction patterns of zeolite, nano-zeolite, ZP and NZP fertilizers
(Zeolite) (Nano-zeolite)
(ZP) (NZP)
Figure 2. Scanning electron microscope image of zeolite, nano-zeolite, ZP and NZP fertilizers
In
tin
si
ty
10 20 30 40 50 60 70
Zeolite ZP Nano-Zeolite
NZP
62 Journal of Advanced Pharmacy Education & Research | Jul-Sep 2018 | Vol 8 | Issue 3
Figure 3. FTIR spectra of zeolite, nano-zeolite, ZP and NZP fertilizers
The TGA measurement carried out to analyze the thermal behavior and decomposition process of Z, NZ, ZP and NZP shown in Fig. 4. The TGA curve of the Z shows four weight losses compartments. The first weight loss at below 200 °C is assigned to the loss of free water and the second weight loss at 250 °C is assigned to the loss of constitution water paralleled with transmutation to crystalline nature; hence the released energy is due to this transmutation [25-27]. This main weight loss
in this temperature range is related to decomposition of metal hydroxide and crystallization of zeolite particles. The third weight loss exists at 600 °C and the final weight loss occurred at 900 °C may be related to the processes of hydrolysis and intensification of silicate molecules [28].
Figure 4. TGA thermograms of zeolite, nano-zeolite, ZP and NZP fertilizers
New thermal events recorded for NZ are shown in Fig. 4. It indicates that the TGA curve shows three weight losses. The first small weight loss at 99.7 °C is assigned to the loss of free water. From 504.99 to 573.6°C, a TGA curve shows two stages of weight loss. From the TGA curves, it is observed that Z (14.01 wt%) had more weight loss compared with NZ (10.04 wt%) Fig. 4 also shows a typical TGA profile of ZP with six weight losses. The first small weight loss at below 100 °C is ascribed to the loss of free water. The second weight loss between 190–250 and 250-406 °C is attributed to the loss of constitution water paralleled with transformation to crystalline nature. Therefore, the released energy is due to this transformation [29]. This main
weight loss in this temperature range was due to decomposition of metal hydroxide and crystallization of zeolite oxide particles. The final weight loss occurred at 406–650 and 650-900 °C with a total weight loss of 17.38%. This weigh loss can be resulted
from the elimination of organic compounds (mainly carboxyl methylcellulose sodium salt), as well as the processes of hydrolysis and condensation of silicate molecules [30]. As it is
shown, five weight loss rates were also observed on the TGA curve of the NZP. The first small weight loss below 100 °C is attributed to the loss of free water and the second weight loss between 173.05–333.2 and 333.2-493.2 °C is attributed to the loss of constitution water paralleled with transformation to crystalline nature, so the released energy is due to this transformation [31, 32]. The resulted weight loss in different
prepared fertilizer was 14.01 wt% in Z, 10.04 wt% in NZ, and 17.38 wt% in ZP, 18.8 wt% in NZP. The variable presence of organic groups in the internal structure of the studied fertilizers (ZP and NZP), the higher amount of the structural water as well as the organic group on the surface of the materials seemed as important factors to promote the adsorption process [33].
Particle size distribution of the adsorbents (Z and NZ) and fertilizer formulations of 1:1 ratio (ZP and NZP) are shown in Fig. 5. The average data on particle size distribution indicated that the particle size of natural Z is 730.8 nm and NZ is 90.2 nm. After adding P to these materials with a ratio of 1:1, the particle size increased to 5057.3 and 583 nm, respectively (Fig. 5). The results are in agreement with Sharmila, who observed that the size of Z increased from 730.8 to 5057.3 nm on high-energy ball milling for further than 6 h [34]. This summited down advance has
subjected to wide surface area for adsorption of different cationic and anionic nutrients on outside alteration of the Z.
Zeolite Nano -Zeolite
Z P NZP
Figure 5. Particle size distributions of zeolite, nano-zeolite, ZP and NZP fertilizers
Column operations
The application of the ion exchanger (Z and NZ) to decrease the concentration of P ions in surface or groundwater trial is one of the important factors, which be supposed to be measured when trying any solid part to worn as an adsorbent. In the present study, a synthetic wastewater sample was used. The results showed removal of 90 and 93% of P3+ after the experiment, in Z
and NZ containing sand, respectively. The results indicated that Z and NZ exchanger is a good adsorbent for the removal of P3+.
This attempt improved the efficient use of P using NZ as an adsorbent. The NZ fortified by P increase adsorption of P in
4000 3500 3000 2500 2000 1500 1000 500
Wavenumbers Cm-1
%
Tr
an
sim
ita
nc
e
Zeolite ZP
Nano-Zeolite NZP
1633
3437 1065
200 0
50
0
400 600 800 1000
100 TGA %
NZP
Nano-zeolite
ZP
Zeolite
Temperature ( C)
%
R
es
id
u
a
l
w
ei
g
h
Journal of Advanced Pharmacy Education & Research | Jul-Sep 2018 | Vol 8 | Issue 3 63
channels and pore seats. The facts strongly suggested that Z with nano-dimensions can help in humanizing the proficient utilize of P, and continued liberate of P that may considerably cut down the employ of P in crops with an additional benefit of hindrance of groundwater pollution [35].
Effect of application of ZP, NZP and super
phosphate on peanut yields
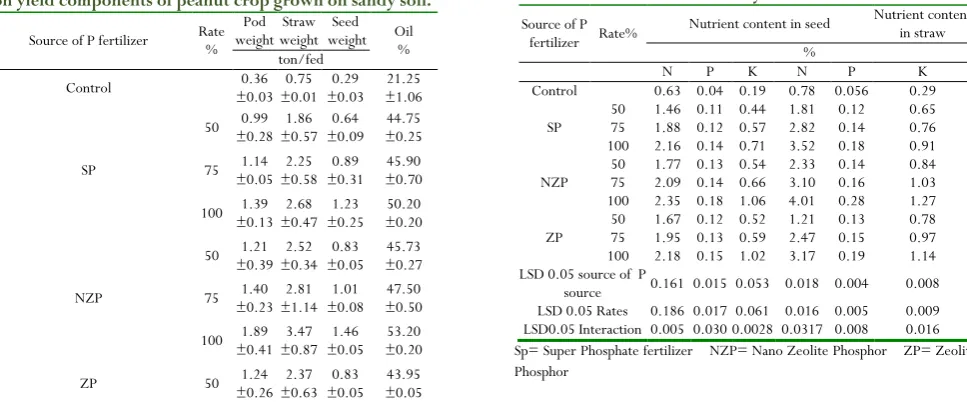
Data in Table (2) showed that the yield components of peanut significantly increased with the increasing rates of fertilizers. Weight of Seeds (T/fad.) and oil percent significantly increased by using NZP compared with SP and ZP, but the weight of Pod and Straw (T/fad) insignificantly increased by using nano-fertilizer treated soil compared with the conventional nano-fertilizer and zeolite phosphorus. The NZP treatment at rate of 100% gave the highest significant value by oil (53.20 %,) followed by 100% SP, but the highest mean of dry weight of Pod, Straw and Seed T/fad. (1.89, 3.48 and 1.46 T/fad., respectively) was achieved with 100 % NZP followed by 100% ZP. The results also showed that application of ZP or NZP in a rate of 75% gave yield parameter significantly higher than those obtained by the application of SP in a rate of 100%. The same trend was noticed in the second season. Adhikari et al., reported that the 1,000 grain weight, grain and Stover yield, etc. were considerably superior in the maize plants charmed with Udaipur nano RP (34% P2O5) in contrast to the orgin [36], which was individual at
par with lone super phosphate (SSP) treated plant life. The fresh and dry weight of grain was superior in nano-fertilizer treated soil in contrast to the soil without fertilizer. The fresh and dry weight on nano-fertilizer treated soil was similar to that of conventional fertilizer. Therefore, using these materials as a source of P gives a potential to reduce the application rate and consequently improve the overall efficiency. The increasing P use efficiency was due to better interception, absorption, and utilization of P in the form of NZP, as P slowly released for the entire growth period, leading to higher photosynthetic rate and finally more accumulation of biomass yield. These findings were supported by other researchers [36, 37].
Table 2. Effect of application of nano-zeolite phosphorus (NZP), zeolite phosphorus (ZP) and super phosphate (SP) on yield components of peanut crop grown on sandy soil.
Source of P fertilizer Rate %
Pod
weight weight Straw weight Seed Oil % ton/fed
Control ±0.03 0.36 ±0.01 0.75 ±0.03 0.29 ±1.06 21.25
SP
50 ±0.28 0.99 ±0.57 1.86 ±0.09 0.64 ±0.25 44.75
75 ±0.05 1.14 ±0.58 2.25 ±0.31 0.89 ±0.70 45.90
100 ±0.13 1.39 ±0.47 2.68 ±0.25 1.23 ±0.20 50.20
NZP
50 ±0.39 1.21 ±0.34 2.52 ±0.05 0.83 ±0.27 45.73
75 ±0.23 1.40 ±1.14 2.81 ±0.08 1.01 ±0.50 47.50
100 ±0.41 1.89 ±0.87 3.47 ±0.05 1.46 ±0.20 53.20
ZP 50 ±0.26 1.24 ±0.63 2.37 ±0.05 0.83 ±0.05 43.95
75 ±0.28 1.46 ±0.81 2.78 ±0.08 1.01 ±0.40 45.40
100 ±0.40 1.61 ±1.08 3.34 ±0.09 1.34 ±0.10 48.90
LSD 0.05 source of P source 0.224 0.578 0.107 0.499
LSD 0.05 Rates 0.259 0.668 0.124 0.576
LSD0.05 Interaction 0.449 1.157 0.215 0.998
Sp= Super Phosphate fertilizer NZP= Nano Zeolite Phosphor ZP= Zeolite Phosphor
Effect of application of ZP, NZP and SP on
nutrient content in seeds and straw of peanut
Table (3) revealed that the N, P and K content (%) in straw and seeds of peanut were significantly affected by the treatments. The highest significant increase in nutrient content was by using NZP compared with SP and ZP. The NZP treatment at rate of 100% gave the highest significant value of 2.4, 4.0, 0.2, 0.3, 1.1 and 1.3% for N, P and K content in straw and seeds, respectively. These values were followed by ZP, and then SP treatments. The nutrient contents in seeds and straw in second season showed similar trends as the first season. This might be due to the nano form of Z particles that increased dissolution rate. Moreover, the finer size of NZ enhanced the degree of contact between Z and soil, which caused greater rate of dissolution. Therefore, the solubility of N, P and K would be greater, with slow release of nutrients providing a steady and constant supply of nutrients to the plant for longer period, thus increasing the utilization of the nutrients by plants. These results came in accordance with the previous work that revealed the nano-fertilizer treatments caused an increase in the concentration of phosphorus and potassium in maize plant [36]. The concentration of P and K was
more or less in case of control and conventional treatment. Adhikari et al. revealed that there was an increase in the content and uptake of N and K with the application of different nano-rock phosphate sources [36]. Total contents of N and K were higher
with all P treatments compared with control (1.83% and 3.37%).
Table 3. Effect of application of nano-zeolite phosphorus
(NZP), zeolite phosphorus (ZP) and super phosphate on nutrient content in straw and seeds of peanut crop grown
on sandy soil.
Source of P
fertilizer Rate%
Nutrient content in seed Nutrient content in straw
%
N P K N P K
Control 0.63 0.04 0.19 0.78 0.056 0.29
SP
50 1.46 0.11 0.44 1.81 0.12 0.65
75 1.88 0.12 0.57 2.82 0.14 0.76
100 2.16 0.14 0.71 3.52 0.18 0.91
NZP 50 75 1.77 0.13 0.54 2.09 0.14 0.66 2.33 3.10 0.14 0.16 0.84 1.03
100 2.35 0.18 1.06 4.01 0.28 1.27
ZP
50 1.67 0.12 0.52 1.21 0.13 0.78
75 1.95 0.13 0.59 2.47 0.15 0.97
100 2.18 0.15 1.02 3.17 0.19 1.14
LSD 0.05 source of P
source 0.161 0.015 0.053 0.018 0.004 0.008
LSD 0.05 Rates 0.186 0.017 0.061 0.016 0.005 0.009
LSD0.05 Interaction 0.005 0.030 0.0028 0.0317 0.008 0.016
64 Journal of Advanced Pharmacy Education & Research | Jul-Sep 2018 | Vol 8 | Issue 3
Effect of application of ZP, NZP and SP on
nutrient uptake in peanut straw and seeds.
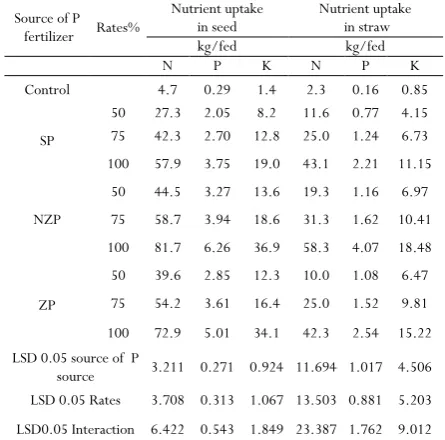
Data in Table (4) showed that NZP treatment gave higher uptake of nutrients by straw and seeds of peanut compared with SP and ZP. The N, P and K uptake increased with increasing application rate for all treatments. The highest significant increase was by using NZP for all nutrients. This treatment gave values of 81.49,6.38 and 36.74 for N, P and K kg/fed uptake by straw, respectively. As for seeds, it gave values of 58.36, 4.07 and 18.41 kg/fed uptake, respectively. The nutrients uptake in seeds and straw in the second season showed similar trends as the first season. These results might be happened due to the fact that nano-particles can be adsorbed on clay lattice, and then slowly released into the soil solution, which prevents the loss of nutrients. The above-mentioned results are in agreement with those obtained by Adhikari where they revealed that the uptake of phosphorus (P) by the maize plants was computed by multiplying the concentration of phosphorus (P) in the plant with their corresponding dry substance production [36]. It is concluded
from the investigation that the uptake of phosphorus by the plants was superior in cooperation of nano-fertilizer.
Table 4. Effect of application of nano-zeolite phosphorus (NZP), zeolite phosphorus (ZP) and Super phosphate (SP) on nutrient uptake by straw and seeds (kg/fed) of
peanut crop grown on a sandy soil.
Source of P
fertilizer Rates%
Nutrient uptake in seed
Nutrient uptake in straw
kg/fed kg/fed
N P K N P K
Control 4.7 0.29 1.4 2.3 0.16 0.85
SP
50 27.3 2.05 8.2 11.6 0.77 4.15
75 42.3 2.70 12.8 25.0 1.24 6.73
100 57.9 3.75 19.0 43.1 2.21 11.15
NZP
50 44.5 3.27 13.6 19.3 1.16 6.97
75 58.7 3.94 18.6 31.3 1.62 10.41
100 81.7 6.26 36.9 58.3 4.07 18.48
ZP
50 39.6 2.85 12.3 10.0 1.08 6.47
75 54.2 3.61 16.4 25.0 1.52 9.81
100 72.9 5.01 34.1 42.3 2.54 15.22
LSD 0.05 source of P
source 3.211 0.271 0.924 11.694 1.017 4.506
LSD 0.05 Rates 3.708 0.313 1.067 13.503 0.881 5.203
LSD0.05 Interaction 6.422 0.543 1.849 23.387 1.762 9.012 Sp= Super Phosphate fertilizer NZP= Nano Zeolite Phosphor ZP= Zeolite Phosphor
Effect of application of ZP, NZP and SP on
the apparent P recovery efficiency (%) of
peanut
Data presented in Table (5) showed that the apparent recovery efficiency of P at a rate of 100% was 18.40, 32.90 and 23.70% for SP, NZP and ZP, respectively. The data also showed that when only a rate of 50% of the recommended rate from nano source was used, the recovery efficiency was higher than applying 100% of the ordinary source in both the first and the second seasons. This indicates that NZP can be used as a potential and economic alternative source to other sources. Therefore, using
NZP would help in reducing the quantity of the applied fertilizers and consequently the farmers’ profitability.
Table 5: Effect of application of nano-zeolite phosphorus (NZP), zeolite phosphorus (ZP) and super phosphate (SP) on the apparent P recovery efficiency (%) of peanut crop
grown on a sandy soil.
Treat. Rate% kg/fed P rate P uptake kg/fed
Apparent P recovery efficiency
%
Control 0 0.45
SP
50 15 2.82 15.80
75 22.5 3.94 15.90
100 30 5.96 18.40
NZP
50 15 4.43 26.50
75 22.5 5.55 22.70
100 30 10.33 32.90
ZP
50 15 3.93 23.10
75 22.5 5.13 20.80
100 30 7.55 23.70
Sp= Super Phosphate fertilizer NZP= Nano Zeolite Phosphor ZP= Zeolite
Effect of application of ZP, NZP and SP
onnutrient availability in soil
Table (6) shows the availability of N, P and K in soil after completing the experiment. The application of studied materials increased the available nutrients in soil. When compared with other materials, NZP treatment increased the nutrient availability in soil. The application of NZP at a rate of 100% of the recommendation gave significant available nutrients in soil compared with SP at layer of 0-30 cm by 25.3, 34.2 and 23.7% for available N, P and K, respectively. The nutrients in soil layer 30-60 cm showed a similar trend, however, this layer contained less amount of the available nutrients compared with top surface layer (0-30 cm). The inference of this finding is that the P provided from nano-source leftovers are accessible for a longer time contrast to conventional fertilizer. The previous results seemed to be supported by those obtained by other researchers
[38, 39], who revealed that nano-fertilizer use in soil improved
obtainable P and K under nano-fertilizer treatment compared with the usual fertilizer. On the other hand, Table 7 presents a comparison of weight of seeds and apparent P recovery percent with those of previous reports. This table describes the literature review on nano-fertilizer formulations available in the new past. Based on these literatures, nano-fertilizer technology has positive effect on weight of seeds, and apparent P recovery percent is adjusted or regulated in accordance with the crop demand.
Table 6. Effect of application of nano-zeolite phosphorus (NZP), zeolite phosphorus (ZP) and super phosphate (SP)
on nutrient availability in soil.
Treat. Rate% Depth Available nutrients in soil
mg/kg
cm N P K
Control 0-30 35.0 2.66 44.0
30-60 27.0 1.74 32.0
SP 50
0-30 46.7 3.55 59.3
30-60 31.6 2.17 35.5
Journal of Advanced Pharmacy Education & Research | Jul-Sep 2018 | Vol 8 | Issue 3 65
30-60 37.8 2.43 40.0
100 0-30 65.1 5.40 74.5
30-60 41.4 2.73 48.9
NZP
50 0-30 75.7 6.65 83.8
30-60 47.7 3.07 48.9
75 0-30 81.9 7.43 89.9
30-60 50.6 3.26 53.4
100 0-30 87.2 8.21 97.6
30-60 53.5 3.45 59.5
ZP
50 0-30 62.4 5.94 70.4
30-60 41.5 2.83 45.3
75 0-30 76.9 6.79 77.4
30-60 46.6 3.12 47.9
100 0-30 80.9 7.46 85.9
30-60 48.3 3.27 53.3
LSD 0.05 source 0.545 0.059 0.149
LSD 0.05 Rates 0.629 0.068 0.173
LSD 0.05 Depths 0.445 0.048 0.122
LSD 0.05 source x R 1.091 0.116 0.299
LSD 0.05 source x D 0.771 0.083 0.212
LSD 0.05 D x R 0.891 0.096 0.245
LSD0.05 Interaction 3 factors 1.542 0.166 0.424
Sp= Super Phosphate fertilizer NZP= Nano Zeolite Phosphor ZP= Zeolite Phosphor
Table 7. Comparison of weight of seeds median values (Kg/ha.) and apparent
Sour
ce of
P f
ert
ilizer
Appr
oa
ch
Si
ze
(n
m)
Growin
g
pla
nt
Prod
ucti
vi
ty
Wei
ght of
seed
(K
g/
ha)
Appa
rent
P
recover
y (
%)
Ref
erence
Nano hydroxyl appetite
(nHA) Ca5(PO4)3OH) - 16.00 Soybean 786.60 - [40]
Bohrnano-fertilizer - - Peanut 1673.40 - [41]
Nano rock phosphate (RP) physical 86.00 Maize 5440.00 47.98 [36] Nano hydroxyl appetite
(Ca(H2PO4)2) physical ~16.00 Soybean 786.60 - [42]
Nano zeolite physical 90.20 Peanut 8361.90 32.90 work This
P recovery % in the present work and the obtained data from other relevant literature
Conclusions
Application of NZP plays a significant role in enhancing crop productivity and minimizing pollution hazard through improving the use efficiency. Yield components, nutrient contents and uptake by peanut were increased using NZP, compared to the other materials. The apparent recovery efficiency of P increased significantly by using the nano source. Using only a rate of 50 or 75% of the recommended rate from nano source gave higher recovery efficiency of P compared with applying 100% of the ordinary source, with almost similar or superior yield. This study came to a conclusion that using nano sources of fertilizers can reduce the amount of wasted chemicals and consequently minimizes the pollution hazard.
References
1. Chinnamuthu C.R., Boopathi P.M., (2009) Nanotechnology and Agroecosystem. Madras. Agric. J 96:17-31.
2. Adhikari T., Samaresh K., Vasudeb M and Anangi S.R., (2014) Utilization of Nano Rock Phosphate by Maize (Zea mays L.) Crop in a Vertisol of Central India. 3. DeRosa M.C., Monreal C., Schnitzer M., Walsh R., and
Sultan Y., (2010) Nanotechnology in fertilizers. Nat Nanotechnol 5:91
4. Lal, R., (2008) Promise and limitations of soils to minimize climate change. J. Soil Water Conserv. 63, 113A–118A.
5. Nair, R., Varghese, S.H., Nair, B.G., Maekawa, T., Yoshida, Y., Kumar, D.S., (2010) Nanoparticulate material delivery to plants. Plant Sci. 179, 154–163. 6. Ghormade, V., Deshpande, M.V., Paknikar, K.M.,
(2011) Perspectives for nano-biotechnology enabled protection and nutrition of plants. Biotechnol. Adv. 29, 792–803.
7. Khot, L.R., Sankaran, S., Maja, J.M., Ehsani, R., Schuster, E.W., (2012) Applications of nanomaterials in agricultural production and crop protection: a review. Crop. Prot. 35, 64–70.
8. Pond, W. G., and Mumpton, F.A.N., (1984) Zeo-agriculture: Use natural zeolites in agriculture and aquaculture. International Committee on Natural Zeolite, Westview, Press, Boulder, CO.
9. Leggo, P.J., (2000) An investigation of plant growth in an organo–zeolitic substrate and its ecological significance. Plant Soil, 219:135–146
10. Chang H. J., (1997) Method of preparing a slow release fertilizer. US Patent 5695542, Dec 9, 1997.
11. Muthuvel, P. and Udayasoorian C., (1999) Soil, Plant, Water and Agrochemical analysis (Tamil Nadu Agricultural University, Coimbatore),156-170. 12. Page, A.L., Miller R.H. and Keeney D.R., (1984)
Methods of soil analysis. Part 2: Chemical and Microbiological Properties. Second edition. Agronomy J. 9: 2, Am. Soc. Agron. Inc., Soil Sci. Soc. Am. Inc. Pub. Madison, Wisconsin, USA.
13. Klute, A.A., (1986) Methods of Soil Analysis. Part 1 2nd ed. American Society of Agronomy.Inc. Publishes, Madison, Wisconsin, USA.Mahattanatawee, K.; J.A. Manthey, G. Luzio; S.T. Talcott; K. Goodner and E.A. 14. Cottenie, A., Verlso M.; Kilkens L., Velghe G. and
Camerlynck R., (1982) Chemical Analysis of Plants and Soils. Lab. Agroch. State Univ. Gent, Belgium
15. Yadvinder, S.; Bijay, S.; Ladha, J.K.; Khind, C.S.; Khera, T.S. and Bueno, C.S., (2004). Effects of residue decomposition on productivity and soil fertility in rice-wheat rotation. Soil Sci. Soc. Am. J., 68 (3): 854. 16. E.A. Abdelrahman, Synthesis of zeolite nanostructures
66 Journal of Advanced Pharmacy Education & Research | Jul-Sep 2018 | Vol 8 | Issue 3
malachite green dye from aqueous media, J. Mol. Liq. 253 (2018) 72–82.
17. M.Y. Nassar, E.A. Abdelrahman, Hydrothermal tuning of the morphology and crystallite size of zeolite nanostructures for simultaneous adsorption and photocatalytic degradation of methylene blue dye, J. Mol. Liq. 242 (2017) 364-374.
18. M.Y. Nassar, E.A. Abdelrahman, A.A. Aly, T.Y. Mohamed, A facile synthesis of mordenite zeolite nanostructures for efficient bleaching of crude soybean oil and removal of methylene blue dye from aqueous media, J. Mol. Liq. 248 (2017) 302–313.
19. M.Y. Nassar, H.M. Aly, E.A. Abdelrahman, M.E. Moustafa, Synthesis, characterization, and biological activity of some novel Schiff bases and their Co(II) and Ni(II) complexes: A new route for Co3O4 and NiO nanoparticles for photocatalytic degradation of methylene blue dye, J. Mol. Struct. 1143 (2017) 462– 471
20. H.M. Aly, M.E. Moustafa, M.Y. Nassar, E.A. Abdelrahman, Synthesis and characterization of novel Cu (II) complexes with 3-substituted-4-amino-5-mercapto-1,2,4-triazole Schiff bases: A new route to CuO nanoparticles, J. Mol. Struct. 1086 (2015) 223-231. 21. M.Y. Nassar, H.M. Aly, M.E. Moustafa, E.A.
Abdelrahman, Synthesis, Characterization and Biological Activity of New 3-substitued-4-amino-5-hydrazino-1,2,4-triazole Schiff Bases and Their Cu(II) Complexes: A New Approach to CuO Nanoparticles for Photocatalytic Degradation of Methylene Blue Dye, Journal of Inorganic and Organometallic Polymers and Materials, (2017) 1-14.
22. H.M. Aly, M.E. Moustafa, E.A. Abdelrahman, Synthesis of mordenite zeolite in absence of organic template, Advanced Powder Technology, 23 (2012) 757-760.
23. Ali, I.M., Kotp, Y.H. and El-Naggar, I.M. Thermal stability, structural modifications and ion exchange properties of magnesium silicate, Desalination 259, 228– 234(2010).
24. Kotp, Y.H. (2017) Controlled synthesis and sorption properties of magnesium silicate nanoflower prepared by a surfactant-mediated method. Separation Science and Technology, 52 (4): 657–670.
25. Abdel-Hameed M. El-Aassar, Moustafa M. S. Abo ElFadl, Mohamed E. A. Ali, Yousra H. Kotp and Hosam A. Shawky (2017). Effect of manufacture conditions on reverse osmosis desalination performance of polyamide thin film composite membrane and their spiral wound element, Desalination and Water Treatment, 69,65-71. 26. Kotp, Y. H., Ali, M. E.A., Mohallal S. A. and Aboelfadl M.M. S. Synthesis of a novel inorganic cation exchanger based on molybdate: Applications for removal of Pb2+, Fe3+ and Mn2+ ions from polluted water, Separation
Science and Technology, DOI:
10.1080/01496395.2018.1465079 (2018).
27. Kotp, Y. H., Shebl, Y. A., El-Deab, M. S., El-Anadouli, B. E. and Shawky H. A. Performance Enhancement of PA-TFC RO Membrane by Using Magnesium Silicate Nanoparticles, J Inorg Organomet Polym 27(Suppl 1): 201(2017).
28. I. M. Ali, M.Y. Nassar, Yousra H. Kotp and M. Khalil (2017). Cylindrical-Design, Dehydration and Sorption Properties of Easily Synthesized Magnesium Phospho-silicate Nanopowder, Particulate science, and technology, DOI: 10.1080/02726351.2017.1362607. 29. Said, M. M, El-Aassar, A. M., Kotp, Y.H, Shawky H. A.
and Abdel Mottaleb, M. S. A. (2013) Performance assessment of prepared polyamide thin film composite membrane for desalination of saline groundwater at Mersa Alam-Ras Banas, Red Sea Coast, Egypt, Desalination and Water Treatment, 51:25-27, 4927-4937, DOI: 10.1080/19443994.2013.795208. 30. Fernandes, M. T. C., Garcia, R. B. R., Leite, C.A.P.
and Kawachi, E.Y., (2013) The competing effect of ammonia in the synthesis of iron oxide/silica nanoparticles in microemulsion/sol–gel system, Colloids and Surfaces A: Physicochem. Eng. Aspects 422, 136– 142.
31. Palau, A., Garcia, J., Barcelo, A., Blas, M. and Martinez, J., (1997) Structural modification of sepiolite (natural magnesium silicate) by thermal treatment: effect on the properties of polyurethane adhesives, Int. J. Adhes. Adhes.111–119.
32. Hernandez, L.M.; Torres, M. and Lopez T., (2000) Preparation of ternary compound Ba3Li2Ti8O20 by the sol–gel process, Mater. Lett. 45, 340–344.
33. Ali, I., (2003) Synthesis and sorption behavior of semicrystalline sodium titanate as a new cation exchanger, J. Radioanal.Nucl. Chem. 260, 149–157. 34. Sharmila R. C., (2010) Nutrient release pattern of
nano-fertilizer formulations. Ph D Thesis, Tamil Nadu Agricultural University, Coimbatore, Tamil Nadu, India. 35. Manikandan, A., and Subramanian, K. S. (2014) Fabrication and characterisation of nanoporous zeolite based N fertilizer, African Journal of Agricultural Research 9(2): 276-284.
36. Adhikari, T, (2011) Nano-particle research in soil science: Micronutrients, in: National Symposium on Applications of Clay Science: Agriculture, Environment and Industry, NBSS& LUP, Nagpur, pp. 74-75. 37. Alloush, G.A. and Clark R.B., (2001) Maize response to
phosphate rock and arbuscularmycorrhizal fungi in acidic soil, Communication in Soil Science and Plant Analysis 32: (231-254.
38. Li, J., Wee, C. and Sohn, B., (2013) Effect of Ammonium- and Potassium-Loaded Zeolite on Kale (Brassica alboglabra) Growth and Soil Property. American Journal of Plant Sciences,4, 1976.https://doi.org/10.4236/ajps.2013.410245. 39. Anjuman, A. R., Shurovi Z., Shah M. I.H., Preparation,
Journal of Advanced Pharmacy Education & Research | Jul-Sep 2018 | Vol 8 | Issue 3 67
Phosphorus and Potassium Incorporated Nano Fertilizer, Advances in Nanoparticles, 2017, 6, 62-74
40. Singh M.D., Chirag G., Om Prakash P., Mohan M.H., Prakasha G. and Vishwajith (2017). Nano fertilizers is a new way to increase nutrients use efficiency in crop production. international journal of agriculture sciences
41. Nazanin M., Seyyed M. S. and Sirous B. (2013). Effect of bohrnanofertilizer and chelated iron on the yield of peanut in province guilan, iranInternational Journal 3 (4): 45-62