Crossmodal Network-Based Distributional Semantic Models
Elias Iosif and Alexandros Potamianos
School of Electrical & Computer Engineering, National Technical University of Athens, Greece “Athena” Research and Innovation Center, Greece
[email protected], [email protected]
Abstract
Despite the recent success of distributional semantic models (DSMs) in various semantic tasks they remain disconnected with real-world perceptual cues since they typically rely on linguistic features. Text data constitute the dominant source of features for the majority of such models, although there is evidence from cognitive science that cues from other modalities contribute to the acquisition and representation of semantic knowledge. In this work, we propose the crossmodal extension of a two-tier text-based model, where semantic representations are encoded in the first layer, while the second layer is used for computing similarity between words. We exploit text- and image-derived features for performing computations at each layer, as well as various approaches for their crossmodal fusion. It is shown that the crossmodal model performs better (from 0.68 to 0.71 correlation coefficient) than the unimodal one for the task of similarity computation between words.
Keywords: activation based models, crossmodal fusion, distributional semantic models, semantic similarity, bag-of-visual-words
1.
Introduction
Distributional semantic models (DSMs) (Baroni and Lenci, 2010) constitute a widely-used paradigm for ex-tracting, representing and learning semantics from lin-guistic data. DSMs are based on the distributional hy-pothesis of meaning (Harris, 1954) assuming that seman-tic similarity between words is a function of the overlap of their linguistic contexts. Despite their success in vari-ous semantic tasks (e.g., semantic classification and com-putation of semantic similarity) these models have been criticized as “disembodied”, since they rely solely on lin-guistic information without being grounded in perception and action including other modalities, e.g., color (Barsa-lou et al., 2008). This disconnection is also referred to as the symbol grounding problem (Harnad, 1990). Ground-ing refers to the mappGround-ing of the semantics of natural lan-guage to the physical world. This is supported by exper-imental findings indicating that real-world experiences also play a role for the acquisition of lexical semantics (Landau et al., 1998). For example, the naming of ob-jects from pictures was found to be faster for color im-ages vs grayscale (Therriault et al., 2009). Recently, fo-cus has been given to the incorporation of features from modalities other than text in order to augment the text-based DSMs, e.g., see (Bruni et al., 2014) for image-derived features, and for audio-based features (Kiela and Clark, 2015). For additional insight into computation models that map data-derived low-level features to high-level knowledge (including cognitive and social aspects) see (Potamianos, 2014).
The proposed approach is an alternative framework for integrating textual and visual features for the task of se-mantic similarity computation between words. This is motivated by the cognitive evidence indicating the
multi-modal character of semantic representations utilized for various semantic tasks. This work, extends the unimodal (lexical-only) approach of network-based DSMs that has been successfully applied for the task of word similarity achieving state-of-the-art results (Iosif and Potamianos, 2015). The key idea behind network DSMs is a two-tier system, motivated by cognitive considerations such as network activation and priming. The first layer, en-codes the semantics of words via the creation of lexi-cal neighborhoods. In the second layer, similarity met-rics are defined that operate on these semantic neighbor-hoods. In this paper, we investigate the integration of vi-sual and lexical features for network-based DSMs. The integration is achieved by alternating visual and lexical information in the two layers.
2.
Related Work
was achieved demonstrating how the corpus used to esti-mate DSM features can significantly affect performance. A common technique for the late fusion of textual and vi-sual models is the combination of similarity scores esti-mated via the unimodal models. For example, in (Leong and Mihalcea, 2011) the sum and the harmonic mean of similarities were used achieving 0.59 correlation for a small subset of WS353. In (Bruni et al., 2014), both early and late fusion schemes were applied. The early fusion was implemented as a linear weighted combina-tion of the features vectors, while a similar combinacombina-tion was adopted for the late fusion based on the unimodal similarity scores. Both schemes were found to obtain high correlation (up to 0.78) for a subset of WS353, how-ever, there is no clear winner since their relative per-formance vary with respect to the experimental param-eters, e.g., the size of the context window used for ex-tracting the textual features. Overall, cross-modal DSMs appear to exceed the performance of their respective uni-modal baselines for the computation of word-level se-mantic similarity.
In addition to the area of lexical semantics textual and vi-sual features have been also exploited for tasks related to the indexing and retrieval of multimedia documents, es-pecially images. The most common approach is the de-velopment of retrieval models for each modality, which are fused in a late phase for combining and re-ranking the modality-specific results, e.g., (Besancon and Mil-let, 2005). Another example of late fusion was pre-sented in (Vreeswijk et al., 2011) dealing with the classi-fication of images into semantically abstract categories. Early fusion of features was proposed in (Escalante et al., 2008) for enhancing the search over collections of images. LDA is popular when investigating the relation between images and text annotations. Examples include the use of probabilistic LDA for the multimodal index-ing of images (Monay and Gatica-Perez, 2007) and the generation of (text) captions for images (Barnard et al., 2003). In addition, matrix factorization has been investi-gated, e.g., singular value decomposition (SVD) (Hare et al., 2008) and non-negative matrix factorization (NMF) (Caicedo et al., 2012). The recent advances on deep neural networks enabled the application of several archi-tectures and configurations for linking textual and visual data. Examples included the mapping between the rep-resentation space of images and the space of word em-beddings for the task of image classification (Socher et al., 2013). The scalability of this approach was enhanced in (Frome et al., 2013) for the ImageNet challenge on object recognition covering 1000 classes. The idea of linking visual features with word embeddings was also followed in (Karpathy and Li, 2014) for the generation of image descriptions.
3.
Features and Similarity Metrics
Textual: Co-occurrence-based (CC). The assumption here is that the co-existence of words within a speci-fied context serves as indicator for their semantic re-latedness. In this work, we employ a common met-ric, namely, Google-based semantic relatedness,G, pro-posed in (Gracia et al., 2006), considering word co-occurrence at the sentential level.
Textual: Context-based (CT). The fundamental as-sumption here is that similarity of context implies
simi-larity of meaning (Harris, 1954). Given a target wordwi,
a contextual window of size2H+1words is centered on it and lexical features are extracted. The H words left and right ofwi are extracted for every instance ofwiin
the corpus formulating a feature vector. For a given value ofH the context-based semantic similarity between two words, wi and wj, is computed as the cosine of their
feature vectors. This approach is also referred to as the “Bag-of-Words” (BoW) model.
The Visual Analogue of Bag–of–Words Model (VS). The notion of “Bag-of–Visual–Words” (BoVW) model was inspired by the BoW model in an attempt to repre-sent images with respect to a common “visual lexicon” (Sivic and Zisserman, 2003; Csurka et al., 2004; Bruni et al., 2011). Given an image collection the following steps are followed for the construction of the BoVW model (Bruni et al., 2011): 1) Salient local regions, e.g.,10×10
pixels, are identified and represented as vectors. 2) The identified regions are projected into a space that is shared between the images of the collection. Next, the projec-tions are clustered. Each cluster is assumed to corre-spond to a visual word. 3) Every image is represented as a vector of visual words. The most widely-used similar-ity metric for this representation is the cosine similarsimilar-ity.
4.
Network-based DSMs
In this section, we briefly present the two-tier DSMs that were proposed in (Iosif and Potamianos, 2015) for build-ing semantic networks usbuild-ing features extracted from text corpora. Here, this model is extended by exploiting both textual and visual features aiming to alleviate the symbol grounding problem of DSMs. The network consists of two layers, namely, activation and similarity layer. Given a target word,wi, a set of other words that are
semanti-cally similar withwiare identified in the first layer
for-mulating the activation area (also referred to as the se-mantic neighborhood) ofwi. The second layer computes
4.1.
Layer 1: Activation Model
The activation layer constitutes a network that can be de-fined as an undirected (under a symmetric similarity met-ric) graphF = (A, E), whereAare the entries of a lex-iconL, whileE contains the links between the vertices. The links (edges) between words in the network are de-termined and weighted according to the pairwise seman-tic similarity of the verseman-tices. The semanseman-tic neighborhood of a targetwi ∈ Lis a sub-graph ofF,Fi = (Ai, Ei),
where the set of verticesAiincludes in totalnmembers
ofL, which are linked with wi via edges Ei. This is
motivated by theories of semantic priming (McNamara, 2005) according to which stimulus facilitates the cogni-tive processing of related entities present in the human semantic memory. The theory of priming applies to any perceptual entities regardless of modality. Thus, the use of lexical and visual features as priming cues is cogni-tively valid (Stenberg et al., 1995). For example, in (Iosif et al., 2012) lexical features and corpus statistics were used for the classification of lexical relations with respect to two broad types of priming.
4.2.
Layer 2: Similarity Model
In this section, we present two metrics of semantic sim-ilarity proposed in (Iosif and Potamianos, 2015) that are defined with respect to the activation areas computed in the first network layer.
Maximum Similarity of Neighborhoods. This under-lying hypothesis that the similarity of two words,wiand
wj, can be computed as the maximum similarity of their
respective activation areas:
whereαij denotes the maximum similarity betweenwi
and the neighbors ofwj estimated according to a
simi-larity metricS. In this work,S was computed using the feature types (CC or CT or VS) and metrics presented in Section 3.αjiis computed in similar fashion.NiandNj
stand for the set of neighbors ofwiandwj, respectively.
This metric was motivated by the maximum sense sim-ilarity assumption (Resnik, 1995) under the assumption that the neighbors serve as semantic features represent-ing the sense(s) of the correspondrepresent-ing word.
Attributional Neighborhood Similarity. Unlike Mn
where a single neighbor from each activation area is used, in this metric the entire areas are taken into account in the computation of the similarity score:
Rn(wi, wj) = max{βij, βji}, (2)
defined similarly as CNi
i . The ρfunction denotes the
Pearson’s correlation coefficient.NiandNjare the sets
of neighbors ofwi andwj, respectively. S stands for a
similarity metric – in this work it was computed using the feature types (CC or CT or VS) and metrics presented in Section 3. The motivation behindRn was attributional
similarity based on the hypothesis that the neighbors that live in the activated areas encode semantic attributes (or features) of the respective target words.
5.
Fusion of Multimodal Representations
In this section, we present two schemes, namely, local and global, for the fusion of textual and visual represen-tations at the first layer of the network. Each scheme is meant to formulate an activation area for a target wordwi
either by local set operations on unimodal activation ar-eas (from text and image-derived data) or by global alge-braic operations on normalized unimodal semantic sim-ilarity scores. Specifically, the local fusion scheme se-lects for each targetwitwo unimodal neighborhoods of
a small fixed size (e.g., 100 neighbors) and then performs set operations (e.g., union, intersection) on these neigh-borhoods to obtain a crossmodal activation area. The global scheme combines the semantic similarity scores computed between the targetwi and everywj∈Lwith
respect to the two modalities and then selects the neigh-borhood of targetwi.
Local fusion. Let the semantic neighborhoods of a tar-get wordwi computed based on textual and visual
fea-tures be represented as ordered sets (according to simi-larity) denoted asTi andVi, respectively. The bimodal
neighborhood of wi can be computed via: 1) union
F∪
i =Ti∪Vi , and 2) intersectionFi∩ =Ti∩Vi.
As-sume a bimodal neighborhood of fixed sizen. For the case of union, half the neighbors are selected fromTi
and the rest from Vi, i.e., |Ti |=| Vi |= n2.
Regard-ing intersection, the cardinality ofTiandVi is not fixed
since the goal is to have n neighbors within F∩ i . For
this purpose, we allow the gradual increment of|Ti|and
|Vi|until the satisfaction of this criterion. This relaxation
was adopted in (Georgiladakis et al., 2015) where it was applied for the computation of neighborhoods for short phrases based on the neighborhoods of the constituent words. The intersection-based fusion adheres to findings from the literature of psycholinguistics suggesting that the crossmodal neighborhoods should be more specific than the respective unimodal ones (Osherson and Smith, 1981).
Global fusion. Given a target wordwi, letTiandVibe
text and visual features, respectively. The fusion was im-plemented via the algebraic operations defined in Table 1 using the normalized1T
iandVivectors. According to
Fusion scheme Definition
Table 1: Definition of global fusion schemes.
theFadd
i scheme, both modalities contribute equally to
the combination of similarities. This is relaxed by the Fwadd
i scheme where the contribution of each
modal-ity is weighted. The 0≤λi ≤1 weight is defined as:
i andZiV are the coefficients of
variation forTi andVi, respectively. ZiT is defined as
the ratio of the standard deviation and the mean ofTi’s
similarity scores (Everitt, 1998).ZV
i is defined in similar
fashion. The weights assigned toTiandVi are
propor-tional to the respective variation coefficients.
6.
Experiments and Evaluation Results
Textual features (CC, CT). A lexicon consisting of8752 (single-word) English nouns was extracted from the SemCor32 corpus. For the extraction of the textual features (i.e., CC and CT) a web harvested corpus was created as follows. For each lexicon entry an individ-ual query was formulated and the1,000top ranked re-sults (document snippets) were retrieved using the Ya-hoo! search engine and aggregated.
Visual features (VS). We used a feature set that was computed as part of the work described in (Bruni et al., 2011). Here, we outline the basic steps of feature ex-traction, while more details can be found in (Bruni et al., 2011). The ESP-Game dateset was used (von Ahn and Dabbish, 2004) that contains images annotated with textual descriptions (set of tags/words). For the extrac-tion of visual features, the VLFeat system was used (Vedaldi and Fulkerson, 2013) through a process sum-marized as follows: The Difference of Gaussian (DoG) (Lowe, 2004), was employed for identifying local re-gions, which they were assigned to visual words. The Scale-Invariant Feature Transform (SIFT) (Lowe, 1999) was applied for deriving a a 128-dimensional represen-tation for each region. Thek-means algorithm was ap-plied for clustering the regions into a number of clusters serving as visual words. This way each image was repre-sented by a vector of visual words according on the clus-tering of its regions. Last, each word was represented
1
In this work, we usedZ-normalization.
2
http://www.cse.unt.edu/˜rada/ downloads.html
by a vector created by summing the vectors of the corre-sponding images (i.e, images having this word in the cor-responding annotation tags). For the creation of a mul-timodal network, we used the intersection between the
8752nouns and the nouns covered by the image annota-tions resulting into a set of3450nouns.
Network. The network creation consisted of two main steps: 1) computation of semantic neighborhoods, and 2) computation of similarity scores. For each step three types of similarity metrics (in conjunction with the re-spective features) were applied: co-occurrence-based (CC), context-based (CT), and visual (VS).
Evaluation. For evaluation purposes, we used the noun pairs of (i) Rubenstein-Goodenough (RG) (Rubenstein and Goodenough, 1965) and (ii) WordSim353 (WS353) (Finkelstein et al., 2002) datasets which were included in the network of3450nouns: 35 and 175 pairs3 , re-spectively. The Pearson’s correlation coefficient against human ratings was as evaluation metrics. For the case of CC the Google-based Semantic Relatedness was applied, while the cosine similarity was used for CT (with context windowH=1) and VS.
The performance of Mn and Rn neighborhood-based
metrics (defined in Section 4) for various number of neighbors with respect to the subsets of RG and WS353 datasets along with the respective baselines is presented in Table 6. We consider as baseline the computation of semantic similarity in the absence of network, i.e., by directly applying the bag-of-word metrics described in Section 3. The performance is shown for various combi-nations of textual (CC or CT) and visual (VS) features used for neighbor selection and similarity computation. The focus is to investigate the performance potential of the crossmodal network, that is, when the visual features are used either for neighbor selection or computation of the final similarity score. Regarding theMnmetric, the
highest performance (0.79and0.70for RG and WS353, respectively) is achieved by the CC/VS combination, which outperforms the baseline for the case of WS353. Regarding theRnmetric, the highest performance (0.89
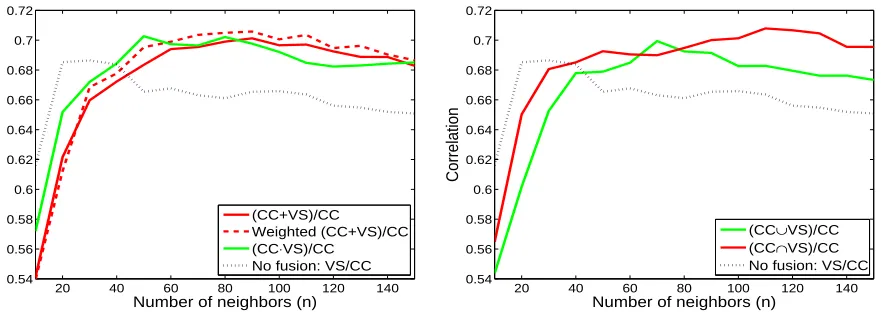
and0.67for RG and WS353, respectively) is achieved by the VS/CC combination, exceeding the baseline per-formance for all datasets. In addition, it seems that small neighborhood sizes yield better results when visual fea-tures are used for neighbor selection. The overall lowest performance is obtained by the VS/VS combination, In Figure 1(a), we present the performance yielded by the global fusion schemes as a function of the number of neighbors nexploited in the first layer of the network. The results are shown for the correlation-based metric
3
Type of feature for Number of neighbors (n)
Selection Similarity Mnmetric Rnmetric
of neighbors computation 10 50 100 150 10 50 100 150
Subset of RG dataset (35 pairs). Unimodal baselines: CC:0.85, CT:0.67, VS:0.47. Textual (CC) Visual (VS) 0.64 0.79 0.79 0.70 0.44 0.34 0.33 0.35
Textual (CT) Visual (VS) 0.78 0.76 0.69 0.66 0.29 0.37 0.35 0.33
Visual (VS) Textual (CC) 0.58 0.55 0.29 0.36 0.73 0.86 0.89 0.88
Visual (VS) Textual (CT) 0.48 0.42 0.25 0.33 0.64 0.67 0.61 0.59
Visual (VS) Visual (VS) 0.43 0.40 0.23 0.27 0.40 0.45 0.44 0.35
Subset of WS353 dataset (175 pairs). Unimodal baselines: CC:0.61, CT:0.25, VS:0.33. Textual (CC) Visual (VS) 0.44 0.59 0.66 0.70 0.18 0.24 0.21 0.22
Textual (CT) Visual (VS) 0.44 0.47 0.38 0.32 0.21 0.28 0.27 0.25
Visual (VS) Textual (CC) 0.47 0.41 0.37 0.32 0.62 0.67 0.67 0.65
Visual (VS) Textual (CT) 0.34 0.33 0.34 0.28 0.33 0.26 0.22 0.20
Visual (VS) Visual (VS) 0.37 0.30 0.31 0.27 0.17 0.34 0.33 0.31
Table 2: Performance ofMnandRnmetrics for various combinations of textual (CC or CT) and visual (VS) features.
20 40 60 80 100 120 140
0.54 0.56 0.58 0.6 0.62 0.64 0.66 0.68 0.7 0.72
Number of neighbors (n)
Correlation
(CC+VS)/CC
Weighted (CC+VS)/CC
(CC⋅VS)/CC
No fusion: VS/CC
(a)
20 40 60 80 100 120 140
0.54 0.56 0.58 0.6 0.62 0.64 0.66 0.68 0.7 0.72
Number of neighbors (n)
Correlation
(CC∪VS)/CC
(CC∩VS)/CC
No fusion: VS/CC
(b) Figure 1: Correlation as a function of the number of neighbors for the fusion of multimodal representations: (a) globally, and (b) locally.
Rn only4 with respect to the largest dataset (WS353).
Both textual and visual modalities were fused in the first layer, while the textual modality was used for the com-putation of similarity in the second layer. Specifically, the CC feature type was employed for computing sim-ilarities computation (instead of CT) based on the very good performance of the VS/CC approach. For compari-son purposes, the performance of the crossmodal VS/CC approach is also depicted in the same figure, which can be regarded as a baseline since no fusion is performed in the first layer. We observe that for small seman-tic neighborhoods (e.g., 10 neighbors) the baseline ap-proach yields higher correlation scores compared to the fusion schemes. However, for larger neighborhoods (> 50 neighbors) the fusion-based approaches perform
con-4For the case of theM
n metric no statistically significant
improvements were gained.
sistently better than the baseline. The best results (up to 0.70) are obtained by the weighted additive fusion scheme for 50-100 neighbors. Regarding fusion, the multiplicative scheme appears to perform better than the other schemes for neighborhoods including 10-30 neigh-bors. For larger neighborhoods all schemes exhibit com-parable performance. In addition, the weighted addi-tive fusion scheme seems to yield slightly higher perfor-mance compared to the respective unweighted scheme. The performance of the local fusion schemes is depicted in Figure 1(b), along with the baseline also plotted in Figure 1(a). As in the case of global fusion, the base-line obtains higher correlation when few neighbors are exploited. Both fusion types yield higher performance than the baseline for neighborhoods containing more the 50 neighbors5. The top correlation scores (0.71) are
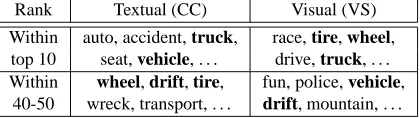
Rank Textual (CC) Visual (VS)
Within auto, accident, truck, race, tire, wheel, top 10 seat, vehicle, . . . drive, truck, . . . Within wheel, drift, tire, fun, police, vehicle,
40-50 wreck, transport, . . . drift, mountain, . . .
Table 3: Neighbors of “car” wrt CC and VS features.
achieved by the intersection-based fusion scheme for 110-120 neighbors. This scheme appears to perform bet-ter than the union-based one except for 60-80 neighbors. In Table 3, we present a number of indicative neighbors for the target word “car” when using CC and VS, while the common neighbors are shown in bold. This is per-formed for two zones of the respective activations. Re-garding the top 10 zone, both CC and VS capture neigh-bors highly related to “car”. For broader activations, (e.g., see 40-50 zone) less semantically relevant words (e.g., fun, mountain) are identified by VS compared to CC.
7.
Conclusions
The main finding of this work is that the network ap-proach is an appropriate representation and integration framework for textual and visual features. This was ver-ified for the problem of word semantic similarity, for which the network metrics exceeded the performance of baseline metrics. This observation agrees with the cognitive evidence regarding the multimodal character of semantic representations. In addition, both modali-ties were successfully fused in the representation layer when exploiting more than 50 neighbors. The highest performance was achieved by the intersection-based fu-sion scheme supporting the idea that the commonality of features across modalities is a good criterion for build-ing semantically more accurate representations. Regard-ing future work, we aim to apply the proposed model to datasets in other languages. Our long term goal is to extend the presented network with audio-based features, including the investigation of modality-specific metrics of semantic similarity.
8.
Acknowledgments
This work has been partially funded by the SpeDial project supported by the EU FP7 with grant num. 611396, BabyRobot project supported by the EU Hori-zon 2020 Programme with grant num. 687831, and the BabyAffect project supported by the Greek General Sec-retariat for Research and Technology with grant num. 3610. The authors wish to thank Prof. Marco Baroni and
both fusion schemes and the baseline (i.e., no fusion) were found to be statistically significant at 95% level according to paired-samplet-test.
Dr. Elia Bruni for proposing the incorporation of visual features in our two-tier model, as well as for providing the visual features used for experiments.
9.
References
Barnard, K., Duygulu, P., Forsyth, D., de Freitas, N., and Blei, D. M. (2003). Matching words and pictures.
Machine Learnaning Research, 3:1107–1135.
Baroni, M. and Lenci, A. (2010). Distributional mem-ory: A general framework for corpus-based semantics.
Computational Linguistics, 36(4):673–721.
Barsalou, L. W., Santos, A., W, K. S., and Wilson, C. D. (2008). Language and simulation in conceptual pro-cessing. In M. De Vega, et al., editors, Symbols,
Em-bodiment, and Meaning, pages 245–283. Oxford
Uni-versity Press.
Besancon, R. and Millet, C. (2005). Merging results from different media: Lic2m experiments at Image-CLEF 2005. In Working notes of the Image-CLEF.
Bruni, E., Tran, G. B., and Baroni, M. (2011). Distri-butional semantics from text and images. In Proc. of
the Workshop on Geometrical Models of Natural Lan-guage Semantics (GEMS), pages 22–32.
Bruni, E., Tran, N. K., and Baroni, M. (2014). Multi-modal distributional semantics. Journal of Artificial
Intelligence Research, 49(1):1–47.
Caicedo, J., Ben-Abdallah, J., Gonz´alez, F., and Nas-raoui, O. (2012). Multimodal representation, index-ing, automated annotation and retrieval of image col-lections via non-negative matrix factorization.
Neuro-computing, 76(1):50–60.
Csurka, G., Dance, C. R., Fan, L., Willamowski, J., and Bray, C. (2004). Visual categorization with bags of keypoints. In Proc. of the Workshop on Statistical
Learning in Computer Vision, pages 1–22.
Escalante, H. J., H´ernadez, C. A., Sucar, L. E., and Montes, M. (2008). Late fusion of heterogeneous methods for multimedia image retrieval. In Proc. of
IJCNLP.
Everitt, B. (1998). The Cambridge Dictionary of
Statis-tics. Cambridge University Press.
Feng, Y. and Lapata, M. (2010). Visual information in semantic representation. In Proc. of the HLT-NAACL, pages 91–99.
Finkelstein, L., Gabrilovich, E., Matias, Y., Rivlin, E., Solan, Z., Wolfman, G., and Ruppin, E. (2002). Plac-ing search in context: The concept revisited. ACM
Transactions on Information Systems, 20(1):116–131.
Frome, A., Corrado, G. S., Shlens, J., Bengio, S., Dean, J., and Mikolov, T. (2013). Devise: A deep visual-semantic embedding model. In Proc. of NIPS. Georgiladakis, S., Iosif, E., and Potamianos, A. (2015).
function distributional semantic models. In Proc. of
NAACL–HLT Workshop on Cognitive Modeling and Computational Linguistics, pages 39–47.
Gracia, J., Trillo, R., Espinoza, M., and Mena, E. (2006). Querying the web: A multiontology disambiguation method. In Proc. of International Conference on Web
Engineering, pages 241–248.
Hare, J. S., Samangooei, S., Lewis, P. H., and Nixon, M. S. (2008). Semantic spaces revisited: investigat-ing the performance of autoannotation and semantic retrieval using semantic spaces. In Proc. of the
inter-national conference on content-based image and video retrieval, page 359368.
Harnad, S. (1990). The symbol grounding problem.
Physica D: Nonlinear Phenomena, 42:335–346.
Harris, Z. (1954). Distributional structure. Word,
10(23):146–162.
Iosif, E. and Potamianos, A. (2015). Similarity computation using semantic networks created from web-harvested data. Natural Language Engineering, 21(01):49–79.
Iosif, E., Giannoudaki, M., Fosler-Lussier, E., and Potamianos, A. (2012). Associative and semantic fea-tures extracted from web-harvested corpora. In Proc.
of the Eighth International Conference on Language Resources and Evaluation, pages 2991–2998.
Karpathy, A. and Li, F. (2014). Deep visual-semantic alignments for generating image descriptions. CoRR, abs/1412.2306.
Kiela, D. and Clark, S. (2015). Multi- and cross-modal semantics beyond vision: Grounding in auditory per-ception. In Proc. of EMNLP.
Landau, B., Smith, L., and Jones, S. (1998). Object perception and object naming in early development.
Trends in Cognitive Science, 27:19–24.
Leong, C. W. and Mihalcea, R. (2011). Going beyond text: A hybrid image-text approach for measuring word relatedness. In Proc. of IJCNLP, pages 1403– 1407.
Lowe, D. G. (1999). Object recognition from local scale-invariant features. In Proc. of International
Con-ference on Computer Vision, pages 1150–1157.
Lowe, D. G. (2004). Distinctive image features from scale-invariant keypoints. International Journal of
Computer Vision, 60(2):91–110.
McNamara, T. P. (2005). Semantic priming:
Perspec-tives from Memory and Word Recognition.
Psychol-ogy Press.
Monay, F. and Gatica-Perez, D. (2007). Modeling se-mantic aspects for cross-media image indexing. IEEE
Transactions on Pattern Analysis and Machine Intelli-gence, 29:1802–1817.
Osherson, D. N. and Smith, E. E. (1981). On the
ad-equacy of prototype theory as a theory of concepts.
Cognition, 9(1):35–58.
Potamianos, A. (2014). Cognitive multimodal process-ing: from signal to behavior. In Proc. of Workshop
on Roadmapping the Future of Multimodal Interaction Research.
Resnik, P. (1995). Using information content to evaluate semantic similarity in a taxanomy. In Proc. of
Inter-national Joint Conference for Artificial Intelligence,
pages 448–453.
Rubenstein, H. and Goodenough, J. B. (1965). Contex-tual correlates of synonymy. Communications of the
ACM, 8(10):627–633.
Sivic, J. and Zisserman, A. (2003). Video Google: A text retrieval approach to object matching in videos. In Proc. of the Ninth IEEE International Conference
on Computer Vision, pages 1470–1477.
Socher, R., Ganjoo, M., Sridhar, H., Bastani, O., Man-ning, C. D., and Ng, A. Y. (2013). Zero-shot learn-ing through cross-modal transfer. In Proc. of
In-ternational Conference on Learning Representations (ICLR).
Stenberg, G., Radeborg, K., and Hedman, L. R. (1995). The picture superiority effect in a cross-modality recognition task. Memory and Cognition, 4:425–441. Therriault, D., Yaxley, R., and Zwaan, R. (2009). The
role of color diagnosticity in object recognition and representation. Cognitive Processing, 10:335–342. Vedaldi, A. and Fulkerson, B. (2013). Vlfeat: An open
and portable library of computer vision algorithms.
www.vlfeat.org/.
von Ahn, L. and Dabbish, L. (2004). Labeling images with a computer game. In Proc. of conference on
hu-man factors in computing systems, pages 319–326.