www.elsevier.nl/locate/susc
Comparative theoretical study of the Ag–MgO (100) and
(110) interfaces
Yu.F. Zhukovskii
a,b
, E.A. Kotomin
a,c,
*, P.W.M. Jacobs
b
, A.M. Stoneham
d
,
J.H. Harding
d
aInstitute of Solid State Physics, University of Latvia, Kengaraga 8, LV-1063 Riga, Latvia
bDepartment of Chemistry, University of Western Ontario, London, Ont. N6A 5B7, Canada
cFachbereich Physik, Universita¨t Osnabru¨ck, Barbarastrasse 7, D-49069, Osnabru¨ck, Germany
dCentre for Materials Research, Department of Physics and Astronomy, University College London, Gower Street, London WC1E 6BT, UK
Received 9 April 1999; accepted for publication 16 July 1999
Abstract
We have calculated the atomic and electronic structures of Ag–MgO(100) and (110) interfaces using a periodic (slab) model and an ab initio Hartree–Fock approach with a posteriori electron correlation corrections. The electronic structure information includes interatomic bond populations, effective charges, and multipole moments of ions. This information is analyzed in conjunction with the interface binding energy and the equilibrium distances for both interfaces for various coverages. There are significant differences between partly covered surfaces and surfaces with several layers of metal, and these can be understood in terms of electrostatics and the electron density changes.
For complete monolayer (1:1) coverage of the perfect MgO(100) surface, the most favorable adsorption site energetically for the Ag atom is above the surface oxygen. However, for partial (1:4) coverage of the same surface, the binding energies are very close for all the three likely adsorption positions (Ag over O, Ag over Mg, Ag over a gap position).
For a complete (1:1) Ag monolayer coverage of the perfect MgO(110) interface, the preferable Ag adsorption site is over the interatomic gap position, whereas for an Ag bilayer coverage the preferred Ag site is above the subsurface Mg2+ ion (the bridge site between two nearest surface O2− ions). In the case of 1:2 layer coverage, both sites are energetically equivalent. These two adhesion energies for the (110) substrate are by a factor of two to three larger than over other possible adsorption sites on perfect (110) or (100) surfaces.
We compare our atomistic calculations for one to three Ag planes with those obtained by the shell model for 10 Ag planes and the Image Interaction Model addressing the case of thick metal layers. Qualitatively, our ab initio results agree well with many features of these models. The main charge redistributions are well in line with those expected from the Image Model. There is also broad agreement in regard to orders of magnitude of energies. © 1999 Elsevier Science B.V. All rights reserved.
Keywords: (100) and (110) interfaces; Adhesion; Adsorption; Ag–MgO; Hartree–Fock method; Image interaction model
* Corresponding author. Fax:+371-711-2583. E-mail address:[email protected] ( E.A. Kotomin)
1. Introduction balance between Ag island and monolayer-mode growth.
Despite the existence of many theoretical studies The understanding and control of metal–
of the adhesion of noble and transition metals on ceramic interfaces underpins many technological
MgO substrates [11,32–46 ], a full understanding applications (see Refs. [1–25] and references cited
of interface formation and of properties on an therein). These interfaces are often very complex.
atomic scale is still lacking. Partly this is because One example might be the interface between a
of some very sensitive balances between contribu-nuclear fuel (basically UO
2+x with fission pro- tions to the energy. Indeed, it is arguable that the
ducts) in contact with the alloy clad. There is,
successes are more surprising than the inconsisten-therefore, a substantial gap between the basic
cies. This is especially true when the range of science of idealized interfaces and the formulations
methods is recognized. Cluster models [32– that can be used by engineers. In the case of
34,42,43] andslabmodels (periodic in two dimen-metal–ceramic interfaces, the phenomenological
sions) [36–41] have been used; a few calculations Image Interaction Model (IIM ) [11] could bridge
have attempted proper embedding [23]. An ab this gap, and one of our aims is to check and
initio Hartree–Fock formalism has been used in validate some of the ideas within that description.
cluster calculations of some Me–MgO interfaces We shall also link our results to experiment,
nota-[32–34]. The local density approximation (LDA), bly to high-resolution electron microscopy
meas-as implemented in a full-potential linearized urements, which give data for a few metal–oxide
muffin-tin orbital method (FP LMTO), has been (e.g. Ag–MgO) interfaces [26,27] at near-atomic
applied in a slab model for metal adhesion on the resolution.
MgO surfaces [36–38], as have full-potential lin-For liquid-metal–oxide interfaces, a small
adhe-earized augmented plane waves (FP LAPW ) [39], sion energy is associated with a large wetting angle.
and self-consistent local orbitals (LO) [40–43]. In Wetting (small wetting angle) is often found when
order to go beyond the LDA approximation for there is a chemical reaction between the liquid
metal–oxide interfaces, we recently made prelimi-metal and the oxide substrate. For non-reactive
nary Hartree–Fock calculations for the Ag–MgO liquid metals, there are systematic trends of wetting
(100) interface using a slab model [44,45]. angle with substrate [11]. For Ag–MgO, our
calcu-In addition to the methods that calculate lation shows negligible chemical reaction with per- electronic structure explicitly, two other atomistic fect MgO surfaces. The major terms in adhesion methods have been used with success for these must, therefore, correspond to a physical mecha- interfaces: the atomistic shell model (SM ) [46 ] and nism, for instance the polarization of the metal by the IIM [11,12]. The latter model has sufficient the oxide ions, which underlies the Image model. simplicity for application to those very complex What is seen for solid metal films on oxides systems that are important technologically. depends strongly on growth conditions, at least In this paper, we give the first comparative ab for thin metal layers on an oxide substrate. Thus, initio study of the Ag–MgO(100) and (110) inter-Ag growth on MgO usually gives rise to three- faces based on a quantitative analysis of the bond-dimensional islands [26–28]. On the other hand, a ing in the interfacial region. We shall describe the recent low-energy electron diffraction study indi- way in which interfacial electronic and other prop-cates a layer-by-layer growth mode for silver erties evolve as a function of metal coverage. deposits on vacuum-cleaved MgO(100) surfaces,
even though such a structure is metastable [29,30].
Part of the explanation will lie in kinetics, the rate 2. Theoretical
of Ag deposition and the competition between
different surface processes [31]. It is also clear that 2.1. Computational details
defects can play a crucial role in determining the
which incorporates electron correlation corrections (hereafter termed the HF-CC method ). These cor-rections were calculated using density-functional theory [48]. Such terms are necessary, since stan-dard Hartree–Fock theory underestimates binding energies and overestimates bond lengths of mole-cules. In the framework of the HF-CC method, we used Perdew–Wang a posteriori corrections [49]. The basis set for MgO, optimized elsewhere [50], consists of all-electron 8-61G and 8-51G functions (s and sp shells) for Mg and O atoms respectively. To reduce computational efforts, we employed the small-core Hay–Wadt pseudo-potentials for Ag atoms [51], thus reducing the total number of electrons per Ag atom to 19
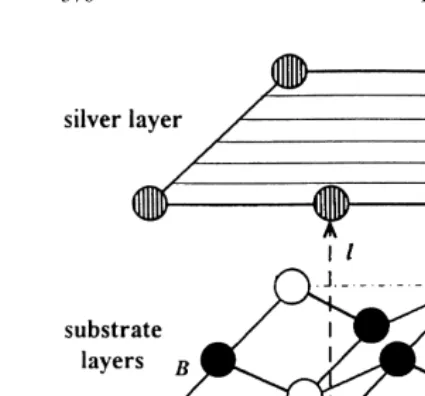
(4s24p64d105s1). An initial guess for the basis set Fig. 1. Fragment of the Ag–MgO (100) interface where Ag
of bulk silver (311-31G for sp and d shells) was atoms are placed at the distancelabove O atoms of the sub-strate surface (Aconfiguration). Two other possible adsorption
taken from AgCl calculations [52], and the outer
positions are above the gap (B) and Mg atoms (C). Additional
exponents were re-optimized [44,45]. Calculations
atomic wave functions in the Ag slab are centered in its hollow
starting with the Ag 4d95s2 configuration give
sites (D).
essentially the same results.
2.2. The model of the Ag–MgO (100) interface
tion: above surface Mg2+ions (C), above surface O2− ions (A), and in the interatomic gaps (B) The CRYSTAL-95 computer code allows
calcu-shown in Fig. 1. In calculations for the (1:1) Ag lations on finite-thickness slabs as two-dimensional
coverage of the perfect MgO(100) surface we have periodic systems. We have simulated the Ag–
also used additional atomic wave functions (to MgO(100) interface (Fig. 1) with either one Ag
give greater variational freedom [44,45]) centered monolayer or three Ag layers atop three layers of
in hollow sites D in the Ag slabs (Fig. 1). A the oxide substrate. For the monolayer, we have
preliminary optimization of their basis set 1(sp)– considered full coverage [a complete (1:1)
sub-1(d )G was carried out for bulk silver [45]. strate] and partial (1:4) Ag coverage.
The optimized value of the lattice constant for
2.3. The Ag–MgO(110) interface model
the three-layer MgO slab (4.21 A˚ [44]) is very close to the experimental bulk value (4.205 A˚
For complete (1:1) coverage of the perfect [50]). In line with all previous calculations, we
MgO(110) surface, we have simulated the adhe-ignore the small (3%) mismatch in the lattice
sion both of an Ag monolayer and an Ag bilayer constants of fcc Ag (4.08 A˚ [53]) and MgO,
on a three-layer MgO substrate ( Fig. 2). A previ-although we recognize that this leads to mismatch
ous study of MgO(110) [54] revealed that three dislocations when we compare with experiment. In
planes sufficed for geometry and surface energy our calculations, we fix the lattice constant along
optimization. The adhesion energy (we defined it the surfacexyplane at 4.21 A˚ , and allow only the
elsewhere [44,45]) has been optimized for all five interfacial (metal–substrate) distance to vary along
potential sites for Ag atom adsorption: above the z axis, perpendicular to the interface. The
surface Mg2+ or O2− ions, above subsurface distances between different silver planes within the
Mg2+or O2−ions, and in the interatomic gap. As metal slab are also free to change (for the
three-for the Ag–MgO(100) interface, we have both layer Ag(100) slab they were optimized to be
ignored the small lattice mismatch between fcc Ag 1.98 A˚ [45]). We have obtained results in this way
Ag. For full (1:1) coverage, whether there are one or three layers of Ag, adsorption over the surface O atoms is most favorable energetically. This agrees with recent experiments [55] and with three previous LDA-type calculations [36–39]. It contra-dicts those IIM results [20,23] for which the most accurate treatment of the dispersion forces is included, but agrees with the Image Model (IM ) approach with a less-accurate treatment of disper-sion. The main difference for the IIM appears to be associated with the strength of the long-range dispersion forces between the Ag and the O neigh-bors of the Mg site below the Ag.
For the favored A configuration (Ag over O; see Fig. 1) the equilibrium interface distances cal-culated for all the microscopic methods are reason-ably close, falling into narrow range between 2.5 and 2.7 A˚ ; the IM also agrees, giving 2.53 A˚. Our
Fig. 2. Fragment of the Ag–MgO (110) interface where Ag
HF-CC value of 2.43 A˚ for three metal layers
atoms are positioned above O atoms of the substrate surface
(Aconfiguration). Four other possible positions are above sur- coincides with the recent experimental data [55]. face Mg atoms (B), subsurface O and Mg atoms (Cand D We have examined the effects of extending the respectively) as well as the gap (E). In the figure, the interlayer
basis set to include special atomic wave functions
spacing in the MgO(110) slab is somewhat compressed, whereas
(Section 2.2) in the hollow positions Dof the Ag
the interface spacinglis slightly expanded to aid visualization.
slab (Fig. 1). Their effect is to strengthen slightly the interfacial binding and to bring the metallic the bilayer Ag(110) slab. To simulate a partial
film and oxide substrate closer. The effect is largest (1:2) substrate coverage by silver atoms, we have
for theAconfiguration, where the change is 0.08 A˚ used a 1×2 extended Ag layer along the [110] axis
(about 3%). As a result, the adhesion energy per (this is parallel to the strips on the Ag layer shown
Ag atom in the monolayer is increased. Our mono-in Fig. 2), so that there are alternatmono-ing equivalent
layer adhesion energy of 0.25 eV is close to the sites that are occupied or unoccupied by Ag atoms.
value of 0.30 eV obtained for the same structure Unlike the perfect MgO(100) substrate, where
in the FP LAPW calculations [39] ( Table 1). On every surface ion is surrounded by five dissimilar
the other hand, an increase in the number of Ag ions, the atoms on the (110) surface are fourfold
planes to three increases the HF-CC adhesion coordinated: surface rows along the [110] direction
energy over O atoms to 0.46 eV, but does not contain only cations or only anions. Taking into
affect much the adhesion for Ag over a gap or account the fact that the surface energy of less
over an Mg atom. Nevertheless, our value of densely packed MgO(110) is larger than for
0.46 eV is smaller than the adhesion energy of MgO(100) [54], one expects stronger adsorbate
0.88 eV found in FP LMTO calculations on the binding. This was indeed found for CO molecular
same interfacial structure (three Ag layers) [36 ]. adsorption [54].
The relevant experimental estimate is 0.26 eV [26,27], which is probably lower due to the pres-ence of misfit dislocations caused by the 3%diff
er-3. Results and discussion
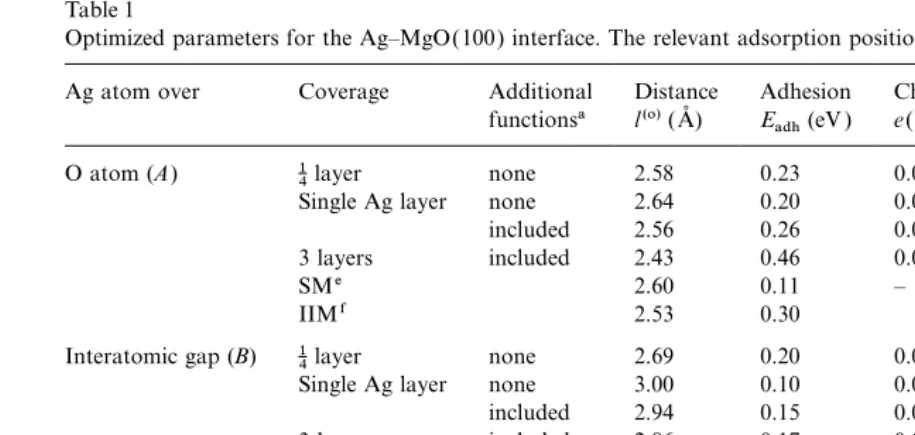
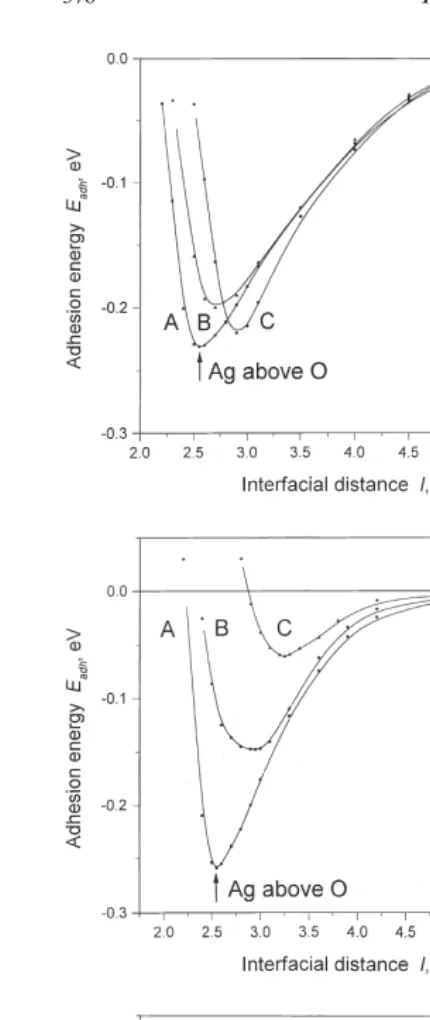
ence in lattice parameters of Ag and MgO ( Fig. 3). Chemical bonding across the interface between
3.1. Adhesion on the MgO (100) surface
metal and oxide substrate is negligible: the adhe-sion is physical in origin. The calculated Mulliken Table 1 and Fig. 3. summarizes our main results.
Table 1
Optimized parameters for the Ag–MgO(100) interface. The relevant adsorption positions are shown in Fig. 1
Ag atom over Coverage Additional Distance Adhesion Chargeb Dipolec Quadrupolec
functionsa l(o)(A˚ ) Eadh(eV ) e(00)Ag(e) d(10)Ag(eao) q(20)Ag(ea2o)
O atom (A) 14layer none 2.58 0.23 0.063 0.251 −0.433
Single Ag layer none 2.64 0.20 0.028 0.130 −2.052
included 2.56 0.26 0.037 0.198 −2.232
3 layers included 2.43 0.46 0.053d 0.418d −1.971d
SMe 2.60 0.11 – – –
IIMf 2.53 0.30
Interatomic gap (B) 14layer none 2.69 0.20 0.052 −0.007 0.140 Single Ag layer none 3.00 0.10 0.025 −0.038 −1.408
included 2.94 0.15 0.035 −0.034 −1.597
3 layers included 2.86 0.17 0.050d 0.182d −0.963d
IIMf 2.53 0.48
Mg atom (C) 14layer none 2.89 0.22 0.038 −0.170 0.414
Single Ag layer none 3.24 0.06 0.015 −0.065 −1.314
included 3.23 0.06 0.027 −0.071 −1.288
3 layers included 3.23 0.07 0.042d 0.116d −0.686d
SMe 3.20 0.02 – – –
IIMf 2.74 0.60
aAdditional atomic wave functions centered in hollow sitesD( Fig. 1).
bPositive sign means excess of the electron density compared with a neutral atom.
cThe values of dipole and quadrupole moments are given in atomic units (1 a
o=1 Bohr). dFor the interfacial silver layer.
eThe shell model calculations [46 ] for 10 Ag layers atop 31 MgO planes.
fThe IIM [20,23].
transfer between MgO and Ag [see the e(00) tions in metal films could a good fit be found for theoretical surface phonon-dispersion curves to column in Table 1]. The bond populations across
the interface [between Ag atoms and ions of the experimental data.
The bond population analysis, already men-perfect MgO(100) substrate] are practically zero.
We remark that the existence of a good fit [40,41] tioned, gives a reason for Ag adsorption over O2− ions to be favored. This preference is related of the interfacial energy versus interface distance
to the so-called universal binding energy relation to electrostatic attraction involving the enhanced Ag electron density concentrated around the (similar to the potential energy curve for diatomic
molecule) does not necessarily imply chemisorp- hollow position in the interfacial Ag layer (0.07e
for the 1:1 Ag coverage). The extra charge has an tion between metal and substrate (see more in
Ref. [45]). attractive interaction with the substrate Mg2+ion
below it ( Fig. 1). On the other hand, for the Ag On the other hand, there is redistribution of
charge within the metal. We observe considerable adsorption over the Mg2+ ions, there is instead repulsion between the electron density localized in bond populations between nearest Ag atoms (0.1e
per atom) within the metal planes parallel to the theDposition and the substrate O2−ion below it. The atomic dipole moments d(10) in Table 1 interface. This population is not sensitive to the
adsorption site. The concentration of the electron are calculated as matrix elements of the atomic orbitals with the operatorz(the direction pointing density in the Ag at the bridge position between
nearest metal atoms has been confirmed recently outwards from the surface) [47,54]. They charac-terize a shift of electron density along the z axis. in inelastic He scattering studies [56 ]; only by
oppo-site signs above O and above Mg, corresponding to electrons being repelled by the anion or attracted by the cation. For the Ag monolayer, the dipole moment is largest for Ag over the (optimal ) O site. The quadrupole moments q(20) in Table 1 are matrix elements with the operator
z2−(x2+y2)/2, and also characterize atomic defor-mation. These moments are affected significantly by Ag 4d–5s orbital mixing. A negative q(20)
Ag
(as found in almost all cases except the 1 4 layer)
means the Ag has contracted axially (zdirection) and expanded in the xyplane. For all adsorption positions, magnitudes for Ag atoms are at least a factor four larger than the corresponding magni-tudes for surface Mg2+ and O2− ions. Thus, Ag atoms adsorbed on the MgO(100) surface are considerably deformed.
The larger adhesion energy for three Ag layers, compared with an Ag monolayer, can be attributed to a more complicated electron density distribution in the interfacial Ag layer for both the A and C
interfacial configurations. For the A adsorption site, a charge of 0.04e is localized on the corre-sponding hollow position over Mg2+, whereas 0.12eis localized on each of the four side bridge positions in the plane above the Dpoint. For the
C adsorption site, the corresponding electron densities over O2− are smaller (0.03e and 0.1e
respectively) and much more remote from the surface oxygen ion. There may be a similar expla-nation for the additional increase of the adhesion energy when introducing atomic orbitals at theD
positions for both one- and three-layer Ag slabs. The effective atomic charges and their definitions are discussed further in Ref. [56 ].
For partial (1:4) Ag coverage of the MgO(100) surface there are differences from both the mono-layer and three mono-layer (1:1) coverages. For such a low coverage there is practically no interatomic electron density concentration between Ag atoms; therefore, its interaction or repulsion with the nearest substrate atom plays no role here. For Ag adsorption over O or Mg ions, there is a single
Fig. 3. The interfacial energies for different adsorption sites for
nearest substrate ion (either O2− or Mg2+) and
Ag atoms on the perfect MgO(100) surface as a function of the
four next-nearest substrate ions of the opposite
distance l between adsorbent and adsorbate (Fig. 1). Three different substrate coverages by silver:1
4layer (a), monolayer type (either Mg2+or O2−). However, for the gap
(b) and three layers (c) (with additional atomic wave functions adsorption site, every Ag atom has four nearest included for the two latter cases) are studied. Full lines are
substrate ions (two Mg2+ and two O2−). Since adsorption energies of these relatively isolated Ag atoms are close for all three adsorption sites (A,B
and C), the difference from full coverage may be explained by a partial compensation of electro-static attraction and repulsion between slightly charged Ag adatoms and the substrate ions.
For the 1:4 surface coverage, charge transfer from the substrate to each isolated Ag atom is small (0.06e), yet it is still twice as large as for the Ag monolayer or for three Ag layers atop MgO. The value of the dipole moment for the Ag atom is also twice as large for 1:4 as it is for 1:1 coverage. The isolated Ag atom charge density is deformed along the zaxis as expected in the IM model. On the other hand, the quadrupole moment is signifi-cantly smaller for a single Ag than that for a
Fig. 4. Thedifferenceelectronic density maps (the total density
monolayer, which shows that its non-spherical
minus superposition of atomic densities) or the cross-section
deformation due to the field gradient of the MgO perpendicular to the (100) interface plane for1
4Ag adsorption:
ions is small ( Table 1). This difference may be (a) over O and (b) over Mg ions. Isodensity curves are drawn from−1 to+1ea–3o with an increment of 0.0015ea–3o. The full,
associated with the mismatch of Ag and MgO
dashed and chained curves show positive, negative and zero
lattice spacings, which is a bigger effect for full
difference densities respectively. Note that Ag atoms are
coverage situations. Fig. 4 shows the difference
strongly polarized: above O ions (a) the electron density is
electron density maps for low Ag coverage over O shifted in the direction outwards from the surface, whereas and Mg ions. This demonstrates that Ag atoms above Mg (b) it is shifted towards surface Mg ions.
are more polarized above O substrate ions where the charge transfer from the substrate is greater.
3.2. Adhesion on perfect MgO (110) surface
Various difference electron density maps were
dis-cussed by us earlier for the cases of one [44] and The basic properties for the Ag–MgO(110) three [45] Ag layers above the MgO(100) interface are summarized in Table 2 and Fig. 5.
substrate. Unlike the Ag–MgO(100) interface, the preference
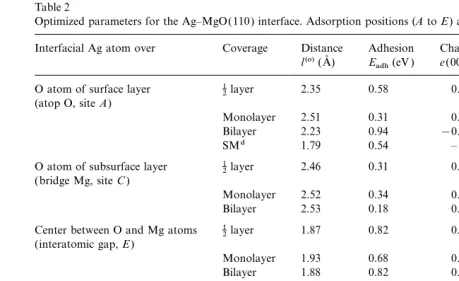
Table 2
Optimized parameters for the Ag–MgO(110) interface. Adsorption positions (AtoE) are shown in Fig. 2
Interfacial Ag atom over Coverage Distance Adhesion Chargea Dipoleb Quadrupoleb
l(o)(A˚ ) Eadh(eV ) e(00)Ag(e) d(10)Ag(eao) q(20)Ag(ea2o) O atom of surface layer 12layer 2.35 0.58 0.072 0.474 −1.238 (atop O, siteA)
Monolayer 2.51 0.31 0.049 0.298 −1.645
Bilayer 2.23 0.94 −0.007c 0.637c −2.161c
SMd 1.79 0.54 – – –
O atom of subsurface layer 12layer 2.46 0.31 0.050 −0.363 0.162 (bridge Mg, siteC)
Monolayer 2.52 0.34 0.053 −0.341 −0.435
Bilayer 2.53 0.18 0.088c −0.05c −0.45c
Center between O and Mg atoms 1
2layer 1.87 0.82 0.112 0.048 −0.551
(interatomic gap,E)
Monolayer 1.93 0.68 0.087 0.022 −1.210
Bilayer 1.88 0.82 0.088c 0.308c −0.785c
Mg atom of surface layer 1
2layer 2.97 0.16 0.03 −0.281 0.132
(atop Mg, siteB)
Monolayer 2.92 0.19 0.035 −0.257 −0.467
Bilayer 3.04 0.09 0.050c 0.086c −0.346c
SMd 2.40 0.03 – – –
Mg atom of subsurface layer 12layer 1.95 0.82 0.076 0.576 −1.203 (bridge O, siteD)
Monolayer 2.05 0.38 0.051 0.470 −1.836
Bilayer 1.75 1.32 −0.092c 0.789c −1.833c aPositive sign means excess of the electron density compared with a neutral atom.
bThe values of dipole and quadrupole moments are given in atomic units (1 a
o=1 Bohr). cFor the interfacial silver layer.
dThe shell model calculations [46 ] for 10 Ag layers atop 31 MgO layers.
dently larger as well, confirming qualitatively our case it is reduced by the interactions with the four AgMMg bonds of the first coordination semi-results for the Ag–MgO(100) interface ( Table 1).
All kinds of Ag atoms adsorbed on the MgO(110) sphere ( Fig. 1). By bonds we mean simply a ten-dency to form AgMO bonds; despite the fact that surface have larger quadrupole moments than on
the (100) interface, due to bigger electric field there is no pronounced quantitative bond popula-tion between the Ag and O atoms, the atoms are gradients above the (110) surface. (Analyses of
the dipole and quadrupole moments for the pure polarized towards each other to some extent, as is seen from the electron density maps.
and CO-covered MgO(110) surface are presented
in Ref. [54].) The difference electron density maps at different adsorption positions shown in Fig. 6 clearly The effects of substrate coverage are similar
to those for the Ag–MgO(100) interface demonstrate that the charge density in Ag atoms is changed much more at the Obridge(Mg bridge) (Section 3.1). For a low (1:2) coverage, the
electron density is no longer enhanced so much in positions compared with the single O (Mg) ion position, which is confirmed by inspection of interatomic positions of the silver film, so that the
mechanism of Ag atomic adsorption can be estab- Table 2. As for the (100) surface, Ag atoms are more polarized in a position above O ions rather lished more directly. An interaction along the
contrast, on Ag–MgO(110) a slight repulsion in two nearest AgMMg bonds is partly compensated by the attraction of the two next-nearest AgMO bonds (Fig. 2). For the bridge O sites (D) and the gap sites (E), the Ag atom interaction with two nearest O2−ions is even more evident.
For monolayer Ag coverage of the substrate,
there is an electrostatic repulsion between the O2− ions and an interatomic electron density [0.13–0.17e, which may be compared with 0.07– 0.1efor the (100) case]. That is why theDandA
sites become much less preferred, whereas in the gap site (E) the repulsion of O2− ions and the interatomic density is largely compensated by its attraction to Mg2+ ions. Thus, gap sites (E) are the most energetically favored for Ag monolayer substrate coverage.
In the case of an Ag bilayeron an MgO(110) surface, the major charge redistribution within the Ag(110) slab occurs over the A and D sites. Electron density is transferred from the interfacial silver layer (next to the MgO) to the outer Ag layer. The bond populations between Ag atoms also change. In the interfacial layer, the bond populations decrease down to 0.02–0.03e, but in the second (outer) layer and between the two Ag planes, the populations increase by up to 0.09– 0.1e. As a result, the interfacial Ag atoms have a net positive charge, which strengthens their inter-action with substrate O2−ions. At the same time, the electrostatic attraction between the interface interatomic electron density and the surface Mg2+ions becomes much smaller for theBandC
positions than it was for monolayer coverage. There is no significant change for the gap position
E, where there is compensation between attractive and repulsive effects.
Once again, from all results obtained, we can confirm unambiguously that there is no evidence of chemical binding between Ag and MgO(110): adhesion is physisorption. Just as we found for the perfect Ag–MgO(100) interface, the bond pop-ulations across the interface [between the Ag atoms
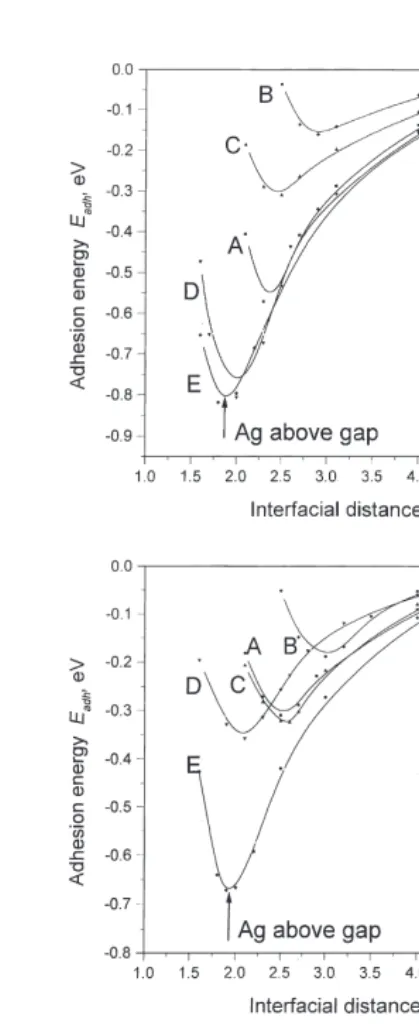
Fig. 5. The interfacial energies for different adsorption sites of Ag and the ions of the perfect MgO(110) substrate]
atoms on the perfect MgO(110) surface as a function of the dis- are negligible. This is in line with predictions of tanceslbetween adsorbent and adsorbate (Fig. 2). Three different
the IIM, except perhaps for the inter-Ag charge
substrate coverages: half-layer (a), monolayer (b) and bilayer (c)
effects.
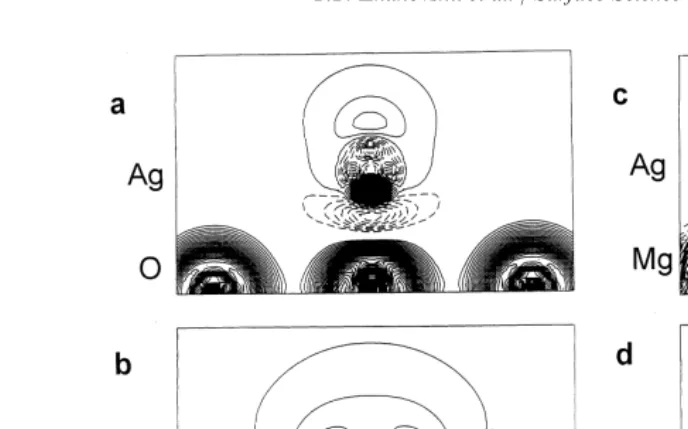
Fig. 6. Thedifferenceelectronic density maps for the cross-section perpendicular to the (110) interface plane for14Ag adsorption: (a) over a single O ion, (b) over O bridge, (c) over a single Mg ion, and (d ) over Mg bridge position. Isodensity curves are drawn from −1 to+1ea−o3with an increment of 0.0015ea−o3. The full, dashed and chained curves show positive, negative and zero difference densities respectively. As in Fig. 4, Ag atoms are strongly polarized: above O ions (a,b) the electron density is shifted in the direction outwards from the surface, whereas above Mg (c,d) it is shifted towards surface Mg ions. Note that the electron density for O ions (a,b) is visibly compressed in the Ag directions, compared with the other cases shown.
4. Conclusions several metal planes, whereas the IM prediction is
for a thick metal layer atop an oxide substrate. Is is well known that substrate near-surface defects One important general conclusion to be drawn
from the ab initio Hartree–Fock calculations is play a crucial role in metal adsorption on oxide surfaces and in the adhesion energy of metals to that chemical bond formation is not important for
either Ag–MgO(100) or Ag–MgO(110) perfect oxides as well [23,58–62]. This problem will be addressed in our next paper.
interfaces. Physical adhesion associated with polar-ization and charge redistribution are the dominant effects. The adhesion energy is enhanced by the
interaction of the substrate ions with the extra Acknowledgements
electron density near the interatomic positions of
the interfacial Ag layer. This favors silver atoms This study was supported by both the British-German Academic Collaboration Programme ARC placed above either surface O2−ions for the (100)
substrate, or the bridge position (the center project 88F and a British–Latvian Royal Society Joint Project Grant for collaborations with the between nearest oxygen ions) and thegapposition
(the middle between O2−and Mg2+ions) for the former Soviet Union. Y.Z. greatly appreciates the support of the Center for Chemical Physics and of (110) surface. The difference in predicted optimal
Ag adsorption sites observed for microscopic and the Department of Chemistry of the University of Western Ontario (Canada) for a Senior Visiting the IM stems mainly from the different treatments
of long-range dispersion (van der Waals) inter- Fellowship and a post-doctoral Fellowship. The authors kindly thank I. Abarenkov, M. Causa´, actions. However, these two kinds of calculation
complement each other, since they address D.M. Duffy, E. Heifets, V. Kempter and A.L. Shluger for many stimulating discussions.
[27] P. Guenard, G. Renaud, B. Vilette, M.-H. Yang, C.P.
References
Flynn, Scr. Metall. Mater. 31 (1994) 1221.
[28] M.-H. Schaffner, F. Patthey, W.-D. Schneider, Surf. Sci. [1] V.E. Heinrich, P.A. Cox, The Surface Science of Metal 417 (1998) 159.
Oxides, Cambridge University Press, Cambridge, 1994. [29] T. Harada, M. Asano, Y. Mizutani, J. Cryst. Growth 116 [2] F. Ernst, Mater. Sci. Eng. R14 (1995) 97. (1992) 243.
[3] M.W. Finnis, J. Phys.: Condensed Matter 8 (1996) 5811. [30] F. Didier, J. Jupille, Surf. Sci. 307–309 (1994) 587. [4] C.T. Campbell, Surf. Sci. Rep. 27 (1997) 1. [31] J.H. Harding, A.M. Stoneham, J.A. Venables, Phys. Rev. [5] G. Renaud, Surf. Sci. Rep. 32 (1998) 1. B 57 (1998) 6715.
[6 ] H.-J. Freund, M. Ba¨umer, J. Libuda, H. Kuhlenbeck, T. [32] N.C. Bacalis, A.B. Kunz, Phys. Rev. B 32 (1985) 4857. Risse, K. Al-Shamery, H. Hamann, Crystallogr. Res. Tech. [33] A.M. Ferrari, G. Pacchioni, J. Phys. Chem. 99 (1995)
33 (1998) 977. 17 010.
[34] A.M. Ferrari, G. Pacchioni, J. Phys. Chem. 100 (1996) 9032. [7] A.M. Stoneham, P.W. Tasker, in: J.A. Pask, A.G. Evans
[35] A.M. Stoneham, J.H. Harding, Acta Metall. Mater. 46 (Eds.), Ceramic Microstructures ’86, Plenum, 1987, p. 155.
(1998) 1155. [8] G. Ertl, H.-J. Freund, Phys. Today (1) (1999) 32.
[36 ] U. Scho¨nberger, O.K. Andersen, M. Methfessel, Acta [9] Proceedings of 4th International Symposium on
Atomi-Metall. Mater. 40 (1992) S1. cally Controlled Surfaces and Interfaces, Appl. Surf. Sci.
[37] J. Goniakowski, Phys. Rev. B 57 (1998) 1935. 130–132 (1998)
[38] J. Goniakowski, Phys. Rev. B 58 (1998) 1189. [10] A.M. Stoneham, J. Harding, T. Harker, Mater. Res. Soc.
[39] C. Li, R. Wu, A.J. Freeman, C.L. Fu, Phys. Rev. B 48 Bull. 21 (1996) 29.
(1993) 8317. [11] A.M. Stoneham, Appl. Surf. Sci. 14 (1983) 249.
[40] T. Hong, J.R. Smith, D.J. Srolovitz, J. Adhesion Sci. Tech-[12] A.M. Stoneham, P.W. Tasker, J. Phys. C 18 (1985) L543
nol. 8 (1994) 837. also Harwell, reprint TP1122.
[41] T. Hong, J.R. Smith, D.J. Srolovitz, Acta Metall. Mater. [13] P.W. Tasker, A.M. Stoneham, J. Phys. (Paris) 84 (1987)
43 (1995) 2721. 149.
[42] G. Pacchioni, N. Ro¨sch, J. Chem. Phys. 104 (1996) 7329. [14] A.M. Stoneham, P.W. Tasker, in: J.A. Pask, A.G. Evans [43] I.V. Yudanov, S. Vent, K. Neyman, G. Pacchioni, N.
(Eds.), Ceramic Microstructures ’87: Role of Interfaces,
Ro¨sch, Chem. Phys. Lett. 275 (1997) 245.
Plenum, Press, 1986, p. 155. [44] E. Heifets, E.A. Kotomin, R. Orlando, J. Phys.: Con-[15] P.W. Tasker, A.M. Stoneham, Mater. Sci. Eng. 4 (1988) densed Matter 8 (1996) 6577.
382. [45] E. Heifets, Yu.F. Zhukovskii, E.A. Kotomin, M. Causa,
[16 ] M.W. Finnis, A.M. Stoneham, P.W. Tasker, in: M. Ru¨hle Chem. Phys. Lett. 283 (1998) 395.
( Ed.), Metal–Ceramic Interfaces, Pergamon, Oxford, [46 ] J. Purton, S.C. Parker, D.W. Bullett, J. Phys.: Condensed
1990, p. 35. Matter 9 (1997) 5709.
[17] A.M. Stoneham, P.W. Tasker, in: S.D. Peteves ( Ed.), [47] R. Dovesi, V.R. Saunders, C. Roetti, M. Causa´, N.M. Designing Interfaces for Technological Applications Harrison, R. Orlando, E. Apra´, CRYSTAL-95 User
Manual, University of Turin, 1996. vol. 16 , Elsevier, 1989, p. 217.
[48] M. Causa´, A. Zupan, Chem. Phys. Lett. 220 (1994) 145. [18] A.M. Stoneham, D.M. Duffy, J.H. Harding, P.W. Tasker,
[49] J.P. Perdew, Y. Wang, Phys. Rev. B 45 (1991) 13 244. in: S.D. Peteves ( Ed.), Designing Ceramic Interfaces, CEC
[50] M. Causa´, R. Dovesi, C. Pisani, C. Roetti, Surf. Sci. 175 Directorate General, Science Research and Development,
(1986) 551. 1993, p. 573. also AEA-InTec-0708.
[51] P.J. Hay, W.R. Wadt, J. Chem. Phys. 82 (1985) 284. [19] D.M. Duffy, J.H. Harding, A.M. Stoneham, Acta Metall.
[52] E. Apra´, E.V. Stefanovich, R. Dovesi, C. Roetti, Chem. Mater. 40 (Suppl.) (1992) S11.
Phys. Lett. 186 (1991) 329. [20] D.M. Duffy, J.H. Harding, A.M. Stoneham appendix by
[53] R.W.G. Wyckoff, Crystal Structures, 2nd edition. vol. 1 J.R. Willis, Philos. Mag. A: 67 (1993) 865.
Wiley-Interscience, New York, 1963. [21] D.M. Duffy, J.H. Harding, A.M. Stoneham, J. Appl. Phys.
[54] M. Causa´, E.A. Kotomin, C. Pisani, C. Roetti, J. Phys. C. 76 (1995) 2791.
20 (1977) 4391. [22] A.M. Stoneham, D.M. Duffy, J.H. Harding, in: N.
Eusta-[55] P. Guenard, G. Renaud, B. Villette, Physica B 221 thopoulos ( Ed.), High Temperature Capillarity, Slovak (1996) 205.
Academy of Sciences, 1994, p. 1. [56 ] C. Kaden, P. Ruggerone, J.P. Toennies, G. Zhang, G. [23] D.M. Duffy, J.H. Harding, A.M. Stoneham, Acta Metall. Benedek, Phys. Rev. B 46 (1992) 13 509.
Mater. 43 (1995) 1559. [57] R.W. Grimes, C.R.A. Catlow, A.M. Stoneham, J. Phys.: [24] J.H. Harding, A.H. Harker, A.L. Shluger, A.M. Stone- Condensed Matter 1 (1989) 7367.
ham, Acta Metall. Mater. 46 (1998) 2255. [58] J.-W. He, P.J. Møller, Chem. Phys. Lett. 129 (1986) 13. [25] D.M. Duffy, J.H. Harding, A.M. Stoneham, Acta Metall. [59] J.-W. He, P.J. Møller, Surf. Sci. 178 (1986) 934.
Mater. 44 (1996) 3293. [60] J.-W. He, P.J. Møller, Surf. Sci. 180 (1987) 934. [26 ] A. Trampert, E. Ernst, C.P. Flynn, H.F. Fischmeister, M. [61] I. Astrup, P.J. Møller, Appl. Surf. Sci. 33–34 (1988) 143.