Comparing Controlled Driving and Simulated Driving
Kenneth M. Bach, Mads G. Jæger, Mikael B. Skov and Nils G. Thomassen
Department of Computer Science, Aalborg University
Selma Lagerlöfs Vej 300, 9220 Aalborg East, Denmark
Phone +45 9940 9940, Fax +45 9940 9798
[email protected]
ABSTRACT
Emerging in-vehicle systems have turned the contemporary car into a human-computer interaction context that has its own set of rules and challenges. Interacting with in-vehicle systems while driving a car can greatly affect the driving performance and have been shown to be the cause of many road accidents. Evaluation of in-vehicle systems is a subject of much interest to developers and researchers. One of the major issues is how to evaluate; is there added value in taking your evaluation on the road or is simulated driving sufficient? This paper examines differences and similarities between taking in-vehicle systems to a track or to the laboratory by investigating the results (and costs associated) from two driving settings for in-vehicle systems evaluation; one on a test track and one using a lightweight driving simulator. Our results show that the two settings do seem to lead to a number of similar results. However, our results indicated that controlled driving yield more frequent and longer eye glances compared to simulated driving and driving errors were more common in simulated driving.
Categories and Subject Descriptors
H.5.2 [User Interfaces]: Interaction stylesGeneral Terms
Experimentation, Human Factors.
Keywords
In-vehicle Systems, IVS, evaluation, driving simulator, test track, evaluation method.
1. INTRODUCTION
With the increase of in-vehicle systems embedded in today’s vehicles, the driver is now exposed to systems such as adaptive cruise control, electronic stability programs and curve warning systems to name a few. In view of this development the vehicle industry has given room for new actors. Previously this market has been dominated by traditional automobile manufacturers but due to the development and demand, in-vehicle suppliers have entered the stage; companies that might not necessarily have any experience with developing systems to the driving context. These circumstances carry increased concern about the
potential adverse effect and raise questions about the impact on the vehicle safety making the need for evaluating in-vehicle systems higher than ever.
Research and traffic statistics have shown that driving while performing secondary tasks affects the driving performance and may very well result in accidents (e.g. [10, 14, 15, 17, 21, 22]). It is therefore important that the impact caused by the secondary task, manifested by for instance distraction related problems or direct perceptual overload, can be measured. This will allow the specific in-vehicle systems developer to make the systems better suited for driving by evaluating the system before putting it on the market.
Several studies examine opportunities and limitations of in-vehicle systems evaluation. Goodman et al. [8] consider simulated driving, controlled driving and real traffic driving in relation to realism and what impact (lack of) realism has on the results. On the matter of simulated driving they argue that results from this driving setting presumably is an artefact of the driving simulator’s ability to provide the same type or quality of visual information as that normally available to the driver. Moreover, the absence of motion removes the kinaesthetic cues that are present in real world driving. Furthermore, they argue that the most problematic issue is the driving simulator’s impact on the way the driver prioritises the primary and secondary tasks. Participants in a driving simulator may act differently than in real world driving because no serious consequences are associated with driving errors. This is less pronounced with controlled driving; though there are real consequences related to lack of vehicle control, the behaviour of a test track driver is still affected by the absence of other vehicles, pedestrians, cyclist, and a cluttered environment (traffic lights, signs, intersections etc.).
Goodman et al. [8] also discuss real traffic driving, i.e. driving on actual roads in actual traffic, and points out that real traffic driving in an experimental setting cannot be considered real world driving since participants are usually screened to have good driving records; participants are not instructed to get from one place to another as quickly as possible, and participants are aware that they are subjects to an experiment, and might even drive an unfamiliar vehicle with a stranger in the passenger seat. In a classification of the approaches to evaluate and measure attention [1], an overview of how driver attention has been measured in different driving settings (no driving, simulated driving, controlled driving and real traffic driving) is presented. One of our findings was that most attention related studies (82%) are undertaken using either simulated driving or real traffic driving with very few studies using controlled driving, e.g. taking the evaluation to a test track.
We consider controlled driving a valid alternative in evaluating in-vehicle systems and since the study indicated that controlled driving is not a common evaluation method, we find it interesting to compare simulated driving and controlled driving © The Author 2008.
in regards to their qualities as attention evaluation environments. Simulated driving can span from simple mock-ups that aim merely at inducing real driving attention requirements to high-fidelity driving simulators, see the simulators in [4, 5, 6]. However, most simulator evaluations are conducted in medium-fidelity simulators (with [18, 19, 24] being good examples) often comprised of a PC based simulation with steering wheel and pedals. While controlled driving encompasses several degrees of driving realism the key feature is the use of an actual vehicle that must be driven during the evaluations. What sets this apart form real traffic driving is that the evaluation takes place under controlled conditions, e.g. on a test track such as the one used in [12] and [11].
Again referring to our study [1], evaluating system induced mental and/or perceptual workload can be done in several ways, for instance by measuring the driving task performance, secondary task performance, eye glance activity or by using self assessment techniques. The results of such measurements in two different driving settings could help shed light on whether simulated driving represents an adequate driving setting for evaluations or if there is a missed potential/added value in taking the evaluation to the track.
This paper will examine the difference between measuring driver attention in a simulated driving evaluation versus a controlled driving evaluation.
2. THE EXPERIMENT
The experiment will consist of an evaluation of three different music players according to a set of appropriate measures that will be selected to represent the approaches taken in existing in-vehicle systems evaluations, see [1]. The experiment will compare the following two driving settings:
• Controlled Driving: A semi-realistic experiment on a test track.
• Simulated Driving: A medium-fidelity driving simulator situated in a HCI research laboratory. Though the two settings offer completely different levels of realism, they do not represent the extremes of either direction. As such, controlled driving should not be considered equal to real traffic driving as it takes place on a closed circuit in a controlled environment. The aim of the setup used was not to mimic real world driving, but to make sure that the evaluation took place in a moving vehicle that the participants needed to control. There are more realistic and therefore more complex setups that could be constructed to mimic a natural driving environment, but due to the very nature of experiments, a controlled setup will never be identical to the real deal. Comparing controlled driving with real traffic driving presents another interesting study possibility. However, there are legal and ethical concerns that inhibit us from doing so.
With regard to simulated driving, the intention was to create a lightweight medium-fidelity driving simulator. Much in-vehicle evaluation is done with the aids of driving simulators, and while several high end simulators exist, most are makeshift setups, that are constructed for the evaluation of a single system. The driving simulator in this study is therefore meant to be an easily accessible and scalable version of the simulated driving setting.
2.1 Music Players as Evaluation Subjects
Three different music players were selected as the evaluation subjects. They are dubbed based on individual characteristics and they each represent in-vehicle systems with differentproperties in terms of their perceptual demands and interaction techniques. A further description of the systems (and the interaction techniques they represent) can be found in [2]. CD Player: An off-the-shelf car stereo with CD functionality represents tactile interaction with in-vehicle systems. The exact car stereo model was selected due to its traditional looks and its conventional interface and layout.
Touch Player: A touch screen based system was developed to represent generic touch based interaction, since many contemporary vehicles are shipped with this kind of technology. As this system was developed specifically for the purpose of the experiment, it was designed to mimic a standard digital music player with basic functionality of the kind also found on a normal car stereo. A touch screen with a standard touch-to-push graphical user interface provided the interface for this system.
Gesture Player: A system was developed to serve as an experimental prototype for gesture based interaction. The same touch screen that provided the interface for touch interaction was used as a gesture canvas for the Gesture Player.
The make believe purpose for the evaluation was set to measure the quality of the three music players as in-vehicle systems. This means that the evaluation will include measures for both primary task performance (driving) and secondary task performance (interaction). In the following the two evaluations are presented
2.2 Controlled Driving
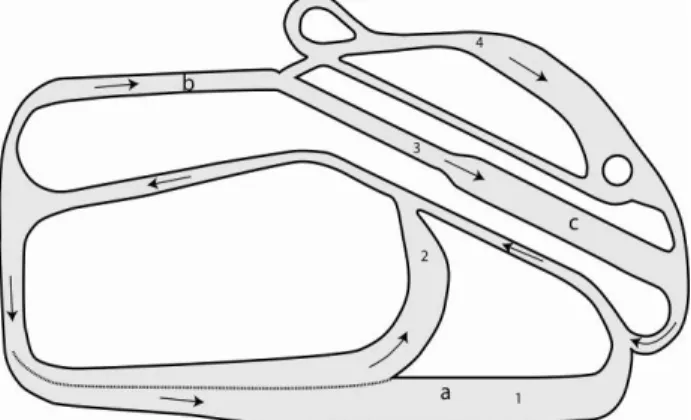
A test track evaluation at a technical driving facility in the greater Aalborg area was carried out to represent the controlled driving setting. The test track compound was made up by four smaller courses; all connected as shown on Figure 1 into a 3.2 km (~2.0 mi) circuit, which allowed for non-trivial driving. The whole circuit was designed to allow the participants to drive around with 50 km/h (~31 mph) on the straight sections. The complete circuit took approximately 4 minutes to drive at the speed limits used in the evaluation.
Figure 1. Overview of the test track. Numbers denote courses and arrows denote driving direction.
Course 1 contained a speed camera (a) which was used as a distraction element for the participants, as they were asked to get as close as they could to 60 km/h (~37 mph). Course 2 was a standard curve section with no additional traffic elements. Course 3 began with a low density slalom session (b) before coming across some traffic lights hovering above 3 lanes (c) as shown on Figure 2. These lights would change depending on the speed and position of the vehicle and the participants were asked to select whatever lane had the green light. Course 4 shared the slalom session (b) before the participant had to climb
a hill which had a slippery descent. All the courses ended at a joint strip of road known as the return lane. Though the facility offered several mechanisms for skid-control training these options were disabled during the evaluation. There were no other road users on the circuit and the evaluation was carried out under favourable weather conditions.
Figure 2. Participant negotiating traffic lights.
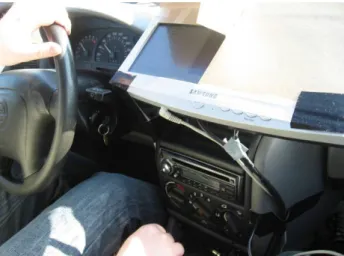
The vehicle used for the evaluation was a 3-door Opel (Vauxhall) Astra (see Figure 2) without power steering. The vehicle was fitted with the touch screen (for the Touch Player and Gesture Player) and the CD Player was swapped with the original radio. The CD Player was placed in the middle of the centre console and the touch screen was mounted on the top part of the same console. This setup is depicted on Figure 3. A laptop running the software for the two touch screen based music players was connected and placed out of harms way. Since the experiment took place over several hours a power inverter was connected to the car’s battery unit.
Figure 3. Vehicle setup with the Touch Player and Gesture Player running off a touch screen. The CD Player is placed
just below.
2.2.1 Participants
Eight participants took part in the test track evaluation. The participants were between 25 and 48 years of age (M=28.4, SD=8), with 7 male and one female participant. In the 8 participants selected for the test track study only one had never been at a similar facility while the other 7 had been to a similar facility while training for their driver’s license. The participants were in fair health including having normal or
corrected-to-normal visual acuity. In addition, they all had experience with a car stereo similar to the one featured in the evaluation. One participant had high experience with touch screen technology, while the rest used the term “minor experience” to describe their experience with touch screens. The participants all had valid drivers’ licenses (M=11 years, SD=4.4 years) and driving experience ranging from 100 km pr year to 20,000 km per year (M=5,314 km (~3,302 mi), SD= 4,843 km (~3,009 mi)).
2.2.2 Procedure
After each participant had been introduced to the circuit, a test manager would show him/her to the test vehicle and introduce the car itself as well as the music players that would be tested. The participant was then allowed to familiarize himself/herself with the circuit and the vehicle during a test run, where the test manager would also indicate the sequence of courses and give the participant driving instructions.
Driving around the circuit, the participant was asked by the test manager to solve 30 tasks for each of the three music players (such as adjusting the volume, skipping to the next track or finding a specific song on the 12 item playlist), totalling 90 tasks per participant. An interview served as a debriefing of the participants after the experiment. The interview was aimed towards both their use of the music players and their experience driving on the test track. The complete session took about 80 minutes in total per participant. The evaluation was counterbalanced across the interaction techniques (i.e. systems).
2.2.3 Data Collection
Multiple data collection methods were employed to capture different parts of the evaluation. Two video cameras captured the participant’s eyes and interaction. This allowed us to analyze their interaction and driving behaviour for different measures that could then be compared between the systems and ultimately between the two driving settings. The participant’s actions when using the Touch Player and Gesture Player was automatically logged on the laptop running the player software. In addition a GPS device was positioned in the car to provide information of the vehicle speed, as it was not possible to position additional cameras in the vehicle without blocking the participants’ line of sight. The GPS data combined with the laptop data log would also prove useful as a statistical analysis tool concerning the vehicle condition and position on the circuit for each interaction event. The test manager who sat beside the participant during the experiment logged different events such as driving incidents and comments made by the participant. From these data sources we were able to construct an event log for each participant, with timestamps for any event (e.g. gesture input, comments, vehicle position, driving events, task start, end time, etc.) to be analyzed according to different measures.
2.3 Simulated Driving
The second evaluation featured a driving simulator erected in the usability lab, Aalborg University. The laboratory consisted of a test room with an adjacent control and surveillance room and provided excellent conditions for evaluating usability and HCI in general. The driving simulator was created to provide a semi-realistic setting with the intention of creating a setup that resembled the one used for the track test evaluation. The simulation (Gran Turismo 3) was based on a PlayStation, which allowed us to select a circuit and vehicle that was similar to the ones used on the test track.
To enhance the driving sensation, a driver’s simulated forward field of view was projected onto a 2 by 2 metre canvas directly in front of the driver and car seats were positioned to allow for
a more realistic driving environment. A set of force feedback steering wheel and pedals were used to control the simulated vehicle. The touch screen (for the touch interaction and gesture interaction systems) and car stereo (representing tactile interaction) were placed in the same positions as in the controlled driving setting, see Figure 4.
For the simulated driving evaluation, the participants were told to drive between 50 and 70 km/h (~31-44 mph.) and to stay in the middle of the road, except for a straight and long section of the course, where they were told to try and stay at exactly 70 km/h (much like the speed camera section of the test track setup). The resulting driving simulator can be described as a medium-fidelity simulation of low intensity rural driving which we felt would require the same amount of concentration and resources as was needed to successfully drive in the test track evaluation.
Figure 4. Lightweight driving simulator setup with car seats and force feedback steering wheel and pedals.
2.3.1 Participants
Eight participants took place in the driving simulator evaluation. Their age ranged from 24 to 29 years (M=26, SD=1.7) and they were all male. In the 8 participants none had experience with driving simulators (6 indicated that they in some way had experience with steering wheel and pedals for computer games). All the participants had experience with the chosen driving simulator game making them experienced drivers. The participants stated that they were in fair health including having normal or corrected-to-normal visual acuity. In addition, they all had experience with a car stereo similar to the one featured in the evaluation, but used the term “minor experience” to describe their experience with touch screens. The participants all had valid drivers’ licenses (M=5.8 years, SD=3.2 years) and driving experience ranging from 100 km pr. year to 15,000 km per year (M=4,163 km (~2,587 mi), SD= 5,579 km (~3,467 mi)).
2.3.2 Procedure
Each participant was given a brief on the purpose of the evaluation and an introduction to the driving simulator setup and the laboratory. A test manager would then introduce the driving simulator and the participant was then allowed to familiarize himself/herself with the circuit and acclimatize to the steering wheel/pedal sensitivity during a test run, where the test manager gave the participant driving instructions such as the required speed.
The evaluation was counterbalanced across systems. Driving around the course, each participant was asked by the test manager to solve 30 tasks for each of the three music players (such adjusting the volume, skipping to the next track or finding a specific song on the 12 item playlist), totalling 90 tasks per participant.
Figure 5. Frame from the captured footage from the simulated driving: Participant driving the simulator while
using the Gesture Player.
2.3.3 Data Collection.
The data collection for the simulated driving evaluation was distributed over several sources. Video was recorded from a total of 4 cameras and fed to an editing device located in the control room, where the 4 feeds (driver’ field of view, the face of the participant, the interaction with the system and the steering wheel/system setup) were placed into one quad split recording, as seen on Figure 5.
The Touch Player and Gesture Player interaction was logged automatically on the laptop, which had been placed in the control room. This data was combined with test manager logs and to construct an event log for each participant, with timestamps for any event (e.g. gesture input, comments, driving events, task start and end time etc.). The event log was identical to the one constructed from the test track evaluation, except for the absence of GPS data. As with the test track evaluation, the participants were asked to submit to a short questionnaire concerning their experience with the systems used in the experiment, their driving experience and their experience with driving simulators. In addition, the participants were interviewed in a debriefing session after the evaluation. This involved asking the participants about their opinions and overall experience with each of the music players, the individual elements of the evaluation and any input they could offer concerning interaction with in-vehicle systems.
2.4 Data Analysis
We chose to integrate several parameters for the assessment of the interaction techniques. From a literature review on in-vehicle systems research, we identified and illustrated a number of relevant dependent measures for assessing the quality of the three interaction techniques and their effects on the driver and the driving [1]. The included measures were primary driving task performance, secondary driving task performance, and eye glance behaviour. Further, we measured subjective attitudes of the subjects towards the interaction techniques.
We measured primary driving task performance through lateral and longitudinal control errors (inspired by i.e. [14]). Lateral control incidents were defined as attention related loss of vehicle lateral control (lane excursions, steering wheel input, etc.) while longitudinal control errors denote incidents where subjects had problems controlling vehicle velocity (speed maintenance, acceleration, etc.). Lateral and longitudinal control errors were identified by reviewing video recordings and logs. Two authors of this paper both reviewed all 48 video recordings separately by identifying, classifying, and reporting incidents. Their lists of incidents were then compared and merged into one final incidents list. An inter-rate reliability test of this analysis (weighted Cohen’s Kappa) gave α=0.92. This equals an excellent agreement according to Fleiss et al. [7].
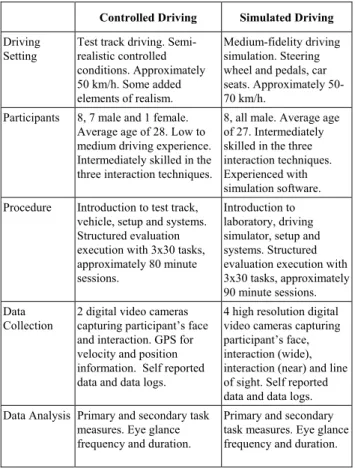
Table 1: Summarized characteristics of the two setups
Controlled Driving Simulated Driving
Driving Setting
Test track driving. Semi-realistic controlled conditions. Approximately 50 km/h. Some added elements of realism. Medium-fidelity driving simulation. Steering wheel and pedals, car seats. Approximately 50-70 km/h.
Participants 8, 7 male and 1 female. Average age of 28. Low to medium driving experience. Intermediately skilled in the three interaction techniques.
8, all male. Average age of 27. Intermediately skilled in the three interaction techniques. Experienced with simulation software. Procedure Introduction to test track,
vehicle, setup and systems. Structured evaluation execution with 3x30 tasks, approximately 80 minute sessions.
Introduction to laboratory, driving simulator, setup and systems. Structured evaluation execution with 3x30 tasks, approximately 90 minute sessions. Data
Collection
2 digital video cameras capturing participant’s face and interaction. GPS for velocity and position information. Self reported data and data logs.
4 high resolution digital video cameras capturing participant’s face, interaction (wide), interaction (near) and line of sight. Self reported data and data logs. Data Analysis Primary and secondary task
measures. Eye glance frequency and duration.
Primary and secondary task measures. Eye glance frequency and duration.
We adapted secondary driving task performances to include task effectiveness (task completion and interaction errors) and task efficiency (total task completion time). Task effectiveness is a common measure when conducting in-vehicle research (i.e. [14, 15]) as well as efficiency (i.e. [22]). Interaction errors were identified from the video recordings based on different criteria due to the nature of the systems representing each interaction technique. For the tactile interaction technique, interaction errors were defined as unsuccessful attempts to press a specific button or selecting a wrong control for the assignment (e.g. using the volume control when asked to skip one track forward). For the touch and gesture interaction techniques, interaction errors were automatically logged when touching any button part of the surface (touch) or producing a non-recognized gesture (gesture). The task completion times for touch and gesture interaction were measured through the data log entries of the sessions as the laptop running the two players also logged task data. As tactile interaction offered no such data, it was necessary to manually measure task completion
times through video analysis. Two authors reviewed all 48 video recordings independently measuring the task completion times for all 1440 assignments. Due to the nature of this data, no inter-rate reliability tests were conducted, but an average was calculated from the list of the two authors. To get the total task completion times (including the time it took for participants to move their hand to and from the system), a constant was added to the values from the interaction log. The constant was calculated using a stopwatch on a sample of 20 assignments for both systems and was set to 660 milliseconds. Eye glance is probably the most common predicator of driver attention and is an accepted measure for in-vehicle system evaluations as the link between visual attention and driving performance. We divided eye glances into three categories according to their duration (less than 0.5 seconds, 0.5-2.0 seconds and above 2.0 seconds). These categories are motivated in the following. Eye fixations (when the eyes dwell on something) are typically glances over 0.5 seconds and can be used as an indication of what a driver is attentive towards. This defines the boundary between two categories; below and above the eye fixation time of 0.5 seconds. Also, research suggests that drivers are very reluctant to continue without roadway information for more than 2 seconds also known as the “2-second rule”. This defines the boundary between two others categories; eye glances of more than 2 seconds. We classified eye glances according to whether they were below 0.5 seconds, between 0.5-2.0 seconds, or above 2.0 seconds using video analysis. Two authors independently classified eye glances in the 48 video recordings. Their classification were then compared and an inter-rate reliability test (weighted Cohen’s Kappa) showed α=0.71 suggesting substantial agreement according to Fleiss et al. [7]. Due to the number of disagreements, a third author would review all incidents (where the two authors disagreed) and classify them according to the categories.
The questionnaire included questions on the subjective preferences towards the interaction techniques. We used a 5-point scale on perceived workload, concurrent driving performance, and ease of use. Their answers served as input for the subsequent interview sessions.
3. RESULTS
Three in-vehicle music players were evaluated in each of the two driving settings. The results from these evaluations are based on the set of measures presented above. Tables 2 through 6 present averages for each measure. Standard deviation will be given in parentheses. A plus denotes a significant difference at a 5% significance level within the values of a given column, while values marked with bold face indicate a significant difference between the values from controlled driving and simulated driving.
Table 2: Total task completion time in seconds.
Controlled Driving (N=8) Simulated Driving (N=8) CD Player 166.63 (22.52) - 158.33 (27.79) - Touch Player 85.65 (24.32) + 81.36 (12.26) + Gesture Player 148.98 (42.99) - 136.64 (4.85) - Total 133.75 (46.46) 125.44 (37.20) The participants’ average total task completion time for each of the two driving settings are presented in Table 2 and reveal significant differences between the music players, but this
difference is present in both result sets. Controlled driving had an average total task completion time of 134 seconds compared to 125 seconds for the driving simulator. The overall task completion time is 9% lower for the driving simulator, but this difference is not statistically significant (T=0.68, p>0.49). It is however interesting that the driving simulator yielded lower task completion times for all the music players. This can be partly explained by the fact that the test track participants had more instances where they were forced to use both their hands to control the car (shifting gears, using two hands on the steering wheel, etc.). The standard deviation for the Gesture Player reveals that the controlled driving varied much more in task completion time compared to simulated driving. This is particularly due to one test track participant having difficulties using the Gesture Player (removing this participant sets the Gesture Player at M=136.63, SD=27.08). Overall, task completion times in the two driving settings are similar with a tendency towards higher internal differences in controlled driving.
Table 3 lists the eye glance distribution over music players for each driving setting. Controlled driving led to an average of 58.17 eye glances for each participant to complete the set of 30 assignments for each system, while simulated driving led to an average of 52.54 eye glances. Running a t-test on these results yielded no significant difference between the two evaluations (T=0.75, p>0.45). However, we found a statistical significance on the average of eye glances for the Gesture Player between the driving settings; in controlled driving we identified an average of 45.38 eye glances per participant, compared to an average of 19.13 identified eye glances for the Gesture Player sessions which is statistically significant (T=2.83, p<0.014).
Table 3: Average eye glance distributed over the three music players. Controlled Driving (N=8) Simulated Driving (N=8) CD Player 69.88 (18.86) 70.13 (20.10) - Touch Player 59.25 (17.38) 68.38 (19.26) - Gesture Player 45.38 (22.30) 19.13 (13.86) + Total 58.17 (21.37) 52.54 (29.62) It is interesting why two of the music players have the same number of eye glances in both settings while the Gesture Player required more than twice as many eye glances in the controlled driving. Cross referencing with the amount of interaction errors for the Gesture Player in each driving setting reveals that it is not a higher number of errors that have led to the higher number of eye glances on the test track, see Table 3. Actually, there were more interaction errors for the Gesture Player in simulated driving (another way to look at it is that using fewer eye glances with the Gesture Player in the driving simulator could be the reason for the higher error rate).
Taking a closer look at the eye glance distribution we find that the two driving settings have similar distributions for each eye glance category. The different types of eye glances are listed for each evaluation in Table 4. We find no statistical difference between the total number of type 1 eye glances (T=1.02, p>0.31) from each driving setting, nor does t-testing reveal a statistical significance in the distribution of type 2 eye glances for each driving setting (T=0.05, p>0.96).
Table 4: Eye glances distributed over eye glance type.
Controlled Driving (N=8) Simulated Driving (N=8) Type 1: < 0.5 sec. 8.83 (13.15) 5.88 (5.47) Type 2: 0.5 – 2.0 sec. 45.25 (21.32) 45.63 (29.73) Type 3: > 2.0 sec. 4.08 (4.46) 1.04 (1.46)
However, there is a statistically significant difference in the distribution of type 3 eye glances over the two driving settings (T=3.17, p<0.003) with almost 4 times as many type 3 eye glances in controlled driving. The significant difference in type 3 eye glances between controlled driving and simulated driving is particularly caused by the values for the Touch Player (not shown) which yielded more than 5 times as many type 3 eye glances in controlled driving. The other two music players did not produce significantly different numbers in the two driving settings and the Gesture Player yielded no type 3 eye glances at all in either evaluation.
The number of interaction errors for each music player for the two driving settings are shown in Table 5. As we can see, participants in the driving simulator made more errors than participants on the test track but a t-test revealed no significant difference when looking at the total amount (T=1.09, p>0.28). However, there is a statistically significant difference in the number of interaction errors made in each driving setting when focusing only on the Gesture Player (T=2.23, p<0.05).
Table 5: Interaction errors.
Controlled Driving (N=8) Simulated Driving (N=8) CD Player 4.25 (3.15) 3.50 (2.27) Touch Player 3.00 (4.14) 4.25 (5.50) Gesture Player 2.50 (2.62) 5.25 (2.31) Total 3.25 (3.30) 4.33 (3.60) This means that participants in the driving simulator made significantly more interaction errors (i.e. invalid gestures) using the Gesture Player than participants in controlled driving (42 vs. 20). Because of the impact of G-force and vibration, the test track vehicle presented a challenging environment for gesture-based interaction. Hence, it is interesting that participants in controlled driving made less errors compared to the driving simulator participants.
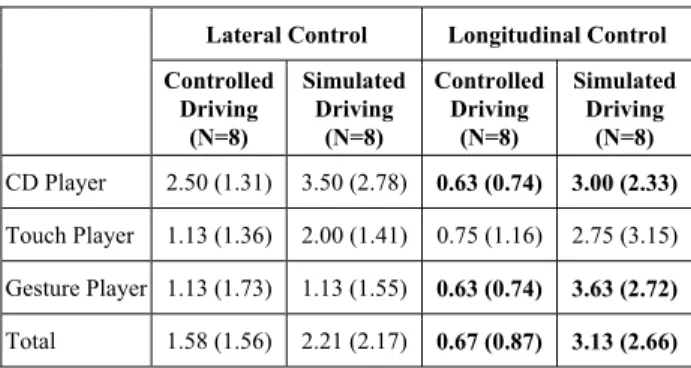
Attention related driving errors are listed in Table 6, divided into episodes concerning incidents of lateral and longitudinal control. Even though participants in simulated driving suffered more from loss of lateral control, the two driving settings were similarly challenging on this point and a t-test showed no significant difference between the driving settings on the matter of lateral control (T=1.15, p>0.25). However, the t-test for longitudinal control incidents revealed a very significant difference between the driving settings (T=4.31, p<0.001).
Table 6: Breakdown of lateral and longitudinal control incidents.
Lateral Control Longitudinal Control
Controlled Driving (N=8) Simulated Driving (N=8) Controlled Driving (N=8) Simulated Driving (N=8) CD Player 2.50 (1.31) 3.50 (2.78) 0.63 (0.74) 3.00 (2.33) Touch Player 1.13 (1.36) 2.00 (1.41) 0.75 (1.16) 2.75 (3.15) Gesture Player 1.13 (1.73) 1.13 (1.55) 0.63 (0.74) 3.63 (2.72) Total 1.58 (1.56) 2.21 (2.17) 0.67 (0.87) 3.13 (2.66)
The participants had an average of 0.67 longitudinal control errors in controlled driving and 3.13 longitudinal control errors in simulated driving. At first sight, it is striking that the participants in the driving simulator had such difficulties with longitudinal control of the vehicle. Some participants commented that the feedback from real world driving (e.g. G-force, steepness of driving, engine and wind noise) was not present to help determine the driving speed in the simulator. The vehicle in the driving simulation tended to lose speed more easily than the test track vehicle, which may in part explain the difference. Also, the variation in speed were more pronounced in the driving simulator making detection of longitudinal control incidents easier here than in the controlled driving setting.
3.1 Comparison of Cost and Effort
As the test track evaluation required renting a track (which may in addition require a supervisor to be present and possibly also insurance), and a vehicle for the evaluation, there were greater economical expenses associated with this evaluation compared to evaluation in the driving simulator. Setting up a driving simulator also has expenses but in our case simulated driving ended up costing less than controlled driving. This is partly due to having access to the laboratory where we carried out the driving simulation evaluation. This will naturally not always be the case, but based on the expenses associated with the evaluations in this study a simulated driving evaluation will be less costly compared to a controlled driving evaluation. Investigating log entries for time used on the two evaluations reveals a relationship that is similar to that of economy. Where the test track evaluation was troublesome and time consuming in terms of planning, scenario setup and test execution, the driving simulator evaluation was less demanding. Our estimates put the total time used on preparing and executing the test track evaluation at 104 hours compared to 50 for the driving simulator evaluation. Analyzing the data from controlled driving was also more demanding due to lower video quality and data logs that were inferior to the data collected in simulated driving. Comparing the time used on analysis on each data set yields 112 hours for the simulated driving and 181 for controlled driving. This puts the total hour count for controlled driving at 285 against 162 for the driving simulator.
4. DISCUSSION
The results presented above reveal that the two driving settings overall yielded similar results. However, though minor differences should be expected (and generally appear throughout the results), there were in addition some results that proved statistically significant. Long duration eye glances (type 3) were four times as common in controlled driving as in the driving simulator. In other words, the participants on the test track were much more likely to use long duration eye glances when solving tasks, suggesting that they were more in control of the situation than the participants in simulated driving. Moreover, the Gesture Player forced significantly more interaction errors in the driving simulator than on the test track and participants in simulated driving suffered more from lack of longitudinal control. With regard to the latter aspect, this is also found by Green [9] who states that variations of 8 km/hr (~5 mi/hr) are not unusual in controlled driving, and when distracted while in simulated driving, it is not unusual that variations of 16 km/hr (~10 mi/hr) occur. These findings suggest that simulated driving was more demanding to the participants. Hence, participants in the driving simulator focused intensively on their driving performance and
concentrated on keeping the right speed. Our impression was that the participants aspired significantly more to the driving performance in the driving simulator than in controlled driving. They allowed only the resources not needed for driving to complete the assignments and often waited till the circumstances were more forgiving (i.e. not while turning, braking, etc.).
4.1 The Importance of Simulator Fidelity
Stanton [20] identified two domain independent issues that apply to creating realism in driving settings: Physical fidelity, the degree to which the simulated environment looks like the real environment and functional fidelity, the degree to which the simulated environment behaves like the real environment. Physical fidelity may help convince the participants that the task should be taken seriously which would be less convincing in a more abstract environment. The medium-fidelity driving simulator in this experiment succeeds in this matter as the simulator used high resolution contextual textures such as road, curbs, trees, sky, scenery as well as advanced lighting effects. In regard to the functional fidelity, our lightweight driving simulator has some limitations and two major differences between driving a vehicle in controlled driving and driving a vehicle in simulated driving are identified; lack of spatial-visual feedback and lack of sensory feedback from motion. The importance of these parameters became apparent when the participants engaged in secondary task interaction. The participants in the driving simulator indicated that it was difficult to control the vehicle and that they did not feel comfortable looking away from the road. This was not the case with participants on the test track who felt more comfortable taking their eyes off the road. The fact that controlled driving yielded four times as many type 3 eye glances testify to this relationship.Driving on the test track provided feedback for the participants from numerous channels; the forward field of view was supported by peripheral views, wind, tire and engine noise gave away the speed of the vehicle just as the participants relied on tactile sensations in the pedals, gear lever and steering wheel. This was very helpful for the subjects when looking away to interact with the systems. The simulator drivers were not able to draw on this sensory feedback, as it was (for the most part) non-existent. Though the simulator used in this experiment offered some audio and tactile feedback, it is difficult to rely on it for driving guidance, and the eyes become even more necessary than when driving a real vehicle. The field of view in driving simulators is also somewhat narrow (approximately 70 degrees in the simulator used in this experiment), and the participants could only receive visual input from the projected image. This could be the cause of the problems controlling the vehicle velocity in the driving simulator, since the only way to perceive the driving speed was to visually check the the speedometer or passing scenery.
The participants in controlled driving all agreed that test track driving could not be considered real world driving. Driving under controlled conditions on a test track without other independent agents offered an environment that was both predictable and unnatural. According to the participants, realistic driving would be much more feasible if the test track offered unpredictability (autonomous agents), no route restrictions, and the need to adhere to relevant traffic laws. We find it interesting that the realism requirements demanded by the simulator drivers were offered by the test track evaluation (which was conducted first and therefore not based on these comments). In addition, taking an evaluation to a test track
would not reach a degree of realism in the eyes of the participants. It also implies that though a driving simulation should mimic real world circumstances, there are more basic requirements (negotiating a physical vehicle, being able to rely on sensory feedback) that should be attended to.
We believe that the key to creating realistic simulator driving is to allow the participant to enter the role of a driver by a) creating a challenging and unpredictable environment that b) allows the participant to engage the simulation as a real driving task while c) providing the participant with an adequate amount of true-to-life sensory feedback form multiple perceptual channels.
4.2 Limitations
With the aim of comparing track evaluations with simulator evaluation, we have opted to go with easily executable versions of the controlled and simulated driving settings. This presents some limitations in our research.
For practical reasons, we carried out the two evaluations sequentially starting with the test track evaluation. This meant we were somewhat better prepared when faced with the driving simulator evaluation, since many teething troubles were handled in planning and preparation of the test track evaluation. This may have resulted in more experienced test management in the second evaluation just as the evaluation itself was conducted more professionally. Also, we were only able to include eight subjects in each condition – a relatively low number of subjects even though more findings proved significant.
The comparison of the two driving settings could be augmented by adding a real traffic driving evaluation as this could be considered the “answer book” when comparing realism in different setups. There are three main reasons why we chose not to go with real traffic driving for any of the experiments. Firstly, conducting experiments in real traffic driving raises some ethical issues, which are even more decisive when we are dealing with experiments including induced driver distraction. Secondly, ensuring replicable and identical settings for all evaluation sessions is difficult and thirdly, we are of the opinion that conducting an experiment in real traffic driving would not produce participant behaviour or results that should be considered representative of real life usage of for instance a specific in-vehicle system. There are several reasons for this, most of which have root in the limitations of experiments: a) participants have been selected and do not represent the diversity of a real life population, b) experiments are controlled in numerous ways, i.e. time of day, driving route etc., c) participants are instructed, i.e. drive to this location, drive this way, etc., d) participant is placed in unfamiliar vehicle, possibly equipped with different apparatus and a test manager, e) participants are being evaluated and will therefore act differently than in an everyday situation. These limitations do of course also apply to other driving settings like the ones we have used in our experiments, but they do imply that incorporating a real traffic driving experiment is no guarantee for data that has not been contaminated in certain ways.
5. CONCLUSION
This paper investigates the difference between evaluating in-vehicle systems under two different driving settings; controlled driving represented by a test track and simulated driving represented by a medium-fidelity driving simulator. This is accomplished by comparing results and costs associated from analysis of a set of attention related measures.
The two settings yielded similar but not identical results, indicating that the two driving settings cannot have presented identical evaluation conditions. This implies that whether to use simulated or controlled driving is not an arbitrary matter, though looking over the numbers, the two approaches do seem to lead to somewhat similar results. However, key results indicate that controlled driving yielded more frequent and longer eye glances than the simulated driving setting, while driving errors were more common in simulated driving. The driving simulator worked well for this experiment offering a convenient and at some point sufficient approach to in-vehicle systems evaluation. That being said, the driving simulation does not bear direct comparison with real world driving (neither does controlled driving), mostly due to lack of realistic feedback (which was present at the test track).
The experiment showed that, generally speaking, it is more difficult to maintain proper driving perception in simulated driving, due to lack of sensory feedback from the vehicle and context. This emphasizes the driver’s need to keep his eyes on the road, creating an interaction situation that differs from that of real world driving. Conducting a controlled driving evaluation on a test track offered a higher level of realism but required a significantly more demanding setup in terms of both planning, execution and the ensuing data analysis.
ACKNOWLEDGEMENTS
The work behind this paper received financial support from the Danish Research Agency (grants no. 2106-04-0022 and 274-07-0157). We thank all the participating test subjects. We would also like to thank Bang & Olufsen for the collaboration especially Jannie Friis Kristensen. Finally, we want to thank several anonymous reviewers for comments on drafts of this paper.
REFERENCES
[1] Bach, K. M., Jæger, M. G. and Thomassen, N. G. (2007). In-Vehicle Systems Research: A Classification of Approaches to Understand, Measure and Evaluate Attention. Aalborg University
[2] Bach, K. M., Jæger, M. G., Skov, M. B., and Thomassen, N. G. (2008). You can Touch, but You can't Look: Interacting with In-Vehicle Systems. Proceedings of the Human Factors in Computing Systems (CHI’08), Florence, Italy, ACM Press, pp. 1139-1148
[3] Baumanna, M., Keinatha, A., Kremsa, J. F. and Bengler, K. (2004). Evaluation of In-Vehicle HMI Using Occlusion Techniques: Experimental Results and Practical
Implications in Applied Ergonomics, Vol. 35, Page 197. Department of Psychology, Chemnitz University of Technology.
[4] Cnossen, F., Meijman, T. and Rothengatter, T. (2004). Adaptive Strategy Changes as a Function of Task Demands: A Study of Car Drivers in Ergonomics, Vol. 47, No. 2, Pages 218-236. Taylor & Francis Group.
[5] Donmez, B., Boyle, L. Ng, Lee, J. D. and McGehee, D. V. (2006). Drivers Attitudes Toward Imperfect Distraction Mitigation Strategies in Transportation Research Part F: Traffic Psychology and Behaviour, Vol. 9, Issue 6 , Pages 387-398. Elsevier Ltd.
[6] Drews, F. A., Pasupathi, M. and Strayer, D. L. (2004). Passenger and Cell-Phone Conversations in Simulated Driving in Proceedings of the Human Factors and Ergonomics Society 48th Annual Meeting, Pages 2210-2212. Department of Psychology, University of Utah .
[7] Fleiss, J. L., Levin, B. and Paik, M. Cho (2003). Statistical methods for rates and proportions, 3rd ed.. New York, John Wiley.
[8] Goodman, M., Bents, F. D., Tijerina, L., Wierville, W., Lerner, N. and Benel, D. (1998). A Review of Human Factors Studies on Cellular Telephone Use While Driving in An investigation of the safety implications of wireless communications in vehicles. Available online at
[http://www.nhtsa.dot.gov/people/injury/research/wireless/ c5.htm] (Accessed 6th June 2007).
[9] Green, P. (2005). How Driving Simulator Data Quality Can Be Improved in Driving Simulation Conference North America, Orlando, Florida. University of Michigan Transportation Research Institute (UMTRI).
[10] Green, P. (2000). Crashes Induced by Driver Information Systems and What Can Be Done to Reduce Them in
Society of Automotive Engineers. University of Michigan Transportation Research Institue (UMTRI).
[11] Hancock, P. A., Simmons, L., Hashemi, L., Howarth, H. and Ranney, T. (1999). The Effects of In-Vehicle Distraction on Driver Response During a Crucial Driving Maneuver in Transportation Human Factors, Pages 295 - 309. Lawrence Earlbaum Associates, Inc.
[12] Hancock, P., Lesch, M. and Simmons, L. (2003). The Distraction Effects of Phone Use During a Crucial Driving Maneuver in Accident Analysis and Prevention, Vol. 35, Pages 501-514. Elsevier Science Ltd.
[13] Klauer, S. G., Dingus, T. A., Neale, V. L. and Sudweeks, J. D. (2006). The Impact of Driver Inattention on Near-Crash/Crash Risk: An Analysis Using the 100-Car Naturalistic Driving Study Data.
[14] Lansdown, T. C., Brook-Carter, N. and Kersloot, T. (2004). Distraction from Multiple In-Vehicle Secondary Tasks: Vehicle Performance and Mental Workload Implications in Ergonomics, Vol. 47, No. 1, Pages 91–104. Taylor & Francis Group.
[15] Lansdown, T. C., Brook-Carter, N. and Kersloot, T. (2002). Primary Task Disruption from Multiple In-Vehicle Systems in ITS Journal, Vol. 7, Pages 151-168 . Taylor & Francis Group.
[16] Liu, Y. (2001). Comparative Study of the Effects of Auditory, Visual and Multimodality Displays on Drivers in Ergonomics, 2001, Vol. 44, No. 4, Pages 425-442. Taylor & Francis Ltd.
[17] McKnight, A. James and McKnight, A. Scott (1993). The Effect of Cellular Phone Use Upon Driver Attention in
Accident Analysis & Prevention, Vol. 25, Issue 3 , Pages 259-265 . Elsevier Science Ltd.
[18] Recarte, M. A. and Nunes, L. M. (2003). Mental Workload While Driving: Effects on Visual Search, Discrimination, and Decision Making in Journal of Experimental Psychology, Vol. 9, No. 2, Pages 119-137. American Psychological Association, Inc.
[19] Schneider, M. and Kiesler, S. (2005). In-Vehicle Interfaces: Calling While Driving: Effects of Providing Remote Traffic Context in CHI 2005, April, Pages 561-569. Human-Computer Interaction Institute and School of Design, Carnegie Mellon University.
[20] Stanton, N. (1996). Simulators: research and practice in
Nuclear Safety. Taylor & Francis.
[21] Strayer, D. L., Drews, F. A. and Crouch, D. J. (2006). A Comparison of the Cell Phone Driver and the Drunk Driver in Human Factors, Vol. 48, No. 2, Pages 381-391. Human Factors and Ergonomics Society.
[22] Tsimhoni, O. and Green, P. (2001). Visual Demand of Driving and the Execution of Display-Intensive, In-Vehicle Tasks in Proceedings of the Human Factors and Ergonomics Society 45th Annual Meeting 2001. [23] Tsimhoni, O., Yoo, H. and Green, P. (1999). Effects of
Visual Demand and In-Vehicle Task Complexity on Driving and Task Performance as Assessed by Visual Occlusion. University of Michigan Transportation Research Institue (UMTRI).
[24] Uang, S. and Hwang, S. (2003). Effects on Driving Behavior of Congestion Information and of Scale of In-Vehicle Navigation Systems in Transportation Research Part C, Vol. 11, Pages 423-438. Elsevier Ltd