Energy Efficient Distributed Processing
for IoT
Barzan Abdulla Yosuf
University of Leeds
School of Electronic and Electrical Engineering
Submitted in accordance with the requirements for the degree of
Doctor of Philosophy
i
Intellectual Property Statement
The candidate confirms that the work submitted is his/her own, except where work which has formed part of jointly-authored publications has been included. The contribution of the candidate and the other authors to this work has been explicitly indicated below. The candidate confirms that appropriate credit has been given within the thesis where reference has been made to the work of others.
The work in Chapter 4 has appeared or will partially appear in publications as follows:
B. Yosuf, M. Musa, T. Elgorashi, A. Q. Lawey and J. M. H. Elmirghani, "Energy Efficient Service Distribution in Internet of Things," 2018 20th International Conference on Transparent Optical Networks (ICTON), Bucharest, 2018, pp. 1-4.
The candidate developed the energy efficient resource distribution model and using it to improve the end to end energy efficiency of IoT based service, considering heterogeneous layers of processing.
M. Musa and T. Elgorashi reviewed and validated findings throughout the work.
A. Q. Lawey supported in early design and development of the model. Professor Elmirghani reviewed the paper and helped with the flow of content and suggested the review scope.
B. A. Yosuf, M. Musa, T. Elgorashi and J. M. H. Elmirghani, "Impact of Distributed Processing on Power Consumption for IoT Based Surveillance Applications," 2019 21st International Conference on Transparent Optical Networks (ICTON), Angers, France, 2019, pp. 1-5.
The candidate extended on the previously published idea and considered the prospect of service splitting on reducing energy efficiency of distributed processing for resource intensive applications.
M. Musa and T. Elgorashi reviewed and validated findings throughout the work.
A. Q. Lawey supported in early design and development of the model. Professor Elmirghani reviewed the paper and helped with the flow of content and suggested the review scope.
The right of Barzan Abdulla Yosuf to be identified as Author of this work has been asserted by his in accordance with the Copyright, Designs and Patents Act 1988.
Acknowledgements
First and foremost, all praise is due to Allah, for His countless blessings and endless gifts He has bestowed upon me. I invoke peace and blessings on His messenger Mohammad 1, for which he said: “ He who does not thank the people is not thankful to Allah”.2 I wish to acknowledge my supervisor, Professor Jaafar Elmirghani for his leadership, guidance and patience throughout my entire PhD journey. His continued and constant encouragement is much appreciated. I would also like to show my deepest gratitude to Dr Taisir and Dr Mohammad Musa for their continued support daily, their support and guidance have helped me achieve my goals successfully.
I wish to show my thanks to my wife, Ala, for her unconditional love and sacrifice during some of the most challenging moments in my PhD. Thank you for supporting me to achieve my goals. I wish to thank my parents and the coolness of my eyes, my siblings Rosie, Bahra, Arazu, Mohammad and Barham. You all mean everything good to me in this life. I love you all so much. I wish to thank my mum for keeping me in her prayers and my dad for his constant support throughout my PhD journey. I pray to Allah for their good health and wellbeing.
I would also like to thank my colleagues Sana, Amal, Ida, Randa, Hatam, Osama, Abdulla, Mohammad Hadi, Opeyemi. I enjoyed sharing the same office with them and I thank them for their company and fruitful discussions.
1 The Arabic phrase which translates as “peace be upon him”.
Abstract
The number of connected objects in the Internet of Things (IoT) is growing exponentially. IoT devices are expected to number between 26 billion to 50 billion devices by 2020 and this figure can grow even further due to the production of miniaturised portable devices that are lightweight, energy and cost efficient together with the widespread use of the Internet and the added value organisations and individuals can gain from IoT devices, if their data is processed. These connected objects are expected to be used in multitudes of applications, of which, some are, highly resource intensive such as visual processing services for surveillance based object recognition applications. The sensed data requires processing by the cloud in order to extract knowledge and make decisions accordingly. Given the pervasiveness of future IoT-based visual processing applications, massive amounts of data will be collected due to the nature of multimedia files. Transporting all that collected data to the cloud at the core of the network, is prohibitively costly, in terms of energy consumption.
Hence, to tackle the aforementioned challenges, distributed processing is proposed by academia and industry to make use of a large number of devices located in the edge of the network to process some or all of the data before it gets to the cloud. Due to the heterogeneity of the devices in the edge of the network, it is crucial to develop energy efficient models that take care of resource provisioning optimally. The focus in today’s network design and development has shifted towards energy efficiency, due to the rising cost of electricity, resource scarcity and increasing emission of carbon dioxide (CO2).
This thesis addresses some of the challenges associated with service placement in a distributed architecture such as the fog. First, a Passive Optical Network (PON) is used to connect IoT devices and to support the fog infrastructure. A metro network is also used to connect to the fog and aggregate traffic from the PON towards the core network. An IP/WDM backbone network is considered to model the core layer and to interconnect the cloud data centres. The entire network was modelled and optimised through Mixed Integer Linear Programming (MILP) and the total end to end power consumption was jointly minimised for processing and networking. Two aspects of service placements were examined: 1) non-splitable services, and 2) splitable services. The results obtained showed that, in the capacitated problem, service splitting introduced power consumption savings of up to 86% compared to 46% with non-splitable services. Moreover, an energy efficient special purposed data centre (SP-DC) was deployed in addition to its general purpose counterpart (GP-DC). The results showed that, for very high demands, power savings of up to 50% could be achieved compared to 30% without SP-DC.
The performance of the proposed architecture was further examined by considering additional dimensions to the problem of service placements such as resiliency dimension in terms of 1+1 server protection, in the long term network design problem (un-capacitated) and the impact of inter-service synchronisation overhead on the total number service splits per task.
Table of Contents
Acknowledgements ... iii Abstract ... iv Table of Contents ... vi List of Tables ... ix List of Figures ... xList of Abbreviations ... xiii
Chapter 1 Introduction ... 1 1.1Motivation ... 1 1.2 Problem Statement... 3 1.3 Research Objectives ... 4 1.4Thesis Contributions ... 5 1.5 Related Publications... 6 1.6 Thesis Organisation ... 7
Chapter 2 Background Review of Internet of Things (IoT) ... 9
2.1 Introduction ... 9
2.2 Reference IoT Architecture ... 10
2.3 Enabling Technologies ... 13
2.4 IoT Service Types ... 17
2.5 IoT Applications ... 18
2.6 Challenges ... 21
2.7 Summary ... 24
Chapter 3 Distributed Processing and Related Works ... 25
3.1 Introduction ... 25
3.2 Related Work ... 28
3.3 Summary ... 35
Chapter 4 Energy Efficient Distributed Processing with Non-Splittable IoT Services 36 4.1 Introduction ... 36
4.2 Case Study ... 36
4.3 The Proposed Distributed Processing Architecture ... 38
4.4 MILP Model for Energy Efficient Distributed Processing with Non-Splittable IoT Services ... 43
4.4.1 Network Power Consumption ... 54
4.4.3 Power Consumption of Network inside Processing
Nodes ... 57
4.5 Input Data for the MILP Model ... 67
4.5.1Workload Intensity Definition ... 68
4.5.2Equipment Idle Power Consumption Attributed to IoT Application... 69
4.5.3 Power Usage Effectiveness (PUE) ... 70
4.6 Power Consumption Evaluation ... 75
4.7 Un-Capacitated Design Problem with GP-DCs Only ... 76
4.7.1 Scenario #1: A single active IoT ... 77
4.7.2 Scenario #2: Five active IoTs in the same group ... 78
4.7.3 Scenario #3: Four active IoTs, one per group ... 80
4.7.4 Scenario #4: Twenty active IoTs ... 81
4.8 Capacitated Design Problem with GP-DCs ... 83
4.8.1 Scenario #1: A Single active IoT ... 83
4.8.2 Scenario #2: Five active IoTs in the same group ... 85
4.8.3 Scenario #3: Four active IoTs, one per group ... 86
4.8.4 Scenario #4: Twenty active IoTs ... 87
4.9 Impact of SP-DC in all Cases ... 89
4.10 MILP Model Verification ... 90
4.11 Summary ... 93
Chapter 5 Energy Efficient Distributed Processing for IoT with Service Splitting ... 95
5.1 Introduction ... 95
5.2 Modification to the MILP Model ... 96
5.3 Power Consumption Evaluation ... 97
5.4 Un-Capacitated Design Problem with GP-DCs Only ... 97
5.4.1 Scenario #1: A single Active IoT ... 97
5.4.2 Scenario #2: Five active IoTs in the same group ... 99
5.4.3 Scenario #3: Four active IoTs, one per group ... 101
5.4.4 Scenario #4: Twenty active IoTs ... 102
5.5 Capacitated Design Problem with GP-DCs Only ... 104
5.5.1 Scenario #1: A single active IoT ... 104
5.5.2 Scenario #2: Five active IoTs in the same group ... 105
5.5.3 Scenario #3: Four active IoTs, one per group ... 107
5.6 Impact of SP-DC in Un/Capaciated Design ... 109
5.7 Inter-Service Synchronisation Processing Overhead ... 110
5.7.1 Scenario #1: A single active IoT ... 115
5.7.2 Scenario #2: Five active IoTs in the same group ... 117
5.7.3 Scenario #3: Four active IoTs, one per group ... 119
5.8 Summary ... 121
Chapter 6 Resilient IoT Processing ... 123
6.1 Introduction ... 123
6.2 Modification to the MILP Model ... 125
6.2.1Network Power Consumption ... 127
6.2.2 Processing Power Consumption ... 130
6.2.3 Power Consumption of Network inside Processing Nodes ... 131
6.3 Power Consumption Evaluation Using MILP ... 144
6.3.1Scenario #1: A single Active IoT ... 146
6.3.2Scenario #2: Five active IoTs in the same group ... 148
6.3.3 Scenario #3: Three active IoTs, one per group ... 149
6.3.4 Scenario #4: Twenty active IoTs ... 151
6.4 Summary ... 152
Chapter 7 Conclusions and Future Research Directions ... 153
8.1 Conclusions ... 153
8.2 Future Research Directions ... 155
List of Tables
TABLE 1DATA RATE OF VARIOUS VIDEO FILES USED AS GUIDE. ... 69
TABLE 2PUE VALUES OF ALL THE LAYERS OF THE PROPOSED ARCHITECTURE. ... 71
TABLE 3NETWORK PARAMETERS FOR THE MILPMODEL ... 71
TABLE 4INPUT DATA OF THE CORE NETWORK FOR THE MILPMODEL ... 72
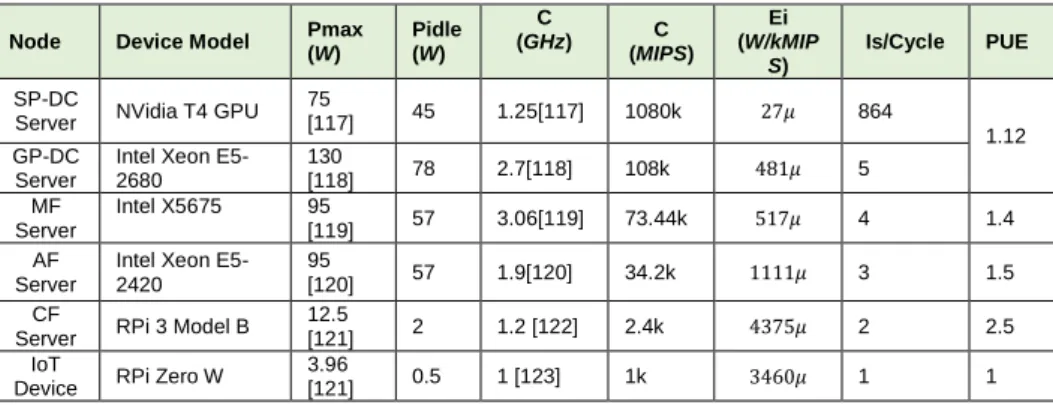
TABLE 5INPUT DATA OF PROCESSING SERVERS FOR THE MILP MODEL. ... 73
TABLE 6PROCESSING NETWORK INPUT DATA FOR THE MODEL. ... 74
TABLE 7ANALYTIC VERIFICATION OF THE OPTIMAL CHOICE IN SCENARIO #4 AT 5000MIPS. ... 91
TABLE 8ANALYTIC VERIFICATION OF THE OPTIMAL CHOICE IN SCENARIO #2 AT 5000MIPS. ... 92
List of Figures
FIGURE 2.1AHIGH LEVEL REFERENCE ARCHITECTURE OF INTERNET OF THINGS (IOT) ... 11
FIGURE 2.2BASIC WORKFLOW IN IOT ... 13
FIGURE 2.3CATEGORISED GROUPS OF IOT SERVICES [44]. ... 17
FIGURE 2.4A HIGH-LEVEL DEPICTION OF THE APPLICATIONS AND SERVICES OFFERED BY UK’S SMART MOTORWAY SYSTEMS. ... 20
FIGURE 3.1AHIGH-LEVEL ARCHITECTURE OF FOG COMPUTING SUPPORTED BY CLOUD RESOURCES ... 27
FIGURE 3.2THE PROPOSED FOG ARCHITECTURE OVER PON BY THE AUTHORS OF [84]. ... 29
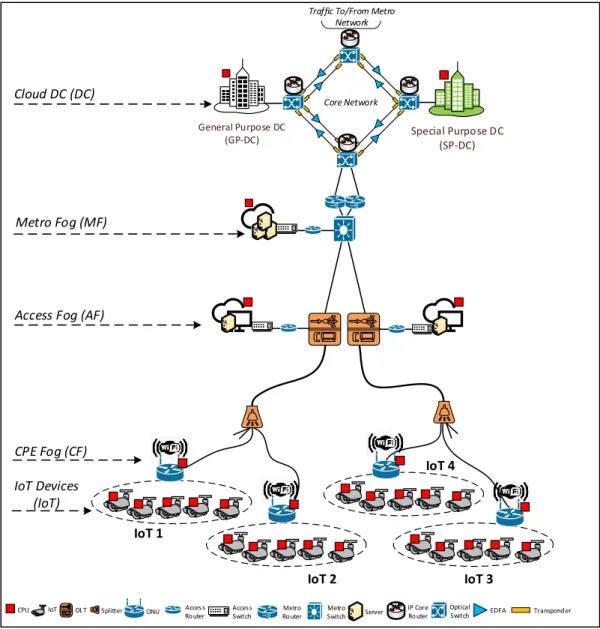
FIGURE 4.1:PROPOSED PON-BASED IOTARCHITECTURE SUPPORTED BY FOG AND CLOUD COMPUTING. ... 38
FIGURE 4.2NETWORK ELEMENTS INSIDE A CLOUD DC. ... 41
FIGURE 4.3NVIDIA'S TENSOR T4GPUPERFORMANCE VERSUS CPU. ... 42
FIGURE 4.4LINEAR POWER PROFILE WITH IDLE POWER CONSUMPTION... 44
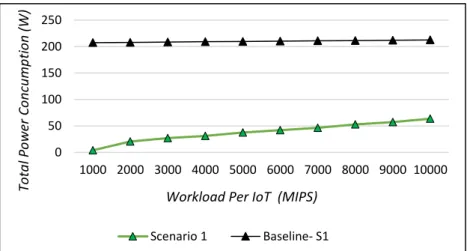
FIGURE 4.5TOTAL POWER CONSUMPTION OF DISTRIBUTED APPROACH IN SCENARIO #1. ... 77
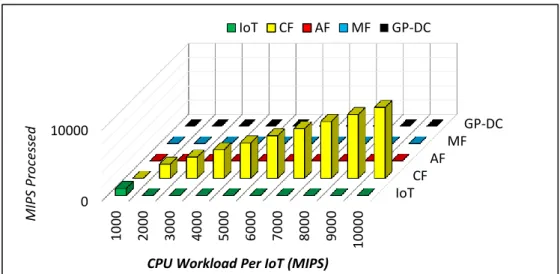
FIGURE 4.6WORKLOAD DISTRIBUTION IN SCENARIO #1. ... 78
FIGURE 4.7TOTAL POWER CONSUMPTION OF DISTRIBUTED APPROACH IN SCENARIO #2. ... 79
FIGURE 4.8WORKLOAD DISTRIBUTION IN SCENARIO #2. ... 79
FIGURE 4.9TOTAL POWER CONSUMPTION OF DISTRIBUTED APPROACH IN SCENARIO #3. ... 81
FIGURE 4.10WORKLOAD DISTRIBUTION IN SCENARIO #3. ... 81
FIGURE 4.11TOTAL POWER CONSUMPTION OF DISTRIBUTED APPROACH IN SCENARIO #4. ... 82
FIGURE 4.12WORKLOAD DISTRIBUTION IN SCENARIO #4. ... 83
FIGURE 4.14TOTAL POWER CONSUMPTION OF DISTRIBUTED APPROACH IN SCENARIO #1, IN THE CAPACITATED CASE. ... 84
FIGURE 4.14WORKLOAD DISTRIBUTION IN SCENARIO #1, IN THE CAPACITATED CASE. ... 84
FIGURE 4.15TOTAL POWER CONSUMPTION OF DISTRIBUTED APPROACH IN SCENARIO #2, IN THE CAPACITATED CASE. ... 86
FIGURE 4.16WORKLOAD DISTRIBUTION IN SCENARIO #2, IN THE CAPACITATED CASE. ... 86
FIGURE 4.17TOTAL POWER CONSUMPTION OF DISTRIBUTED APPROACH IN SCENARIO #3, IN THE CAPACITATED CASE. ... 87
FIGURE 4.18WORKLOAD DISTRIBUTION IN SCENARIO #3, IN THE CAPACITATED CASE. ... 87
FIGURE 4.19WORKLOAD DISTRIBUTION IN SCENARIO #4, IN THE CAPACITATED CASE. ... 88
FIGURE 4.20TOTAL POWER CONSUMPTION OF DISTRIBUTED APPROACH IN SCENARIO #4, IN THE CAPACITATED CASE. ... 88
FIGURE 4.21TOTAL POWER CONSUMPTION OF DISTRIBUTED APPROACH IN SCENARIO #4, WITH AND WITHOUT SP-DC. ... 89
FIGURE 4.22WORKLOAD DISTRIBUTION IN SCENARIO #4, WHEN SP-DC IS DEPLOYED. ... 90
FIGURE 5.1AN ILLUSTRATIVE EXAMPLE OF SERVICE SPLITTING ... 95
FIGURE 5.2 TOTAL POWER CONSUMPTION OF THE DISTRIBUTED APPROACH AT VARIOUS VALUES OF K. ... 98
FIGURE 5.4TOTAL POWER CONSUMPTION OF THE DISTRIBUTED APPROACH AT VARIOUS VALUES OF K. ... 100
FIGURE 5.5WORKLOAD DISTRIBUTION IN SCENARIO #2 AT DIFFERENT VALUES OF K. ... 100
FIGURE 5.6TOTAL POWER CONSUMPTION OF THE DISTRIBUTED APPROACH AT VARIOUS VALUES OF K. ... 101
FIGURE 5.7WORKLOAD DISTRIBUTION IN SCENARIO #3 AT DIFFERENT VALUES OF K. ... 102
FIGURE 5.8TOTAL POWER CONSUMPTION OF THE DISTRIBUTED APPROACH AT VARIOUS VALUES OF K. ... 103
FIGURE 5.9WORKLOAD DISTRIBUTION IN SCENARIO #4 AT DIFFERENT VALUES OF K. ... 103
FIGURE 5.10TOTAL POWER CONSUMPTION OF THE DISTRIBUTED APPROACH AT VARIOUS VALUES OF K. ... 105
FIGURE 5.11WORKLOAD DISTRIBUTION IN SCENARIO #1 AT DIFFERENT VALUES OF K. ... 105
FIGURE 5.12TOTAL POWER CONSUMPTION OF THE DISTRIBUTED APPROACH AT VARIOUS VALUES OF K. ... 106
FIGURE 5.13WORKLOAD DISTRIBUTION IN SCENARIO #2 AT DIFFERENT VALUES OF K. ... 106
FIGURE 5.14TOTAL POWER CONSUMPTION OF THE DISTRIBUTED APPROACH AT VARIOUS VALUES OF K. ... 107
FIGURE 5.15WORKLOAD DISTRIBUTION IN SCENARIO #3 AT DIFFERENT VALUES OF K. ... 108
FIGURE 5.16TOTAL POWER CONSUMPTION OF THE DISTRIBUTED APPROACH AT VARIOUS VALUES OF K. ... 109
FIGURE 5.17WORKLOAD DISTRIBUTION IN SCENARIO #4 AT DIFFERENT VALUES OF K. ... 109
FIGURE 5.18TOTAL POWER CONSUMPTION OF THE DISTRIBUTED APPROACH AT VARIOUS VALUES OF K. ... 110
FIGURE 5.19WORKLOAD DISTRIBUTION IN SCENARIO #4 AT DIFFERENT VALUES OF K, WHEN SP-DC DEPLOYED... 110
FIGURE 5.20 AN EXAMPLE OF SYNCHRONISATION TRAFFIC BETWEEN SUBTASKS OF AN IOT SERVICE ... 111
FIGURE 5.21WORKLOAD DISTRIBUTION AT SCENARIO #1 DURING (A)1% OVERHEAD,(B)5% OVERHEAD AND (C)10% OVERHEAD. ... 116
FIGURE 5.22TOTAL POWER CONSUMPTION OVERHEAD AT SCENARIO #1 COMPARED TO THE SOLUTION WITH NO OVERHEAD (NO_OH), DURING (A)1% OVERHEAD,(B)5% OVERHEAD AND (C)10% OVERHEAD. ... 116
FIGURE 5.23WORKLOAD DISTRIBUTION AT SCENARIO #2 DURING (A)1% OVERHEAD,(B)5% OVERHEAD AND (C)10% OVERHEAD. ... 118
FIGURE 5.24TOTAL POWER CONSUMPTION OVERHEAD AT SCENARIO #2 COMPARED TO THE SOLUTION WITH NO OVERHEAD (NO_OH), DURING (A)1% OVERHEAD,(B)5% OVERHEAD AND (C)10% OVERHEAD ... 118
FIGURE 5.25TOTAL POWER CONSUMPTION OVERHEAD AT SCENARIO #3 COMPARED TO THE SOLUTION WITH NO OVERHEAD (NO_OH), DURING (A)1% OVERHEAD,(B)5% OVERHEAD AND (C)10% OVERHEAD. ... 120
FIGURE 5.26WORKLOAD DISTRIBUTION AT SCENARIO #2 DURING (A)3% OVERHEAD,(B)5% OVERHEAD AND (C)10% OVERHEAD. ... 120
FIGURE 6.1ADDITIONAL DCADDED TO THE ORIGINAL ARCHITECTURE. ... 146
FIGURE 6.2(A)TOTAL POWER CONSUMPTION OF 1+1 SEVER PROTECTION IN SCENARIO #1 COMPARED TO THE BASELINE, (B) POWER OVERHEAD IN PERCENTAGE FOR 1+1 PROTECTION COMPARED TO BASELINE, FOR THE SAME SCENARIO. ... 147
FIGURE 6.3PRIMARY AND BACKUP SERVERS DISTRIBUTION IN SCENARIO #1 ... 147
FIGURE 6.4(A)TOTAL POWER CONSUMPTION OF 1+1 SEVER PROTECTION IN SCENARIO #2 COMPARED TO THE BASELINE, (B) POWER OVERHEAD IN % FOR 1+1 PROTECTION COMPARED TO BASELINE, FOR THE SAME SCENARIO. ... 149
FIGURE 6.6(A)TOTAL POWER CONSUMPTION OF 1+1 SEVER PROTECTION IN SCENARIO #3 COMPARED TO THE BASELINE, (B) POWER OVERHEAD IN PERCENTAGE FOR 1+1 PROTECTION COMPARED TO BASELINE, FOR THE SAME SCENARIO. ... 150 FIGURE 6.7PRIMARY AND BACKUP SERVERS DISTRIBUTION IN SCENARIO #3 ... 150 FIGURE 6.8(A)TOTAL POWER CONSUMPTION OF 1+1 SEVER PROTECTION IN SCENARIO #4 COMPARED TO THE BASELINE, (B) POWER OVERHEAD IN PERCENTAGE FOR 1+1 PROTECTION COMPARED TO BASELINE, FOR THE SAME SCENARIO. ... 151 FIGURE 6.9PRIMARY AND BACKUP SERVERS DISTRIBUTION IN SCENARIO #4. ... 151
List of Abbreviations
AP Access Point
𝐶𝑂2 Carbon Dioxide
CPE Customer Premises Equipment CPU Central Processing Unit
DC Data Centre
DSL Digital Subscriber Liner EDFA Erbium Fibre Amplifier
FDM-PON Frequency Division Multiplexing Passive Optical Network
GB Gigabyte
Gbps Gigabit Per Second
GHz Giga Hertz
GP-DC General Purpose Data Centre GPU Graphical Processing Unit IaaS Infrastructure as a Service
ICT Information and Communication Technology IoT Internet of Things
IP/WDM Internet Protocol over Wave Length Division Multiplexing LAN Local Area Network
LTE Long Term Evolution
mAh Milliampere-hour
Mbps Megabits Per Second
MILP Mixed Integer Linear Programming NaaS Network as a Service
OFDM-PON Orthogonal Frequency Division Multiplexing Passive Optical Network
OLT Optical Line Terminal ONU Optical Network Unit PaaS Platform as a Service PON Passive Optical Network PUE Power Usage Effectiveness QoS Quality of Service
RFID Radio Frequency Identification SaaS Software as a Service
SOA Service Oriented Architecture SP-DC Special Purpose Data Centre
TDM-PON Time Division Multiplexing Passive Optical Network VSN Virtual Sensor Network
W Watt
WDM Wavelength Division Multiplexing WiFi Wireless Fidelity
1
Chapter 1 Introduction
This chapter serves as the basis for motivating the work in this thesis on improving the energy efficiency of distributed processing in the context of IoT. The problem statement is presented and the tools and methodologies utilised in this thesis are summarised. The objectives and contributions are provided and the relevant publications are listed. Finally, an outline of the remainder of the thesis is provided.
1.1 Motivation
The number of connected objects in the Internet of Things (IoT) is growing at unprecedented levels. In 2011, this number surpassed the world’s population and by 2020, interconnected devices are expected to range between 26 billion to 50 billion devices [1], [2]. This increase in the number of connected objects is directly linked to the technological advancement in the past decades as this has enabled the production of miniaturised portable devices that are light weight, energy and cost efficient together with the widespread use of the Internet and the added value organisations and individuals can gain from IoT devices if their data is processed. Hence, these trends have made it attractive to integrate and connect almost anything to the Internet which eventually leads to the concept of IoT [3],[4].
There will be multitudes of IoT applications, some are already in existent while others are yet to be realised. Thus, massive amounts of data will be produced, that, if processed centrally by conventional clouds would lead to slow decision making and increased pressure on the already overwhelmed network. Autonomous vehicles, for example, are reported to generate data that is in the range of 1 gigabyte per second [5]. It is evidently clear that transporting all of this data to the cloud for processing is prohibitively costly in terms of bandwidth requirements and energy efficiency. In the past, the main focus of Information and Communication Technologies (ICT) was fixated on performance only. Little or no attention was paid to the amount of power ICT based components consumed and their adverse impact on our environment. The focus has now shifted towards energy efficiency, due to the rising cost of electricity, resource scarcity and increasing emission of carbon dioxide (CO2) [6]. It is reported that the emission of CO2 due to ICT based technologies is increasing at an alarming rate of 6% per year. Given this growth rate, the Internet can become responsible for up 12% of the global emissions by 2030 and cloud data centres which are at the heart of the IoT are one of the major components of ICT [7].
In this direction, distributed processing has been proposed by industry and academia as an effective strategy to curb the pressure imposed by the formidable scale of IoT. Fog computing is one of the distributed processing approaches which promises to tackle the aforementioned challenges by utilising the already available computational, storage, and networking resources in serving IoT data at the edge of the network, as close as possible to the source [8]. Oftentimes, decision making can be made better and quicker if the collected data is processed closer to the source [9]. Currently, fog
computing is still in its infancy and a standardised architecture has yet to be agreed. Thus, alternative IoT architectures are increasingly been studied in the research community in terms of efficient resource management and the interplay between fog devices and the cloud, since fog is regarded as a powerful complement to the cloud [10]. A proper resource management scheme is crucial in the fog, since application services can be placed on energy inefficient servers or even further from the source node which may result in higher communication latency as contemporary fog devices have
limited processing, storage and communication power [6]. It is expected that
through cooperation between fogs and the centralised cloud, a more efficient and greener computing platform can be achieved [11].
1.2 Problem Statement
A large number of fog devices exist at the edge of the network, which collectively provides enormous amounts of computational resources, that, if used, may help in curbing the unnecessary data exchange with the centralised cloud. In order to integrate the vast number of fog devices that are heterogeneous in terms of resources, proper resource management and network design frameworks are needed. These should take into account important dimensions such as energy efficiency, due to its impact on our environment, resilience, due to mission-critical services, and inter-service communications due to end-device cooperation. This study aims first to model the IoT infrastructure from an end-to-end perspective such that all layers of the networking domain are taken into account when an IoT service is launched from the end-device to the ultimate destination in the cloud which is located in the core network.
Passive Optical Networks (PON) have been proposed to support the distributed processing infrastructure as they are increasingly utilised due to their suitability for visual-based services as they provide high data rates, relatively low cost and are very scalable [12]. Several design factors that affect the power consumption of the distributed processing approach are considered. Those include the Power Usage Effectiveness (PUE) of the higher capacity fog layers, the core network and the cloud DC layer. PUE is the ratio of the total power consumption of a node (including cooling and lighting) to the power consumption of the communication and processing equipment. The studies in this thesis included investigations into the short term design problems (capacitated) and the long term ones (un-capacitated) in designing energy efficient network architectures [13].
1.3 Research Objectives
The work reported in this thesis has the following objectives:
1. To model and evaluate an end-to-end IoT infrastructure that is supported by fog and cloud processing.
2. To study capacitated and un-capacitated network design problems that consider joint minimisation of networking and processing power consumption in the placement of resource intensive services such as visual and object recognition applications.
3. To evaluate the impact of service splitting on improving the total power consumption of the distributed processing approach, in capacitated and un-capacitated network design problems.
4. To evaluate the provisioning of resilience for the proposed architecture, in terms of energy consumption overheads.
5. To evaluate the impact of inter-service communication for synchronisation and cooperation. This provides an insight on whether service splitting among low-power fog and IoT devices is beneficial if processing overheads are accounted for.
1.4 Thesis Contributions
To knowledge, the thesis made the following contributions:
1. It developed four new MILP models that can be used in the design of energy efficient distributed processing architectures, for both the short term and long term network design problems.
2. It designed and optimised the placement of non-splittable services for a number of active IoT scenarios that capture different distributions of source nodes in the network topology.
3. It evaluated through MILP, the impact of allowing service splitting on improving the total power consumption for both the short and long term network design problems.
4. It examined through MILP optimisation, the resilience of server protection for the main scenarios of active IoT source nodes that were considered in the thesis.
5. Finally, a MILP model was developed to incorporate the concept of inter-service communication to study its impact on total power consumption.
1.5 Related Publications
The following list includes publications that resulted from the work presented in this thesis:
B. Yosuf, M. Musa, T. Elgorashi, A. Q. Lawey and J. M. H. Elmirghani, "Energy Efficient Service Distribution in Internet of Things," 2018 20th International Conference on Transparent Optical Networks (ICTON), Bucharest, 2018, pp. 1-4.
B. A. Yosuf, M. Musa, T. Elgorashi and J. M. H. Elmirghani, "Impact of Distributed Processing on Power Consumption for IoT Based Surveillance Applications," 2019 21st International Conference on Transparent Optical Networks (ICTON), Angers, France, 2019, pp. 1-5.
Barzan. Yosuf, M. Musa, T. E. H. El-Gorashi and J. M. H.Elmirghani,“Energy Efficient Distributed Processing for IoT”, submitted to IEEE Access.
Barzan. Yosuf, M. Musa, T. E. H. El-Gorashi and J. M. H.Elmirghani,“ Resilient and Energy Efficient IoT Processing”, to be submitted to IEEE Access.
1.6 Thesis Organisation
Following the introduction in Chapter 1, this thesis is organised as follows: Chapter 2 reviews the concept of the Internet of Things (IoT) and highlights the key enabling technologies. It also overviews the reference architecture of IoT, its elements, service types, applications and concludes by listing a number of challenges facing IoT.
Chapter 3 provides an overview of distributed processing paradigms and fog computing. It also provides a critical review of the related works which motivated this thesis.
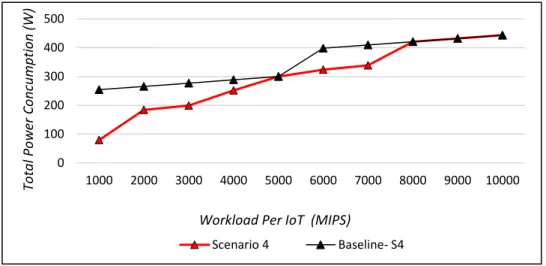
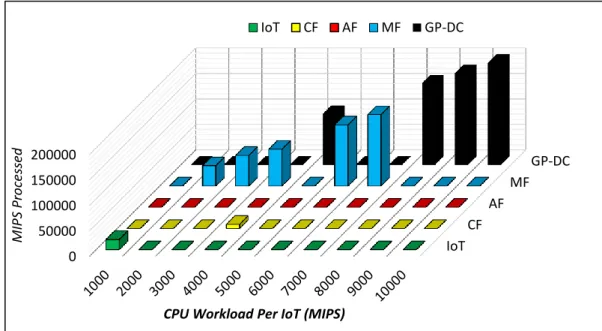
In Chapter 4, the problem of energy efficiency of distributed processing is tackled given non-splittable processing services, for both capacitated and un-capacitated network design problems. A visual based object recognition application was considered and the workload characteristics were determined. In addition to multiple layers of fog, two types of data centres were examined: 1) general-purpose data centres, which are energy inefficient and 2) special-purpose data centres, that are highly energy efficient and specialised in particular forms of processing. In most cases, distributed processing produced significant savings however for very high workloads it was observed special-purpose data centres were more favourable as they introduced savings of up to 50% in power consumption.
Chapter 5 examines the influence of service splitting on improving the energy efficiency of the proposed distributed processing approach. It was observed that in the un-capacitated case, following optimisation for energy efficiency, service splits mostly occurred between the IoT and the CPE fog layers, for relatively low workload volumes however as the workload increased, the cloud
and metro fog interplay produced better results due to processing inefficiency of CPE fog servers.
Chapter 6 focuses on resiliency for the architecture considered in Chapter 4 and in Chapter 5. The studies examined a 1+1 server protection scheme through geographical node disjoint constraints. The results showed that the highest percentage power overhead occurred when protecting low workloads which are within the capacity of IoT devices due to the activation of optical network units (ONUs) to get to another IoT device. For relatively higher workloads, it was observed that all layers of the proposed architecture were utilised in the protection however for very high workloads, primary and backup servers were predominantly placed in the cloud DCs due to their processing efficiencies.
Chapter 7 examined the impact of inter-service communications as a result of device cooperation and synchronisation.
Chapter 8 summarises the contributions of this thesis and suggests possible directions for future work.
Chapter 2
Background Review of Internet of Things (IoT)
2.1 Introduction
The Internet of Things (IoT), is regarded as a novel paradigm that is expected to pave the way for a plethora of applications that contribute significantly to enhancing our daily lives, in domains such as security, agriculture and health care, to name a few [14], [15]. Researchers in the past two decades have projected that billions of everyday objects will be connected over the Internet [16]. Such objects will range from simple devices such as RFID tags, temperature sensors to smart devices such as mobile phones, vehicles, surveillance cameras, etc. [17]. Cisco, reported in 2011, that by the year 2020, the number of connected IoT objects will reach around 50 billion [18]. While on the other hand, a more recent investigation by Gartner quoted this figure to be around 26 billion devices by 2020 [19]. Regardless of the correctness of the two aforementioned predictions, the matter of the fact is that IoT objects will be several times more than the estimated 7.7 billion of the world’s population [20]. These connected objects are all expected to have the ability to communicate with each other and cooperate in order to reach a common goal [3].
There are manifold definitions of the term IoT and they all imply the same concept of ubiquitous connectivity between the physical “things” anytime, from any place and for anyone [21]. Hence, it is certainly safe to suggest that connectivity from “any place” is virtually impossible without wireless capability
[22]. While most people regard IoT as large scale sensors, health and fitness monitors, self-driving cars, it stands for much more than that [23]. IoT will transform the modern world and reshape the industries within it. For example, smart meters will be used to enable better management of utilities across the national grid, sensors and actuators will allow automation a factory floor, city surveillance cameras will be used to help law enforcement agencies to prevent crimes before they happen through the aid of machine learning and pattern recognition algorithms [24]. The list of potential applications of the IoT is endless. It is not of any surprise that the IoT is included in the list of the top six “Disruptive Civil Technologies” by the US National Intelligence Council [17]. This is an indication of the important role the IoT will have in the near future and like the present Internet of today, it could contribute greatly to every domain of society. In 2012 alone, it was reported that IoT based application systems generated a revenue of $4.8 trillion [25]. It is still early days for the IoT and this figure could easily rise above and beyond expectations.
2.2 Reference IoT Architecture
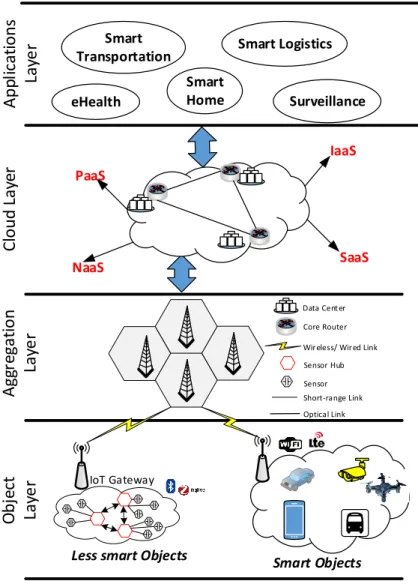
Generally, in the literature [26],[27], a common high-level reference architecture for the IoT is proposed that comprises of several layers as depicted in Figure 2.1. These layers are briefly described below in a bottom-up fashion:
eHealth Surveillance Smart Home Smart Transportation O bj ec t Lay e r Agg re gat ion Lay e r C loud Lay er App lica ti ons La ye r IoT Gateway
Less smart Objects Smart Objects
Wireless/ Wired Link
Sensor Sensor Hub Short-range Link SaaS IaaS PaaS NaaS Core Router Data Cent er Optical Link Smart Logistics
Object Layer: This is the lowest layer in the IoT architecture and is often called the perception layer. Its main purpose is to perceive the raw data from the environment. All the data collection and sensing are carried out in this layer. The IoT objects comprise of a variety of devices such as temperature sensors, smartphones, vehicles, drones, cameras etc. [5].
Aggregation Layer: This layer can also be called the network layer as it provides the networking infrastructure to securely forward the aggregated data from the objects to the cloud for processing. The transmission can be done
through wired or wireless mediums. Typically, communication technologies such as WiFi, Bluetooth, ZigBee, LTE, etc are used, depending on the type of the devices in the object layer and the intended application [28]. In most cases, an IoT gateway device is used to aggregate raw data from the resource constrained devices in the object layer (especially the less smart ones) [29]. Cloud Layer: This can also be called the middleware layer as it receives huge volumes of data from the network layer [30]. The main purpose of this layer is service management and data storage. It has an analytical centre to process the aggregated data and take automatic decisions based on the results of the analysis and feeds the output into the application layer [29]. This layer facilitates data access and storage through services in the cloud such as infrastructure-as-a-service (IaaS), Platform-as-a-service (PaaS), Software-as-a-service (Saas) and Network-Software-as-a-service (NaaS).
Application Layer: This layer is at the top of the architecture as is used in the presentation of the final data to the final user [3]. It receives information from the cloud and in return provides management services for the application presenting that information[30]. Hence, the application layer presents the IoT data in the form of smart city, smart home, eHealth, smart transportation, surveillance etc [28].
The basic workflow of IoT depicted in Figure 2.2 can be described in a simplified version as follows [30]:
1) Objects begin by sensing and making identifications to communicate object-specific information. Such sensed information can be a temperature reading, orientation, motion, video or audio, etc.
2) Processing of received information by smart devices which leads to making informed decisions such as triggering an actuator or object identification within a video/image file.
3) Feeding back information on the current status of the system to the administrator.
2.3 Enabling Technologies
Many key technology enablers are driving IoT into actualisation [3], some of which are described below:
1) Wireless and Low-Power Communication: For a long time, the “anytime, anywhere, any media” vision has been pushing forward the
Sensing + id
Processing
Feedback
regard, wireless technologies have played a major role as it was reported in 2010 that, the ratio between radios and people neared the 1:1 value [3]. In addition to this, the increase of the number of transistors on a single chip whilst simultaneously achieving reductions in size, weight, energy consumptions and monetary cost of the actual radio chip can push the aforementioned ratio above orders of magnitude [31]. Additionally, recent developments in lightweight protocols such as the IEEE 802.15.4 low-power wireless personal area network (6LoWPAN) has made it possible for the IP stack to connect a huge number of tiny and battery constrained sensor devices to the Internet [32].
2) Smart Devices: with the recent technological advancement in embedded systems and wireless communication, it is no longer the case that the IoT should include only simple sensors and actuators performing primitive tasks. As a result of the advances, various kinds of objects emerge as powerful devices that can sense, process and communicate over the network [33]. Such devices are expected to have capabilities of stationary servers residing in the cloud data centre [34]. Additionally, computational capability on portable devices have followed the Moor’s law for the past two decades and this is anticipated to continue the same way in the upcoming periods [34]. In the literature, the key functionalities of smart devices are categorised into three main groups namely, context awareness, device connectivity and autonomy [35].
3) Data and Energy Storage: Taking the most recent years as example, in 2012 data storage capabilities on a smart phone/tablet was about
32GB and as of 2019, Apple’s latest iPhone 11 is equipped with 256GB of internal storage [36]. It is of no doubt that memory and storage technologies will only get better in the future. This coupled with the invention of lithium batteries, it is only a matter of time before IoT objects penetrate every sector of our modern society. For instance, an RFID transmitter can operate up to one year on a single lithium coin cell battery with 240-mAh [37].
4) Cloud & Virtualisation: Virtualisation is the key technology of the cloud. It allows for the creation of various logical infrastructures on the same physical hardware [38]. These logical infrastructures may comprise of computing and networking resources. The virtualisation of clouds enables small to large organisations to lease powerful resources on a pay-as-you-go basis such as Software-as-a-Service (SaaS), Platform-as-a-Service(PaaS), and Infrastructure-as-a-Service (IaaS) [28]. This implies that IoT system novelists do not have to own expensive infrastructure in order to be able to run IoT analytics, but instead, they only have to bear the cost of usage of the service(s) [38]. Moreover, as well as compute resources for data analytics, virtualization has also enabled IoT network resources to become decoupled from traditional proprietary hardware. Hence, allowing for small IoT developers to request multiple heterogeneous virtual IoT networks on a pay as you go basis, which is mostly referred to as Virtual Sensor Networks (VSNs) [39]. Thus, both compute and network resources have become fully flexible and can dynamically be shared to achieve rapid development of new IoT services [11], [40].
5) Next Generation Access Networks: Conventionally, the last drop to the end-devices is provided by fixed-line access technologies such as copper based xDSL WiFi modems as well as wireless mobile technologies such as 3G/LTE etc. Given, the enormous expected growth in the number of connected IoT nodes and the need to access the distant cloud for data processing, the aforementioned access technologies could not cope with the front/backhauling demand of the IoT due to lack of bandwidth as well as their energy inefficiencies [41]. Thus, a number of important advancements have been made to tackle the above issues such as a multitude of heterogeneous access networks integrated into a single platform (5G) to provide better and seamless data exchange with the cloud. A number of efficient schemes allow for the integration of a wireless front to offer ubiquitous services for mobile/fixed nodes and fibre links to provision for the backhauling which is not possible with the wireless infrastructure on its own [42]. In the access part of the network, Passive Optical Networks (PONs) have been hailed as the most attractive solution due to their high bandwidth, low cost and point-to-multipoint architecture [17]. This technology offers great bandwidth in the uplink and downlink and has the potential to allow for network convergence. Since the required data rates over wireless/mobile networks are achieved through decreased cell distances, a large number of cells in urban areas will be deployed, this particularly makes PON an attractive access networking solution due to its point-to-multipoint architecture [43].
2.4 IoT Service Types
The IoT has embedded itself in many aspects of our daily lives. In this section, some of the applications and services of IoT are reviewed. The applications of the IoT are so vastly endless, we can merely scratch the surface. In the literature, works such as [44], [45] and [46] have grouped the IoT applications into four main classes that can be used as umbrella terms to aid our understanding of this imminent technology. As depicted in Figure 2.3, these classes consist of 1) identity-related services, 2) information aggregation services, 3) collaborative-aware services and 4) ubiquitous services.
Figure 2.3 Categorised groups of IoT services [44].
The most basic and yet important service out of the four is the identity-related services. The reason behind this is that any application that requires digitalising the properties of the physical “things”, must first have the means to identify those “things” [44]. Whilst, on the other hand, Information Aggregation Services are reliant upon the first category as such services refer to the process of acquiring data from various sensors, processing this data then transmitting the obtained knowledge via IoT to the application in question. In the aggregation process, services may use different communication
Service Class Identity-Related Services Information Aggregation Services Collaborative-Aware
channels to acquire data from different types of sensors. For instance, RFID tags could be used in an application to identify objects, whilst simultaneously using a ZigBee network to aggregate sensor data, as illustrated in Figure 2.1. All of these functionalities are incorporated into a device mostly referred to as “IoT Gateway” [47]. An IoT gateway can be a device or software that acts as a bridge between the objects and the cloud since all the data moving to the cloud has to pass through the gateway. Often most, the data passing through the gateway is mined in order to extract knowledge before it reaches the cloud. This extracted knowledge is then acted upon by Collaborative-Aware Services, which require “thing-to-thing” as well as “thing-to-person” communication. Thus, provisioning for collaborative aware services, the IoT network infrastructure will require extensive reliability and a significant increase in speed [46]. Ubiquitous Services, however, are the essence of IoT. Such services are not only collaborative, but aim to provide collaborative services “anytime”, “anywhere”, and for “anyone” [48].
2.5 IoT Applications
Having reviewed the categories of the IoT services and applications in the previous subsection, the current subsection will provide examples applications that fall into each type service class since this is a useful way of providing a basic framework to build an application upon a particular type of class [46]. With the potentialities offered by the IoT, it is not possible to list every possible application since only a small number is currently deployed in our society [3].
Logistics: This is one of the common examples of identity related services. IoT devices such as RFID tags are used to track and trace almost every link in the supply chain ranging from purchasing of raw materials, products to after sales and inventory management [49]. RFID tags used to be known as the digital version of barcodes, however, they offer much more in that they can be utilised to track items in realtime which provides useful information about their current status accurately and timely [21]. Thus, various enterprises can better manage their inventory and resources by being able to plan ahead of time, thus responding promptly and accurately to the dramatic nature of markets in a short time [3].
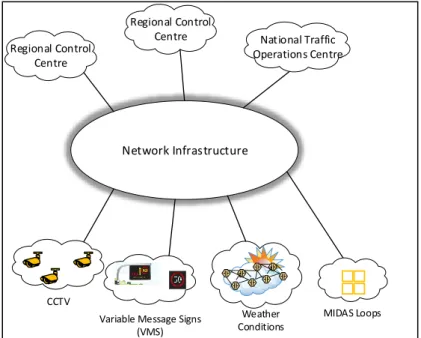
Smart Transportation Systems: Smart motorways and roads are already deployed throughout most cities of the UK [50]. The application comprises of thousands of different types of sensors, cameras and digital displays to monitor and respond to the dynamic change in traffic on the motorway [51]. The National Roads Telecommunications Service (NRTS) project was implemented as part of the UK’s smart motorway project and its second phase contract has already been handed over to telnet Technology Services in 2017 [52]. This project works on providing the backbone network that enables the 7 regional control centres throughout the UK to connect to up 30,000 technology assets such as CCTV cameras, message signs, weather condition sensor networks and motorway incident detection and automatic signalling (MIDAS) loops installed every 500 meters to detect the current state of traffic due to an incident [53]. This type of application exhibits elements spanning across the identity-related services and information aggregation services. In fact, every potential IoT application will at least incorporate some parts of identity-related
identity. As for the second class, the devices in the network are only used to aggregate data about their ambient environment and forward them towards the regional control centres for decision making purposes. Figure 2.4 is an illustrative depiction of the different types of device networks used for information aggregation for the regional control centres.
Smart Surveillance: In a smart city, large numbers of intelligent video surveillance cameras will be distributed along roads or strategic intersections of a busy road to provide a strong sense of assurance to the general public [54]. These intelligent cameras will be exploited to run object recognition algorithms and machine learning tools to alert law enforcement agencies to take action proactively and prevent potential crimes [55]. The different cameras are also used in some applications to cooperate with one another to identify and track vehicles in motion [3]. This overall makes these intelligent devices somewhat autonomous and collaborative in the sense that there is some sense of collaboration between the objects in question and there is autonomous decision makings taking place [46]. In a nutshell, a service is
Figure 2.4 A high-level depiction of the applications and Services offered by UK’s smart motorway systems.
CCTV
Variable Message Signs (VMS) Weather Conditions Network Infrastructure Regional Control Centre Regional Control
Centre National Traffic Operations Centre
classed as collaborative-aware if the data collected by the objects are acted upon at the source node and decisions for performing certain tasks are taken. One of the prerequisites of creating a collaborative-aware service is having computational power onboard IoT objects, hence these devices can no longer be used for sensing purposes only.
2.6 Challenges
In the near future, the IoT will revolutionise the shape of today’s Internet which will lead to endless economics and societal benefits, but at the same time, it is faced with many key challenges that need serious considerations [27], [56]. Some of these challenges are briefly described as follows [30]:
Object ID Management: As is apparent, the IoT ecosystem will consist of billions of heterogeneous objects, that are going to be used to provide innovative services. A network of objects at such scale will require these objects to have unique IDs over the Internet, thus, this calls for proper object ID management scheme, that is able to dynamically assign and manage unique identity for all the objects. Traditionally, the domain name system (DNS) has been used over the years in current networks for such purposes, however, such system cannot adapt to the IoT environment as many of the “things” or objects will be mobile and resource constrained [11].
Interoperability and Standardisation:The general prerequisite of IoT systems is to support openness and interoperability since different IoT objects need to connect through different interfaces to provide the required services [57].Many of such objects are going to be proprietary
hardware, manufactured by various vendors, standardisation of the IoT is vital to provide better interoperability for all the “things” [58].
Security, Privacy & Trust: The IoT presents serious security related challenges that are reported in the IERC 2010 Strategic and Innovation Roadmap. While each domain, security, privacy and trust is faced with unique challenges in the IoT, they all share a number of non-functional requirements such as 1) light-weight solutions to support constrained objects, and 2) scalable to billions of devices. Moreover, any solution must address object heterogeneity and diversity as well as being seamlessly integrated into real-world [1]. Below is a brief description of each domain:
o Trust: Since IoT-based systems and application will scale over multiple administrative domains, it is bound to involve multiple stakeholders and ownerships. Hence, there needs to be a proper trust framework that enables the users of the IoT system to have full confidence that the services being provided can be relied upon.
o Security: The IoT will comprise of a large number of physical objects that are potentially spread over in a large geographical region. Similar to DoS/DDOS attacks on the current Internet, the IoT will not be exempt also from such threats. It is necessary to have specific techniques and mechanisms to ensure that IoT services cannot be disrupted or undermined [1].
Privacy: The IoT will use different forms of identification technologies such as RFID tags, that may be associated with objects, from which people’s location can be inferred, as an example. Thus, it is very important to have the right
mechanisms in place that prevents the inference on personal information and allows IoT users who wish to keep their details anonymous. Also, another measure to protect personal information is to keep data as local as possible making use of decentralised processing and key management [59].
Network Channel Bandwidth: The vast number of connected “things” will create data at an exponential rate [60]. A connected object such as a vehicle can generate tens of MB’s of data per second. Such data will comprise of 1) the vehicle’s mobility and its routes, 2) vehicles operating conditions, 3) the vehicle’s ambient environment such as road and weather conditions, 4) videos recorded by the vehicle safety camera [5]. An autonomous vehicle is reported to generate even more data, at around 1 GB per second [61]. Transporting all the data over the network to the cloud will demand huge network bandwidths. The wireless medium used to transmit IoT data should be able to handle such scale of sensors without any data loss due to network congestion [30], [25].
Energy Efficiency of IoT (or Green IoT): Due to the formidable volume of data generated by billions of objects, the intervention of cloud becomes a necessity as processing will be required to extract knowledge from all that data. In order for the cloud to process, it is required to be running around the clock which leads to enormous consumption of power and this subsequently leads to higher CO2 and eventually takes a deep toll on the environment [25]. In addition to the environmental impact, energy consumption is directly linked with
network operators’ operational expenditure as well as social and political issues [62]. Thus, it is important to note that in this regard, energy harvesting and low-power ICs are central in the development of the IoT [22].
2.7 Summary
Internet of Things (IoT) is regarded as an emerging paradigm and its actualisation is imminent in the near future. This chapter has briefly introduced the concept of IoT and its elements that are used to define and shape it. Although a standard architecture is yet to be agreed upon by all the stakeholders of this revolutionary technology, a reference architecture which is widely used in the literature was reviewed by depicting a high-level network architecture with a detailed description of all the layers involved in the IoT stack. This is followed by the most important technologies that are seen as major enabling factors in realising the IoT, types of service classes and example applications within each class and the chapter was concluded by identifying the key challenges that are reported to impede the progress of the IoT.
The next chapter surveys various distributed processing paradigms as well as the related work on energy efficient distributed solutions in the context of IoT.
Chapter 3
Distributed Processing and Related Works
3.1 Introduction
Generally, distributed processing refers to a decentralised system in which computational tasks are subdivided between multiple networked devices, and these devices communicate with one another through the network to achieve the original goal of the application. One of the earliest known versions of distributed processing was introduced back in the 1970s which comprised of a local area network (LAN) that interconnected serval computers and allowed multiple applications to communicate among themselves and develop a collective solution for a computational problem [63]. However, since then, distributed processing has evolved into various new paradigms, namely fog computing, edge computing, mobile cloud computing, cloudlets, clouds, etc [64]. These paradigms all have at least one thing in common which is processing end-devices data over a given communication network, as close as possible to the end device. However, they differ in terms of the scale of hardware deployment and their level of proximity to the IoT end devices [65]. For instance, clouds are accessed via the core network while fog computing, edge computing, mobile cloud computing and cloudlets could be one hop away from the end devices. Also, cloud data centres house thousands of powerful servers and compared to the other paradigms their resources are virtually unlimited [12].
Generally, cloud computing is known as a centralised solution in which end users share a large, centrally managed pool of resources which are offered to the end-users on a pay as you go basis. Such resources are mainly classed into three groups, namely Infrastructure as a Service (IaaS), Platform as a Service (PaaS) and Software as a Service (SaaS) [66]. With IaaS, end-users are offered virtualised storage, computation and network whilst PaaS are services that provide the needed environment for application development and SaaS combines IaaS and PaaS to allow end-users to outsource all their computational needs from the cloud [65].
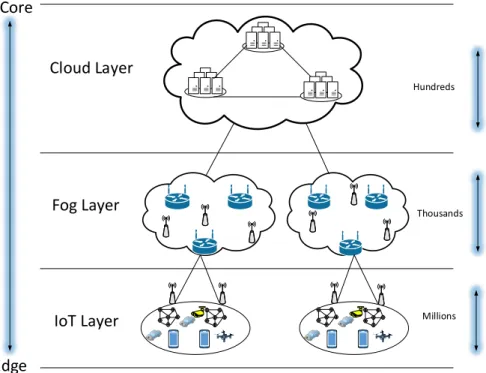
On the other hand, fog computing is classed as a decentralised computing paradigm due to its distributed nature and the number of nodes is greater than the centralised cloud by several orders of magnitude [67], [68]. Fog computing aims to extend the functionalities of the centralised cloud closer and even onto the end-devices themselves, hence the OpenFog Consortium as the main promoter of fog computing defines the fog architectures as a “cloud closer to the ground” [69]. As shown in Figure 3.1, fog computing can be represented through a hierarchically, usually in three layers. The bottom-most layer is where all the IoT end-devices are located and these are expected to have limited computation, storage and networking capacities, whilst the higher layers are expected to contain the more powerful devices. Any device that is equipped with communication, computational and storage resources can act as a fog node [70]. At the edge of the network, large numbers of potential fog nodes exist, collectively. They can offer enormous amounts of computing power as they are spread across millions of devices which include routers, switches, gateways, smartphones, surveillance cameras etc. [66].
It must be noted that fog cannot be implemented solely on its own, but rather, the cloud must be used to complement the limitations of the fog such as processing compute-intensive application components, whilst on the other hand, the less compute-intensive components can be processed on the fog nodes [2], [11].
Figure 3.1 A High-Level Architecture of Fog Computing Supported by Cloud Resources
IoT Layer Fog Layer Cloud Layer Edge Core Millions Thousands Hundreds
3.2 Related Work
The work proposed in this thesis reduces the energy consumption of distributed processing in the context of IoT and fog computing through the optimum placement of application services, from an end to end perspective. This subsection summarises previous research work related to energy consumption minimisation in the context of IoT and related paradigms, through various schemes such as resource allocation and architectural design and planning.
Generally, in a fog architecture, a large number of devices exist at the edge of the network, which collectively provides enormous amounts of computational power, that, if used, may help in curb the unnecessary data exchange between the IoT and the centralized cloud [71]. These devices are heterogeneous in terms of resources. This poses a number of challenges in the optimum design of architectures, protocols and hardware of future IoT based networks. Hence, proper resource management and network design solutions are needed [72]. These solutions should take into account important dimensions such as but not limited to energy efficiency, due to its impact on the environment [73], resilience, due to service criticality [2], [73], [74] and end-device cooperation, due to traffic bifurcation which leads to inter-service communication [75], [76]. Thus, fog solutions have been proposed to improve the aforementioned performance metrics through various approaches such as resource allocation [10], [14], [16], [25], [77]–[80] and architectural design and planning [29],[71], [81]–[84]. The reader is referred to the works in [73] and [64], for architectural design imperatives of fog networks and a detailed taxonomy of fog based solutions, respectively.
The focus in the literature has shifted towards making the whole IoT infrastructure more energy efficient [29] as opposed to optimizing only individual layers namely the device layer, access layer or the cloud. The works in [83] and [84] proposed the use of PONs to extend cloud and fog services closer to the user premises, respectively. Optical based networks are expected to become increasingly important to support edge and fog computing in the next decades. Although no particular algorithmic or optimization model was proposed, however, detailed discussions were provided on how the architecture in question can improve QoS and how different distributed fog resources located in the user premises can efficiently be managed.
The authors of [29] proposed an energy efficient IoT architecture in which sensors’ sleep intervals are predicted based on their remaining battery level and as a result resources of the cloud can be better utilized by re-provisioning them when the sensory nodes are in sleep mode. The main contribution of the work is centred around developing a mechanism to predict
the sleep intervals of sensor nodes based upon certain sensor variables such as battery level and previous usage history.
The work in [25] mathematically models the entire fog network from the end terminals (TNs) to the cloud data centres located in the core network. The TN nodes sense data and transmit the same to the fog tiers, either to be processed by fog nodes or to be forwarded to the cloud for further analysis. The performance of the fog approach in provisioning for IoT applications is investigated by considering several dimensions such as power consumption, CO2 emissions and service latencies in the fog network compared to the baseline cloud system. Their results indicate that the fog computing approach is only beneficial when there is a high number of latency-sensitive applications. Although fog computing was comprehensively studied, the authors made no mention of the practical networking or processing hardware that was used in obtaining their results. In another work, the authors of [71] compare the efficiencies of highly distributed edge devices called Nano data centres that can host and distribute user contents in a P2P fashion. These edge servers are comprised of Raspberry Pi’s that are low power single board computers. The authors investigate the system performance through time-based and a flow-time-based power consumption model. For devices that are highly shared by many users and services, the authors adopt a flow-based model whilst a time-based model is used for equipment that is close to end-users.
The work of [82] proposes a framework for cloudlet based network design and planning. The focus of the work is primarily centred around designing a network based on TDM-PON to optimize the network
infrastructure cost whilst meeting latency constraints only. The problem is formulated as a Mixed Integer Non Linear Programming (MINLP) model which is utilized to identify efficient cloudlet placement locations and optimal assignment of ONUs to cloudlets. The feasibility of the proposed model is evaluated against urban, suburban and rural scenarios, which guide the installation and maintenance costs. In another work [80], a generic fibre-wireless architecture is proposed which supports the coexistence of the centralized cloud and distributed mobile edge computing (MEC) for IoT connectivity. A distributed game-theoretic algorithm is developed to support collaborative computational offloading between the cloud and MEC. Numerical results show very low energy consumption is achieved compared to the baseline which is the optimal case that cannot be realized in practice, hence the distributed approach is used to reduce complexities. The authors of [81] put forth a capacity planning framework that improves the resource utilization of a hierarchical edge cloud network whilst simultaneously meeting QoS requirements in terms of response delay. They do this, by taking advantage of diverse demands for CPU, GPU and network resources.
The authors of [14] formulate the service distribution problem in an IoT-Cloud architecture using a linear program whose solution results in the optimum placement of IoT service functions and the routing of network flows across a multi-layer architecture consisting of devices, access and cloud layers. The total energy consumption is minimized whilst meeting the end-user latency demands. In another work [79], the service allocation problem is formulated as an integer programming optimization, whose objective function is to minimize the total latency experienced by IoT services, subject to
IoT service requests are considered to be generic, ranging between 10 – 50 homogenous requests. The delay is minimized by placing the less demanding services as close as possible to the IoT devices whilst the medium and high demanding services are placed higher up the fog network. In their work, IoT devices have been excluded from hosting any type of data processing.
Similarly, the authors in [78] propose a generic algorithmic for the placement of IoT services in a fog-cloud framework. The IoT services are considered as multiple modules that are collectively used to deliver a full application. A specific algorithm is used to efficiently deploy application modules dynamically across the fog-cloud infrastructure close to the source terminals in the fog layer. The performance of the proposed solution is addressed through evaluation of latency and efficient resource utilization and it is claimed that it can be extended to include further design dimensions. In [77], an Integer Linear Program (ILP) is proposed to model the problem of resource provisioning from the perspective of service providers, in the context of the heterogeneous Internet of Things, where the objective function is to minimize the total monetary costs subject to capacity and latency budgets. The heterogeneity of IoT is modelled through unique profiling of applications and as such 4 different types of applications are considered. The topology considered comprises of a Metropolitan Area Network (MAN) and consists of two hierarchical levels of interconnected rings. The results indicated that the total operational cost is directly impacted by the application’s computational complexity, compression factor, and latency budget, coupled with proportions of local traffic versus global traffic. The authors in [10] put forth a convex optimization model that addresses the delay-power trade-off in a cloud-fog architecture which consists of four subsystems. The work demonstrated that
compromising modestly on computational resources in order to save communication bandwidth and reduce transmission latency, fog computing platforms can significantly complement the performance of cloud computing. The proposed work has not considered the impact of local computation using the devices in the IoT layer.
The authors of [16], unlike the previous aforementioned works, model the IoT service placement in a practical testbed using an ILP formulation by considering several objective functions that address service latency, service migrations and energy efficiency. The optimization model is executed iteratively to allow for the retention of the objective values of previously executed models, thus, the feasibility region continuously decreases since iterations must satisfy previous results. The approach is generic and can be adapted to other resource placement problems. Their results show that for real-time services, latency becomes important and thus services are processed on the nearest fog, while the latency tolerant services can be offloaded to the distant cloud as energy consumption becomes the priority. It is observed that each of the approaches proposed in all of the aforementioned studies does not consider fog solutions that offer network designers’ insight into energy efficiency in short-term (capacitated) and long-term (un-capacitated) optical based fog networks. Moreover, our previous works considered energy efficient solutions in cloud and core networks, IoT and mobile networks using MILP techniques considering a variety of scenarios including big data processing in core networks [85], [86], design of energy efficient optical architectures [87]–[89], and data centres [90], content distribution [91] and caching [92], network coding [93], NFV and big data in
![Figure 3.2 The Proposed Fog Architecture over PON by the Authors of [84].](https://thumb-us.123doks.com/thumbv2/123dok_us/10132291.2914172/44.892.223.758.555.873/figure-proposed-fog-architecture-pon-authors.webp)