PLEASE SCROLL DOWN FOR ARTICLE
On: 23 January 2010
Access details: Access Details: [subscription number 912375050]
Publisher Taylor & Francis
Informa Ltd Registered in England and Wales Registered Number: 1072954 Registered office: Mortimer House,
37-41 Mortimer Street, London W1T 3JH, UK
Isotopes in Environmental and Health Studies
Publication details, including instructions for authors and subscription information:
http://www.informaworld.com/smpp/title~content=t713643233
Stable nitrogen isotopes in essential versus non-essential amino acids of
different plankton size fractions
Natalie Loick a; Matthias Gehre b; Maren Voss a
a Baltic Sea Research Institute Warnemünde, Rostock, Germany b Department of Isotope
Biogeochemistry, Helmholtz Centre for Environmental Research - UFZ, Leipzig, Germany
To cite this Article Loick, Natalie, Gehre, Matthias and Voss, Maren(2007) 'Stable nitrogen isotopes in essential versus
non-essential amino acids of different plankton size fractions', Isotopes in Environmental and Health Studies, 43: 4, 281 — 293
To link to this Article: DOI: 10.1080/10256010701702978
URL: http://dx.doi.org/10.1080/10256010701702978
Full terms and conditions of use: http://www.informaworld.com/terms-and-conditions-of-access.pdf
This article may be used for research, teaching and private study purposes. Any substantial or systematic reproduction, re-distribution, re-selling, loan or sub-licensing, systematic supply or distribution in any form to anyone is expressly forbidden.
The publisher does not give any warranty express or implied or make any representation that the contents will be complete or accurate or up to date. The accuracy of any instructions, formulae and drug doses should be independently verified with primary sources. The publisher shall not be liable for any loss, actions, claims, proceedings, demand or costs or damages whatsoever or howsoever caused arising directly or indirectly in connection with or arising out of the use of this material.
Stable nitrogen isotopes in essential versus non-essential
amino acids of different plankton size fractions†
NATALIE LOICK*‡, MATTHIAS GEHRE§ and MAREN VOSS‡
‡Baltic Sea Research Institute Warnemünde, Seestr. 15, 18119 Rostock, Germany §Department of Isotope Biogeochemistry, Helmholtz Centre for Environmental Research – UFZ,
Permoserstr. 15, 04318 Leipzig, Germany
(Received 07 March 2007; in final form 22 July 2007)
The stable nitrogen isotope values (δ15N) of the essential amino acid (EAA) leucine and theδ15N values of six non-essential amino acids (NEAAs) from plankton size fractions from the South China Sea (SCS) were analysed. Data from the SCS were collected during two cruises in July 2003 and 2004 onboard ofRV Nghien Cuu Bien.Theδ15N values of alanine, aspartic acid, glutamic acid and leucine increased with size at all sites. Theδ15N of glycine did not increase with size, theδ15N of tyrosine increased with size only at offshore stations and theδ15N of proline increased with size only at inshore stations. We found highly significant correlations between theδ15N ratios of leucine to theδ15N ratios of glutamic acid, proline, alanine, tyrosine and aspartic acid at oligotrophic sites of enhanced nitrogen fixation. In contrast thereto these correlations were less distinct or absent at more eutrophic sites of low nitrogen fixation. A comparison with an independent data set from the tropical North Atlantic revealed intriguing similar patterns. We interpret these patterns as result of the connected metabolism of EAA and NEAA in zooplankton at sites of nitrogen limitation.
Keywords: Amino acids; Internal nitrogen recycling; Nitrogen-15; Nitrogen fixation; South China Sea; Zooplankton
1. Introduction
The recent application of gas chromatography-combustion-isotope ratio mass spectrometry (GC-C-IRMS) on measuringδ15N in natural amino acid samples by McClelland and Montoya [1, 2] shows the potential of this technique for direct determination of amino acid dynamics between zooplankton and diet. Their experimental results deepened the understanding on how the food source and trophic-level information in total nitrogenδ15N measurements is accom-plished. According to their feeding experiments with the algae Tetraselmis suecicaand its consumer the rotiferBrachionus plicatilis, bulkδ15N values in plankton are determined by
†Revised version of a paper presented at the 27th Annual Meeting of the German Association for Stable Isotope Research (GASIR), 4–6, October, 2006, Freiberg, Germany.
*Corresponding author. Natalie Loick, Aalstecherstr. 3, 18055 Rostock, Germany. Tel.: +49-381-5197-267; Fax:+49-381-5197-440; Email: [email protected]
Isotopes in Environmental and Health Studies
ISSN 1025-6016 print/ISSN 1477-2639 online © 2007 Taylor & Francis http://www.tandf.co.uk/journals
DOI: 10.1080/10256010701702978
large changes in theδ15N values of some amino acids and small changes of others.Glutamic
acid, alanine and aspartic acid showed the largest difference inδ15N values of 4.0–6.7 ‰,
whereas phenylalanine, serine, glycine and tyrosine showed the smallest differences of 0.3 to 0.9 ‰ between diet and consumer. These differences in amino acidδ15N resulted in moder-ate differences in bulkδ15N between diet and consumer of 1.5–2.0 ‰. But this may not be the only information hold in theδ15N values of amino acids of zooplankton. Amino acids allocate a key function in the metabolism of tropical marine zooplankton as 20–80 % of the body dry weight are proteins and the metabolism is protein based [3, 4]. Zooplankton devel-oped different strategies to maintain its metabolism even under unfavourable conditions and copepods are capable to keep constant C:N ratios and amino acid composition even under low food conditions [5–7]. In order to avoid such a misbalance, it has been suggested that the ammonium excretion is reduced [8]. This may be achieved by ‘optimisation’ of the intracel-lular amino acid metabolism which means here the use of essential amino acids (EAAs) to synthesise non-essential amino acids (NEAAs) rather than being excreted as ammonium [9]. So far, there has been no method to detect the translocation of amino groups from EAAs to non-NEAAs.
Nitrogen limitation, especially in oligotrophic areas such as the South China Sea (SCS) or the tropical North Atlantic (NA), may cause a shortage in amino acid supply and disturb the optimal amino acid balance in crustaceans, especially as 10 amino acids are essential [10]. We think that the GC-C-IRMS analysis of EAAs and NEAAs holds the potential to detect the translocation of amino groups in natural plankton samples.
Here we want to show, also by comparing our data with those from the NA, that δ15N amino acid values may indicate that the EAA and NEAA metabolisms are connected under nitrogen limitation. For the first time, we show stable nitrogen isotope data from seven amino acids including the EAA leucine from six different plankton size fractions from the southern SCS. We found strikingly similar patterns in the re-analysis of amino acidδ15N data from
McClelland and Montoya [2] from two sites in the tropical NA that also differed in N2
-fixation intensity. We discuss these results against the background of different environmental parameters and explain why they may be the consequence of intensified translocation of amino groups from EAA to NEAA in zooplankton.
2. Methods 2.1 Field sampling
During southwest monsoon 2003 and 2004, observations on a fixed station grid with RV Nghien Cuu Bientook place in the Vietnamese upwelling area at 11◦to 12.7◦N and 109◦to 110.5◦E from 10 to 16 July 2003 and from 8 to 26 July 2004 (figure 1). Net plankton was col-lected in vertical tows with JUDAY-nets (45 and 200μm mesh, respectively, diameter 0.37 m) through the upper 100 m of the water column. Plankton was separated into size fractions by passing it through 166μm and 55μm, 2500μm, 1500μm, 1000μm, 330μm Nitex sieves. Samples were rinsed plenteously during the separation process to break up and remove any Trichodesmiumcolonies caught in the sieves. Prior to drying at 60◦C and storage in aluminium foil, all size fractions were qualitatively inspected under a microscope.
2.2 Plankton sample selection for GC-C-IRMS analysis
Four sets of size-fractioned plankton samples were chosen for stable nitrogen amino acid analysis based on the position of the sampling stations within or outside the upwelling area
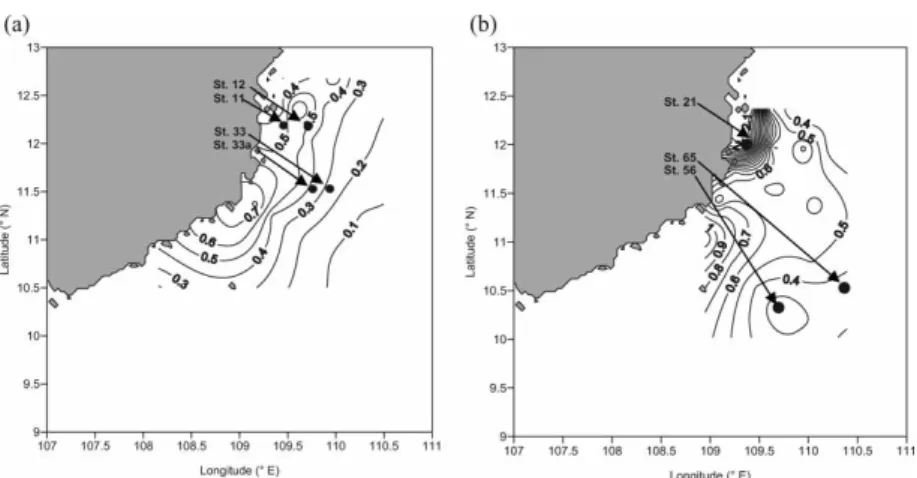
Figure 1. Stations chosen for amino acid analysis in- and outside the upwelling area as indicated by the dotted line after Dippneret al.[13]. Stations 11, 12, 33a and 33 were sampled during SWM 2003 and stations 21, 56 and 65 during SWM 2004. Also included are the sea surface salinities<33.2 indicative for the influence of Mekong waters [17].
(figure 1). Stations within the upwelling area included stations 11 and 12 (2003) and station 21 (2004). We pooled the plankton size fractions from stations 11 and 12 to get enough material for the amino acid analysis (figure 2). Pooling criteria included similarities in bulk δ15N values (figure 2), physico-chemical parameters as well as chlorophylladistributions at
the stations (figures 3 and 4). Stations outside the upwelling area included stations 33a and 33 (2003) and stations 56 and 65 (2004). We pooled the plankton size fractions from stations 33a and 33 and added size fraction 166–330 from station 56 to better cover the size spectrum,
Figure 2. δ15N bulk values from July 2003 (a) and 2004 (b) from stations inside (black symbols) and outside (open symbols) the upwelling area. Encircled are the samples used or pooled for analysis ofδ15N in individual amino acids.
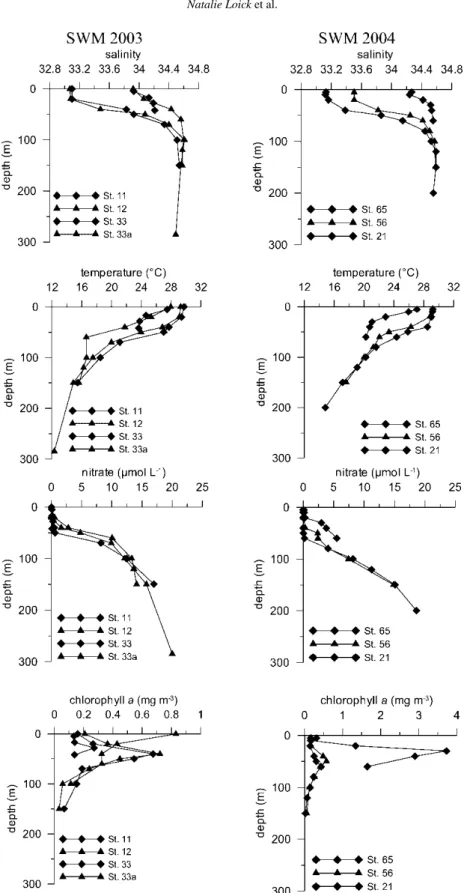
Figure 3. Vertical salinity, temperature, nitrate and Chladistributions at stations within (closed symbols) and outside (open symbols) the upwelling area during SWM 2003 (left panels) and SWM 2004 (right panels). Note the different Chlascales for 2003 and 2004 data.
Figure 4. Normalised depths integrated Chlavalues over the upper 70 m of the water column from (a) SWM 2003 and (b) SWM 2004. The black dots mark the position of the sampling stations for the amino acid analysis. Contour interval=0.1 mg/m3.
of which especially size fraction 55–166μm was poorly covered due to lack of plankton material.
Allδ15N-bulk measurements were made by a continuous-flow isotope mass spectrometer
(Finnigan Delta Plus) via a Conflow II open split interface. Calibration for the total carbon and nitrogen isotope determination was done daily with an acetanilide standard. IAEA-N3 (KNO3)
was used as the standard for nitrogen. A laboratory internal standard (Peptone, Merck) was run for every sixth sample. The peptone standard indicated an analytical error associated with the isotope measurements of<0.2 ‰ for nitrogen-stable isotopes. Two replicates were analysed from each sample. Results have been published elsewhere [11]. Here we will describe only the additional steps for GC-C-IRMS analysis.
2.3 Sample preparation and GC-C-IRMS analysis
Analysis of stable nitrogen isotopes in individual amino acids was done for 20 samples as shown in figure 2. Samples were prepared for GC-C-IRMS analysis of amino acids by acid hydrol-ysis followed by derivatization to trifluor-acetylated-amino acid (TFA) esters [12]. In brief, between 10 and 50 mg of dried sample was placed in a 16×150 mm glass tube with a poly-tetrafluoroethylene (PTFE)-lined cap and hydrolysed with ultra pure 6μM (32 %) hydrochloric acid at 110◦C for 24 h. The hydrolysate was filtered through 0.2μm sterile glassfibre filters and evaporated to dryness with a rotary evaporator. Iso-propanol and acetylchloride (4:1) were added to the dried samples and esterification reaction took place at 110◦C for 1 h. After evap-oration to dryness under a gentle stream of N2gas, 500μl dichlormethane (DCM, ultrasterile,
H2O<0.001 %) and 500μl trifluor-aceticacid-anhydride were added (exotherm reaction).
Acetylation reaction took place overnight at room temperature (20◦C). The remaining liquid was dried under a stream of N2gas. Derivatized amino acids were solved in 500μl of DCM
and stored at 4◦C before GC-C-IRMS analysis within the next 7 days.
This preparation scheme allows the analysis of 13 common amino acids plus trans -4-(aminomethyl)-cyclohexanecarboxylic acid (internal standard). In the acidic milieu, theδ15N
values of asparagine and glutamine are only measured in mixture from the acids and the accompanying amides and could not be separated. To simplify matters, we will uniformly term them aspartic acid (asx) and glutamic acid (glx) in the following. Separation problems with the esterification/TFA derivatization method may occur for phenylalanine, lysine and tyrosine.
Here, peaks were clearly separated for tyrosine but not for phenylalanine and lysine. The advantage of this derivatization method compared with the esterification/acetylation method is that a relatively simple, rapid reaction set-up is possible for a two-step reaction without additional cleaning of the derivates [12].
The stable isotopic composition of nitrogen in TFA derivatives of amino acids were analysed by GC-C-IRMS (GC: HP 58590 series II, Hewlett Packard, USA; C: Combustion Interface; IRMS: MAT252). Mixes of amino acid derivatives from samples were injected into the GC, separated on a BPX5 (SGE) capillary column (50 m×0.32 mm inner diameter, 0.5μm film thickness; SGE, Australia), combusted, reduced and finally passed through the cold trap to remove water and CO2before introduction to the mass spectrometer. Nitrogen isotope ratios
for each amino acid in a mix were measured sequentially. Injections were done two to five times per sample splitless or in dilution of 15:1, 10:1, 5:1, 3:1 or 2:1 at 250◦C and contained 1–5μl of sample to optimize peak separation and shape. The GC temperature programme for each run was as follows: initially 50◦C, held for 1 min; increased at steps of 10◦C/min−1to
80◦C, the temperature was held for 5 min; increased from 80 to 210◦C at 3◦C/min, held for 5 min; increased from 210 to 280◦C at 15◦C/min, held at 280◦C for 5 min.
Standard mixtures of amino acids were run after every 10th sample through the entire analytical procedure to confirm that the sample processing including the hydrolysis and derivatization steps leads to complete derivatization of the amino acids by checking peak areas andδ15N values of the internal standard. The external standards then have been used
as correction standards. Analytical error associated with isotope measurements of mixtures of purified amino acids through our derivatization were <1 ‰ for external standards. As check on our sample processing, we added an internal standard (trans -4-(aminomethyl)-cyclohexanecarboxylic acid) to each sample before the hydrolysis step. Analytical error associated with our derivatization and analytical protocols were<0.3 ‰ for these internal standards. All natural samples were injected and analysed two to five times. Satisfactory anal-ysis of natural samples were accomplished for seven amino acids including alanine (ala), glycine (gly), leucine (leu), proline (pro), aspartic acid (asx), glutamic acid (glx) and tyrosine (tyr) with standard deviations<1.5 ‰. All isotope abundances are expressed inδnotation as follows:δX(‰)= [(Rsample/Rstandard)−1)] ∗103, where X is13C or15N and R is the13C:12C
or15N:14N ratio.
Stable nitrogen isotope data from different amino acids from this study as well as from the study by McClelland and Montoya [1] were used to relate theδ15N of the EAA leucine
to theδ15N of the NEAA alanine, aspartic acid, glutamic acid, glycine, tyrosine and proline.
The classification into EAA and NEAA was carried out after Guillaume [8]. The data from McClelland and Montoya [1] is the only other data set, besides this one, onδ15N in amino acids
from plankton size fractions. McClelland and Montoya [1] measured theδ15N of amino acids in
three plankton size fractions (250–500μm, 500–1000μm, 1000–2000μm) at two stations (21, 30) from the tropical NA. McClelland and Montoya [1] usedN-pivaloyl-i-propyl-amino acid esters that show small differences inδ15N values compared with the TFA esters as described by Hofmannet al.[12]. However, here we compare the ratios of their EAA versus NEAA δ15N values rather than the absoluteδ15N values in which case the different derivatization techniques may be disregarded.
3. Results 3.1 Hydrography
Stations 33a, 33 and 65 were in the vicinity of Mekong-influenced waters with surface salinities <33.2 (figure 1). The inshore stations 11, 12 and 21 had higher salinities of>33.9 (stations
11 and 12) and >34.2 (station 21) and lower temperatures of<28 C in the upper 100 m compared with salinities >33.0 (stations 33a and 33), >33.5 (station 56),>33. 1 (station 65) and temperatures<29◦C at the offshore stations (figure 3). The nitrate concentrations were depleted in the upper 40 m, except for stations 12 and 21, where only the upper 20 m were depleted (figure 3). Below the nutricline nitrate concentrations generally increased to >17μmol/l below 150 m. Chlorophylla(Chla) profiles showed subthermocline maxima at
Figure 5. δ15N of different amino acids from six plankton size fractions covering a size range from 55 to>2500μm comprised from both SWM seasons. Black circles (•) indicate the samples from upwelling influenced stations and open circles (O) from non-upwelling influenced stations. Black lines show the natural logarithm-regression lines.
40–50 m depths. Only at station 12, a surface maximum was found. Although an in–offshore trend was less visible from the vertical Chla profiles, the depth normalised (to maximum 70 m depth) integrated Chlaconcentrations showed higher values in the upwelling area with concentrations>0.5 mg/m2compared with offshore waters, thus reflecting the differences in
productivity (figure 4). In July 2003, the maximum value of 0.8 mg Chla/m2was much lower
than the maximum value during 2004 of 2.1 mg Chla/m2, indicating the weak upwelling
intensity during 2003. Stations 11 and 12 had integrated Chlavalues of 0.5 mg/m3compared
with slightly lower values around 0.3 mg/m3at stations 33a and 33 in July 2003. A stronger difference between in- and offshore values was found in July 2004, when station 21 had an integrated Chla value of 2.1 mg/m2 compared with<0.4 mg/m2 at stations 56 and 65. A detailed description of the hydrological situation during SWM has been published by Dippner et al.[13].
3.2 δ15N in plankton
Bulkδ15N values generally increased logarithmically with plankton size (figure 2). Plankton from upwelling influenced sites was 1.7–3 ‰ enriched in15N compared with plankton from outside the upwelling area during both years. In July 2004,δ15N values of the three smallest size fractions (55–166, 330–1000, 1000–1500μm) from the offshore sites were 2‰ lower than in July 2003, whereas theδ15N values from inside the upwelling area were rather similar between 4.5 and 6 ‰. Amino acid concentrations have not been analysed; however, we assume that the amino acid concentrations increased with plankton size as C:N ratios decreased from 7 to 4 from the smallest to the largest size fraction (data not shown). According to literature, all measured amino acids are most abundant in zooplankton compared with other amino acids, except for tyrosine which has been found in lower concentrations in zooplankton [14, 15].
δ15N in the amino acids alanine, aspartic acid, glutamic acid and leucine increased
logarith-mically with plankton size throughout the area (figure 5a–d).δ15N in tyrosine only increased
Figure 6. Correlations ofδ15N of different amino acid from six plankton size fractions from stations inside (filled symbols) and outside (open symbols) the upwelling area from SWM 2003 and 2004. Data points are comprised from six different plankton size fractions from SWM 2003 and 2004. Black lines give the linear correlations of the different ratios. For details, see table 1.
significantly in the upwelling area, whereas proline increased significantly only outside the upwelling area (figure 5f and g). In contrast to the other amino acids,δ15N in glycine did not
increase with plankton size (figure 5e). Although most of the seven amino acids increased with size like the bulk planktonδ15N, they did not reflect the lowerδ15N values outside the
upwelling area as found in bulkδ15N. Onlyδ15N in tyrosine followed this pattern and hadδ15N
values that were 2–6 ‰ depleted outside compared with inside the upwelling area (figure 5f).
3.3 δ15N
leu:δ15NNEAA
In the SCS data, theδ15N of alanine, aspartic acid glutamic acid and proline were highly
significantly correlated to theδ15N of leucine outside the upwelling area (figure 6, table 1).
Table 1. Regression equations (y) for linear correlations between theδ15N ratios of six different NEAAs and leucine from upwelling and non-upwelling sites.
Amino acid y d.f.(=n−2) r2 p-value Inside the upwelling area Alanine 1.7x−3.3 6 0.8665 <0.001 Aspartic acid 0.3x+4.1 6 0.6302 <0.05 Glutamic acid −0.01x+11.5 6 0.0001 n.s.
Glycine 0.5x+1 6 0.4045 n.s.
Tyrosine 0.02x+3.2 6 0.0024 n.s. Proline 0.2x+3.2 6 0.1486 n.s. Outside the upwelling area Alanine 1.3x+0.004 5 0.815 <0.01
Aspartic acid 0.8x+0.1 5 0.8421 <0.01 Glutamic acid 1x+2.5 5 0.8337 <0.01 Glycine 0.3x+0.9 5 0.3338 n.s. Tyrosine 0.3x−0.3 5 0.1976 n.s. Proline 0.7x−1.5 5 0.9418 <0.01
n, number of samples;r2, correlation coefficient;p, significance level; n.s., not significant. Degrees of freedom (d.f.) were
chosen according to Bärlocher [23].
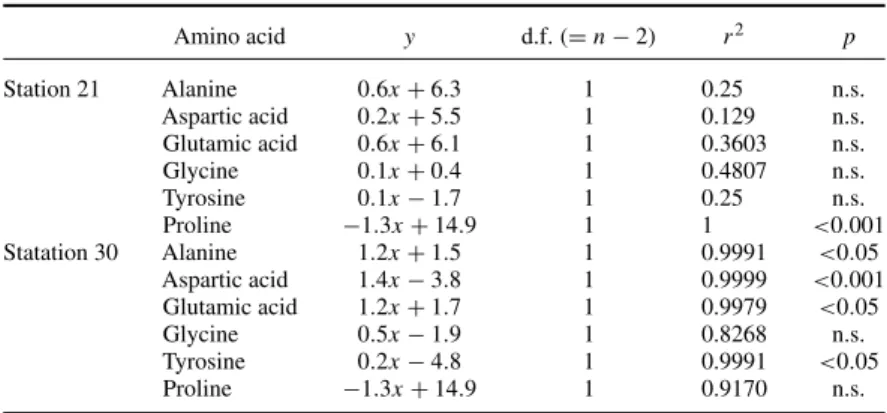
Figure 7. Correlations ofδ15N of different amino acid from three plankton size fractions (250–2000μm) from station 21 (closed symbols) and station 30 (open symbols) from the tropical North Atlantic from McClelland and Montoya [1]. For details, see table 2.
Table 2. Regression equations (y) for linear correlations between theδ15N ratios of six different NEAAs and leucine from stations 21 and 30 from the NA from McClelland and
Montoya [1]. Amino acid y d.f.(=n−2) r2 p Station 21 Alanine 0.6x+6.3 1 0.25 n.s. Aspartic acid 0.2x+5.5 1 0.129 n.s. Glutamic acid 0.6x+6.1 1 0.3603 n.s. Glycine 0.1x+0.4 1 0.4807 n.s. Tyrosine 0.1x−1.7 1 0.25 n.s. Proline −1.3x+14.9 1 1 <0.001 Statation 30 Alanine 1.2x+1.5 1 0.9991 <0.05 Aspartic acid 1.4x−3.8 1 0.9999 <0.001 Glutamic acid 1.2x+1.7 1 0.9979 <0.05 Glycine 0.5x−1.9 1 0.8268 n.s. Tyrosine 0.2x−4.8 1 0.9991 <0.05 Proline −1.3x+14.9 1 0.9170 n.s.
n, number of samples;r2, correlation coefficient,p, significance level; n.s., not significant. Degrees of
freedom (d.f.) were chosen according to Bärlocher [23].
In the upwelling area, correlations were found only forδ15Nleu:δ15Nala andδ15Nleu:δ15Nasp
(figure 6). The details of the regression lines are given in table 1. In the tropical NA, the correlations ofδ15N
leu:δ15NNEAAare statistically less significant due
to only three data points. Nevertheless, the different ratio patterns between data from station 30 compared with station 21 are striking (figure 7, table 2). Whereas at station 30 positive correlations between the ratios ofδ15N
leuto theδ15N of alanine, aspartic acid, glutamic acid
and tyrosine were found, no such correlations were found at station 21.
4. Discussion
4.1 Nitrogen bioavailability
Nitrogen fixation is indicative for nitrogen limitation of primary production and occurs at many marine sites when the water column is depleted in nitrate. N from N fixation may become an important additional N source also for higher trophic levels during nitrogen limitation as shown for the Baltic Sea [16]. The SCS of southern central Vietnam and the tropical NA are sites of intense nitrogen fixation [17, 18]. Zooplankton of Vietnam and in the tropical NA may receive up to 13 and 51 %, respectively, of its nitrogen from nitrogen fixation [11, 17]. The seven sampling stations in the SCS can be classified into two groups according to the distribution of temperature, salinity, depths of the nutricline, Chla concentration, primary production rates, N2-fixation rates and stable nitrogen isotopes in bulk plankton. The coastal
near stations 11, 12 and 21 are eutrophic sites of enhanced Chla concentrations (figure 4) since upwelling regularly fertilizes a 40–50 km wide strip along the coast off southern central Vietnam during summer monsoon [13]. The stations 33, 33a, 65 and 56 are oligotrophic sites outside this upwelling area and had a lower nutricline of up to 60 m depth (figure 3), low Chla concentrations (figure 4), decreased primary production rates and increased N2-fixation rates
[17] compared with inside the upwelling area. Primary production rates along the coast were 19 and 118 mmol C/m2/day in 2003 and 2004, respectively, and 20 and 37 mmol C/m2/day, respectively, at the offshore sites [17]. Mean N2-fixation rates along the coast were 42 and
19μmol N/m2/day in 2003 and 2004, respectively and 84.5 and 115μmol N/m2/day, respec-tively, at the offshore stations. Outside the upwelling area, bulkδ15N values in the plankton size fractions were generally 1–2 ‰ lower than in plankton from inside the upwelling area. This
pattern has been found during two monsoon seasons, whereas during intermonsoon season – when N2-fixation rates were low – no differences in bulkδ15N in the plankton size fractions
have been found in and outside the upwelling area as shown by Loicket al.[11]. The low δ15N values in the plankton size fractions have been interpreted as incorporation of N from
N fixation and its transfer into higher trophic levels through the food web in consensus with findings from the oligotrophic NA [18].
The δ15N values increased with plankton size at any site, although the increases in the
consecutive size fractions were smaller than the reported 2–3.5 ‰ increase generally attributed between consumer and diet [19]. This may have been due to the insufficient resolution of trophic levels and the overlap within one size fraction, species composition, food quality and quantity, N turnover or amino acid composition [11]. Despite these factors, only trophic fractionation can cause the general increase in δ15N with size and is confirmed by other studies [19, 20].
On the basis of these δ15N patterns in the plankton size fractions, we conclude that the nitrogen supply of the plankton community has been less favourable at the offshore sites than inside the upwelling area during both seasons. The offshore sites therefore may comply with the environmental perquisites to anticipate an enhanced coupling between the synthesis of NEAAs from EAAs in its plankton community. In the following section, these suggestions are discussed in the framework ofδ15N in amino acids.
4.2 Amino acidδ15N pattern
We found increasingδ15N values of the amino acids alanine, aspartic acid, glutamic acid and leucine with size at in and offshore sites (figures 5a–d). This is similar to the increase inδ15N of the total nitrogen values and can be explained by trophic enrichment [19]. An
increase inδ15N values of organic matter has been attributed to fractionation during
transam-ination and desamtransam-ination of amino acids [21, 22] and lab experiments showed that increases in 15N appear to be the greatest in amino acids that are extensively involved in nitrogen
transfer [1]. No increase with size was found for glycine (figure 5e). The values for tyro-sine increased significantly only at the inshore sites and for proline only at the offshore site (figures 5f and g). Besides trophic enrichment, differences in theδ15N of amino acids have also been related to the δ15N of the principal nitrogen source. Glycine and tyrosine were found to remain largely unaltered by trophic enrichment and may reflect theδ15N of nitrogen sources such as nitrate or N2[1]. The lowerδ15N values in tyrosine at the offshore stations
in the SCS therefore may reflect the additional incorporation of N2 (δ15N of 0 ‰) at these
stations compared with the principal use of nitrate (δ15N of 3.6 ‰) along the coast. This is in consensus with findings by Vosset al.[17] and Loicket al. [11]. The amino acidδ15N patterns from the SCS are very similar to those in plankton size fractions from stations 21 and 30 in the tropical NA by McClelland and Montoya [1]. The two stations in the tropical NA differed in the abundance of the cyanobacteriumTrichodesmiumspp. and theδ15N of total
nitrogen of different plankton size fractions. At the tropical NA station 30, high abundances of Trichodesmiumof 7×10⁶trichomes m2were found compared with<1×10⁶trichomes m2
at station 21 [2]. The isotope values of the total nitrogen from three plankton size fractions were generally 1.5 ‰ depleted at station 30 compared with station 21. McClellandet al.[2] interpreted this as an incorporation of nitrogen from nitrogen fixation into higher trophic levels at station 30 opposed to station 21 where nitrate seemed to have been the principal nitrogen source. We take their findings as an indication for more severe N limitation at station 30 compared with station 21. A coupling of the metabolism of NEAAs to the metabolism of EAAs therefore may have been enhanced in plankton from station 30 compared with station 21.
4.3 Ratios ofδ15Nleuvsδ15NNEAA
Despite the large environmental differences between the inshore and offshore sites in the SCS and stations 30 and 21 from the tropical NA, respectively, we found no differences in theδ15N distribution of amino acids in association with the plankton size. However, we found consistent differences in the correlation of theδ15N of the EAA leucine to theδ15N of the NEAAs from 20 samples from seven stations at sites of high and low nitrogen fixation in the SCS. The comparison with the independent data set from the tropical NA revealed intriguing similar patterns (figures 6 and 7). For the first time, it is shown that theδ15N of leucine is positively
correlated to the NEAAs alanine, aspartic acid, glutamic acid, proline and tyrosine at sites of enhanced nitrogen fixation (tables 1 and 2). No such correlations were found at sites of sufficient nitrogen supply for the planktonic food web. These differences cannot be explained with trophic enrichment or nitrogen source effects but (possibly) with a coupled amino acid metabolism between EAA and NEAAs. The metabolisms of the NEAAs are closely related to each other with glutamic acid in addition to 2-oxoglutarate, pyruvate and oxalacetate as central compounds for synthesis of proline, alanine and aspartic acid [9]. EAAs are excluded from recycling processes and have to be supplied with the food. Once incorporated, they can provide their amino group for the synthesis of NEAA. This mechanism leads to the observed correlation between theδ15N of leucine to theδ15N of NEAAs. However, a detailed explanation of individual results is beyond the scope of the present study, as the mechanisms are likely complex and largely unknown for zooplankton.
5. Comments and recommendations
This is the first time that theδ15N values of an EAA have been related to the δ15N values
of NEAAs. We found different correlation patterns of these ratios between sites of enhanced nitrogen limitation compared with sites of more favourable nitrogen supply from two tropical oceans. We hypothesise that the correlations between theδ15Nleuand theδ15NN EAAare the
con-sequence of a coupled amino acid metabolism between EAAs and NEAAs at sites of nitrogen limitation. In a next step, controlled laboratory experiments have to test this hypothesis.
Acknowledgements
We acknowledge the support of the captain and officers of RV Nghien Cuu Bienand the excellent cooperation with the working group of Matthias Kästner (UFZ). We thank Katrin Schmidt for encouraging discussions on the data. This work was funded by the Deutsche Forschungsgemeinschaft (DFG/Bo-768).
References
[1] J.W. McClelland, J.P. Montoya. Trophic relationships and the nitrogen isotopic composition of amino acids in plankton.Ecology,83(8), 2173–2180 (2002).
[2] J.W. McClelland, C.M. Holl, J.P. Montoya. Relating lowδ15N values of zooplankton to N2-fixation in the tropical North Atlantic: insights provided by stable isotope ratios of amino acids.Deep-Sea Res.I,50, 849–861 (2003).
[3] U. Båmstedt. Chemical composition and energy content. InThe Biological Chemistry of Marine Copepods, E.D.S. Corner and S.C.M. O’Hara (Eds), pp. 1–58. Clarendon, Oxford (1986).
[4] P. Mayzaud, R.J. Conover. O: N atomic ratio as a tool to describe zooplankton metabolism.Mar. Ecol. Progr. Ser.,45(3), 289–302 (1988).
[5] C. Guisande, I. Maneiro, I. Riveiro. Homeostasis in the essential amino acid composition of the marine copepod
Euterpina acutifrons.Limnol. Oceanogr.,44(3), 691–696 (1999).
[6] S. Helland, J.C. Nejstgaard, H.J. Fyhn, J.K. Egge, U. Båmstedt. Effects of starvation, season, and diet on the free amino acid and protein content ofCalanus finmarchicusfemales.Mar. Biol.143(2), 297–306 (2003). [7] G.-A. Paffenhöfer, W.S. Gardner Ammonium release by juveniles and adult females of the subtropical marine
copepodEucalanus pileatus.J. Plankton Res.6(3), 505–513 (1984).
[8] J. Guillaume. Protein and amino acids. In Crustacean Nutrition, L.R. D’Abramo, D.E. Conklin and D.M. Akiyama (Eds),Advanced World Aquaculture6, pp. 26–50. World Aquaculture Society Baton Rouge, USA (1997).
[9] A.L. Lehninger.Prinzipien der Biochemie, 1117. De Gruyter, Berlin, New York (1987).
[10] R.W. Sterner, J.J. Elser, D.O. Hessen. Stoichiometric relationships among producers and consumers in food webs.Biogeochemistry,17, 49–67 (1992).
[11] N. Loick, J. Dippner, H.N. Doan, I. Liskow, M. Voss. Pelagic nitrogen dynamics in the Vietnamese upwelling area according to stable nitrogen and carbon isotope data.Deep-Sea Res. I, (2007). doi 10.1016/j.dsr.2006.12.009. [12] D. Hofmann, M. Gehre, K. Jung. Sample preparation techniques for the determination of natural 15N/14N variations in amino acids by gas chromatography-combustion-isotope ratio mass spectrometry (GC-C-IRMS).
Isot. Environ. Health S.,39(3), 233–244 (2003).
[13] J. Dippner, K.V. Nguyen, H. Hein, T. Ohde, N. Loick. Monsoon induced upwelling off the Vietnamese coast.
Ocean Dynamics,57, 46–62 (2007). doi 10.1007/s10236-006-0091-0
[14] K. Schmidt, J.W. McClelland, E. Mente, J.P. Montoya, A. Atkinson, M. Voss. Trophic-level interpretations of tissue-specific fractionation and amino acid composition.Mar. Ecol. Progr. Ser.,266, 43–58 (2004). [15] R.G. Keil, M.L. Fogel. Reworking of amino acid in marine sediments: stable carbon isotopic composition of
amino acids in sediments along the Washington coast.Limnol. Oceanogr.,46(1), 14–23 (2001).
[16] C. Rolff. Seasonal variation inδ13C andδ15N of size-fractionated plankton at a coastal station in the northern Baltic proper.Mar. Ecol. Progr. Ser.,203, 47–65 (2000).
[17] M. Voss, D. Bombar, N. Loick, J.W. Dippner. Riverine influence on nitrogen fixation in the upwelling region off Vietnam, South China Sea.Geophys. Res. Lett.,33, L07604, (2006). doi: 10.1029/2005GL025569. [18] J.P. Montoya, E.J. Carpenter, D.G. Capone. Nitrogen fixation and nitrogen isotope abundances in zooplankton
of the oligotrophic North Atlantic.Limnol. Oceanogr.,47(6), 1617–1628 (2002).
[19] B.J. Peterson, B. Fry. Stable isotopes in ecosystem studies.Ann. Rev. Ecol. Syst.,18, 293–320 (1987). [20] B. Fry, R.B. Quinones. Biomass spectra and stable isotope indicators of trophic level in zooplankton of the
Northwest Atlantic.Mar. Progr. Ser.,112(1–2), 201–204 (1994).
[21] S.A. Macko, M.L. Fogel (Estep), P.E. Hare, T.C. Hoering. Isotopic fractionation of nitrogen and carbon in the synthesis of amino acids by microorganisms.Chem. Geol.,65, 79–92 (1987).
[22] L.Z. Gannes, C. Martinez del Rio, P. Koch. Natural abundance variations in stable isotopes and their potential uses in animal physiological ecology.Comp. Biochm. Physiol.119, 725–737 (1998).
[23] F. Bärlocher.Biostatistik – Praktische Einführung in Konzepte und Methoden, p. 206, Georg Thieme Verlag Stuttgart, New York (1999).


![Figure 7. Correlations of δ 15 N of different amino acid from three plankton size fractions (250–2000 μm) from station 21 (closed symbols) and station 30 (open symbols) from the tropical North Atlantic from McClelland and Montoya [1]](https://thumb-us.123doks.com/thumbv2/123dok_us/9924592.2885551/10.740.126.619.640.955/correlations-different-plankton-fractions-tropical-atlantic-mcclelland-montoya.webp)