I
Towards an understanding
of big data analytics as a
weapon for competitive
performance
Frank Danielsen
Vetle Augustin Framnes
SUPERVISORS
Dag Håkon Olsen
Polyxeni Vasilakopoulou Patrick Mikalef
University of Agder, 2017
Faculty of Social Sciences
I
"You can have data without information, but you cannot have information
without data." Daniel Keys Moran
III
Foreword
This master’s thesis report is the results of the work performed by two students from the master's degree programme in information systems at the University of Agder. Our collaboration started earlier when we worked together on our bachelor’s degree project and we continued working together throughout our master’s programme coursework.
The big data topic was something that caught our attention early in the first semester of the master's programme and our interest in the field has only grown, so much so that we decided to work on big data related themes whenever possible. Therefore, big data became our natural choice when choosing a theme for our master’s programme thesis.
The possibilities, the hype and the interest, from both an industry and academic perspective piqued our curiosity, which makes this topic an exciting choice. We are glad to work on relevant applied research that is needed and can be used to further understand the world of big data.
The progress we have made, and our ability to direct this research, is only possible because of the well-constructed master’s programme and the education provided by the supportive instructors and the edifying coursework. We especially want to thank our supervisors, Professor Dag Håkon Olsen (UiA), Associate Professor Polyxeni Vasilakopoulou (UiA) and Postdoc Patrick Mikalef (NTNU) who provided great help, guidance and encouragement. They were also great sparring partners throughout the project.
Finally, we want to thank our families and loved ones. Thanks for letting us devote time to this thesis even at the cost of precious family time. All academic articles that were reviewed, endless academic conversations about big data and countless hours of study have been a sacrifice you have also had to endure. It is clear that we would not be where we are without your loving support.
Kristiansand 29. May 2017
V
Abstract
Context: Big data has in the recent years been an area of interest among innovative organizations and has started to become a major priority for organizations in general, either through their own big data departments or by purchasing big data analyses from suppliers. Big
data analytics means more knowledge from more data sources and is by many prophesied to
be a contributing source of big change in how organizations receive their intelligence.
Purpose: This thesis investigates the connection between big data and competitive performance. This connection could be explained through the following two paths; 1) how big
data analytics contribute to making an organization more agile/dynamic and 2) how big data
analytics improves daily operations. To measure this, we looked at big data analytics capabilities, dynamic capabilities and operational capabilities in addition to competitive performance.
Methods: The methods that were used in this research was mainly of a quantitative type in addition to a qualitative case study and a two-phased literature review. We had to establish how to define and measure big data analytics capabilities. To do this we had to collect and review existing literature on big data analytical capabilities. We then had to do the same process with
dynamic capabilities, operational capabilities and competitive performance. Even if there were little to no examples of previous literature on the whole scope of our research area, there were jigsaw bits that contained important knowledge on the different parts of the research area. With the help of previous literature and our case study, a survey was created. This was sent to big organizations in Nordic countries, mainly from the Kapital 500 list of the biggest organizations in Norway and Forbes Global 2000 list, where we focused on the biggest organizations in the Nordic countries. Extensive work was put into sorting away organizations that did not use big data, and to get respondents that did. A total of 135 respondents completed the survey and 107 of those used big data solutions. We developed a model with four hypotheses to investigate the relationship between big data analytic capabilities and competitive performance through the mediating concept of dynamic capabilities and operational capabilities. We analysed the responses using structural equation modelling. Specifically, we used partial least square path modelling (PLS-SEM). The tool used to distribute the survey was SurveyGizmo and we used SmartPLS to analyse the data.
Results: Our analyses validated our first hypothesis which points to the positive correlation between big data analytics capabilities and dynamic capabilities to be significant. Further, the second hypothesis that stipulates the path from dynamic capabilities to competitive performance was significant. We also found significance on our third hypothesis which suggest a positive correlation between big data analytics capabilities and operational capabilities. We failed to find any significance on the fourth hypothesis which proposed that there is a positive correlation between operational capabilities and competitive performance. Also, we did not
VI find any significance on environmental factors moderating effect on the second and fourth hypothesis.
Conclusion:
Overall, our results shows that the concept of big data analytics capability is transformed into
competitive performance through the path of dynamic capability which can be seen as a mediating factor. This study contributes to better understand how big data analytics
investments are turned into competitive actions and will be particularly valuable for companies using big data.
Key words: big data analytics; big data analytics capabilities; dynamic capabilities; operational capabilities; competitive performance.
VII
Table of contents
Foreword ... III Abstract ... V 1. Introduction ... 1 1.1 Key concepts ... 2 1.2 Limitations ... 2 1.4 Contributions... 31.5 Content and structure ... 3
2. Theoretical foundation ... 5
2.1 Big data analytics capability ... 5
2.1.1 Tangibles ... 6 2.1.2 Human resources ... 7 2.1.3 Intangibles ... 8 2.2 Dynamic Capability ... 9 2.3 Operational Capability ... 11 2.4 Competitive performance... 12 2.5 Environment factors ... 12
3 Conceptual model and hypotheses ... 15
3.1 Conceptual model ... 15 3.2 Hypotheses ... 16 4. Research method ... 19 4.1 Research approach ... 19 4.1.1 Survey ... 19 4.2 Research design ... 20
4.3 Phase I: Preparation and model construction ... 21
4.3.1 Exploratory case study process ... 21
4.3.2 Literature review process ... 22
4.3.4 Construct Definition and Measures ... 28
4.4 Phase II: Execution ... 40
4.4.1 Method for collecting data ... 40
4.4.3 Method for analysing data ... 42
4.5 Research Ethics ... 48
VIII
5.1 Exploratory case study results ... 51
5.2 Survey Analysis and Results ... 52
5.2.1 Demographic data ... 52
5.2.2 Reliability and validity ... 53
5.2.4 Time Lag ... 59
5.2.3 Testing hypotheses ... 59
6. Discussion ... 63
6.1 Summary of research ... 63
6.2 Discussion of the research question and hypotheses ... 64
6.3 Discussion of the moderating and contextual factors ... 66
6.4 Discussion of the reliability and validity ... 66
6.5 Discussion of the other findings ... 67
6.3 Discussion of the research process ... 68
6.4 Theoretical and Practical implications ... 70
6.5 Limitations and future works ... 71
7. Conclusion ... 75
8. References ... 77
9. Appendix ... 85
Appendix 1: Articles included in the literature review ... 85
Appendix 2: Concept matrix - Literature review ... 87
Appendix 3: Image excerpt of the survey ... 90
Appendix 4: Research model ... 91
Appendix 5: Reliability and validity definitions ... 93
IX
List of illustrations
Figure 1: Conceptual model ... 15
Figure 2: Research design and strategy ... 20
Figure 3: Timeline plan for this research ... 21
Figure 4: The different stages of our article collection phase ... 25
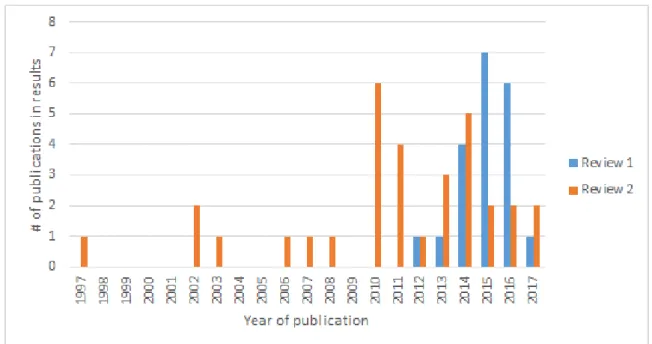
Figure 5: Article distribution by year... 26
Figure 6: The third-order construct of big data analytics capabilities ... 30
Figure 7: The second-order construct of dynamic capabilities ... 34
Figure 8: The second-order construct of operational capabilities ... 36
Figure 9: Competitive performance ... 37
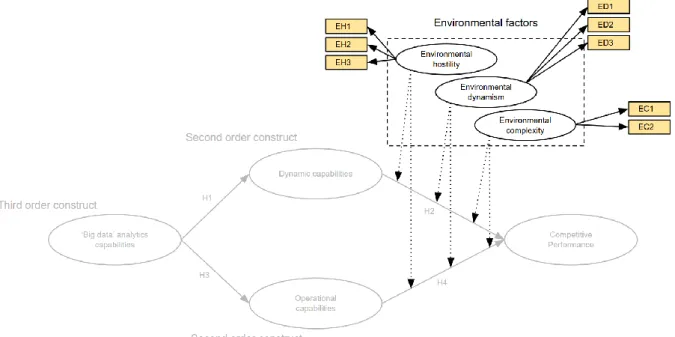
Figure 10: The environmental factors ... 38
Figure 11: Research model, weights and p-values ... 60
Figure 12: Excerpt from page one of the survey ... 90
Figure 13: Research model, after two-stage reduction ... 91
Figure 14: Research model, full version ... 92
List of tables
Table 1: The basket of eight... 23Table 2: Literature review search phrases ... 23
Table 3: Operationalizing demographic questions ... 29
Table 4: Operationalizing basic resources, data and technology ... 31
Table 5: Operationalizing technology skills and managerial skills ... 32
Table 6: Operationalizing organizational learning and data-driven culture ... 33
Table 7: Operationalizing sense, seize and transform ... 35
Table 8: Operationalizing marketing capabilities and technological capabilities ... 37
Table 9: Operationalizing competitive performance ... 38
Table 10: Operationalizing environmental factors ... 39
Table 11: Reliability and validity, rules of thumb ... 44
Table 12: Action plan, outer model ... 44
Table 13: Action plan, inner model ... 47
Table 14: Demographic data ... 53
Table 15: Formative indicators value ... 54
Table 16: Formative measurement second and third-order construct ... 55
Table 17: Composite reliability, Cronbach's alpha and indicator reliability ... 56
Table 18: Cross loadings ... 57
Table 19: Fornell-Larcker criterion ... 57
Table 20: Heterotrait-monotrait ratio ... 58
Table 21: Simplified inner model ... 58
Table 22: Effect size (f2) and (q2) on competitive performance (CP) ... 58
Table 23: Moderating effect on DC to CP and OC to CP ... 59
Table 24: Time lag, measured differences ... 59
X
Table 26: Articles from Literature review (part A) ... 85
Table 27: Articles from Literature review (part B) ... 86
Table 28: Concept matrix from literature review 1/2 (part A) ... 87
Table 29: Concept matrix from literature review 2/2 (part A) ... 88
Table 30: Concept matrix from literature review (part B) ... 89
1
1. Introduction
During the first Techonomy Conference in 2010, Eric Schmidt, Google’s CEO at the time, said: "there were 5 exabytes of information created between the dawn of civilization through 2003, but that much information is now created every 2 days." (Kirkpatrick, 2010). In other words, we generate volumes of personal and public data at a rapidly expanding rate. Due to worldwide diffusion, use of mobile devices, social networks and the advancement of "Internet of Things", we leave behind an astonishingly large digital footprint every day. This abundance of public data has attracted interest amongst scholars and practitioners who refer to the phenomenon as
big data (Wamba, Akter, Edwards, Chopin & Gnanzou, 2015).
The phase big data is more than just a catchphrase that describes a large amount of data. Today, data is generated at the speed of thought and via a wide variety of sources that collects and disseminates the structured, semi-structured and unstructured information stream (Russom, 2011). These kinds of characteristics pose a major challenge for companies who wants to extract insight from such disordered public data. Technological advances, and particularly big data analytics, have nevertheless made it possible to retrieve information from every type of data. Big data analytics can create business value through increased transparency, predicting customer needs, creating adaptive business models and supporting, or even replacing, human decision making (Wamba et al., 2015). Big data analytics can thus provide organizations with a competitive edge through the creation of an information-based arsenal.
There is a clear association between a company’s performance and their competitive advantage. Research has shown that IS investments alone cannot improve a company’s performance metric, but established IT capabilities may at define a company’s performance (Kim, Shin, Kim & Lee, 2011). We are not alone in our belief that companies need to develop distinctive
big data analytics capabilities in order to capitalize on their big data analytics investments (Gupta & George, 2016; Wamba et al., 2017).
Furthermore, we take the stance adopted by other scholars who believe dynamic capabilities
and operational capabilities can explain the source of sustained competitive advantage. The purpose of this study is to understand the mechanisms that unite big data and competitive
performance by proposing the following research question:
"By what paths are big data analytics capabilities transformed into Competitive Performance"
2 The research question was answered through an extensive study consisting of two phases. The first phase was initiated to establish a conceptual framework and model that could later be tested for generalisability to a larger population. To do this, we studied theory through a systematic literature review and collected empirical data through six semi-structured depth interviews with companies that had adopted big data.
In the second phase, data from 107 big data-using companies in the Nordic region were collected through a survey and then analysed.
1.1 Key concepts
‘Big data’ and 'Big data analytics' are two terms often used by academia and business organizations. We use the following definitions for the remainder of the thesis:
Big data is about gathering, storing, managing and accessing the necessary data for analytics (Espinosa & Armour, 2016). The data could consist of large structured, semi structured and unstructured data sets that require new forms (untraditional solutions) of processing capability to enable better decision making (Emani, Cullot & Nicolle, 2015; Garmaki, Boughzala & Wamba, 2016; Wamba et al., 2015). Examples include e.g., social media, radio-frequency identification (RFID) tags, smart phones, and sensors (Gupta & George, 2016).
Big data analytics is about technologies (e.g., database and data mining tools) and techniques (e.g., analytical methods) that a company can employ to analyse large scale, complex data (Kwon, Lee & Shin, 2014) and report insights not attainable with past data technologies (Garmaki et al., 2016). These technologies can include data management (massively parallel-processing databases), often open-source programming (Hadoop, MapReduce), statistical analysis (sentiment analysis, time-series analysis), advanced visualization tools that help structure and connect data to uncover hidden patterns, anomalies, unknown correlations, and other actionable insights.
1.2 Limitations
This research is focused on how big data analytics capabilities affect dynamic and operational capabilities and indirectly affects competitive performance. We chose those two paths based on previous literature. It may most likely exist other paths that big data analytic capabilities
correlates with competitive performance but we chose to examine dynamic and operational sides of an organization.
We measure competitive performance by asking respondents to self-report on questions related performance in comparison to their competitors. There might be other ways to measure performance, for instance, to view the profitability from each organization or by viewing other facts. The problem that occurs by doing it this way might be "old numbers", unavailable data or wrongfully information. Then again, self-reported answers might contain biased answers. Ultimately, the literature support the self-reporting as the best way to measure our variables.
3 Our survey contains quite a few questions, a total of 67. Our model is quite massive and to secure enough respondents we had to minimize measurements on our variables, often resulting in three questions per variable (with a few that only had two questions).
1.3 Motivation and benefits
Organizations know that they can attain great value from big data. The first step in achieving this goal is to develop knowledge about the capabilities an organization could acquire versus what results to expect. In addition to satisfying our personal curiosity, we also enhance our big data competencies. There is also great satisfaction in knowing that we are contributing to big data research, especially when it is a needed, wanted and still a relatively unexplored area.
1.4 Contributions
Since this master thesis focuses on the association between big data analytics capabilities and
competitive performance, the expected output of this work is to better understand how organizations use big data and how much this increases their competitive performance. Also, to identify the kind of factors that affect or moderate the links will broaden the understanding and strengthen the results. We believe this is a somewhat uncharted territory and a study is needed to obtain a deeper understanding of big data solutions in organizations.
1.5 Content and structure
The rest of this report is constructed as follows; Chapter two constitutes the theoretical foundation that this research relies on. In chapter three we propose our conceptual model along with the hypotheses. Chapter four summarizes the applied methodology used throughout the study. Chapter five presents our findings and in chapter six, these findings are reflected upon by using prior literature practical implications. Lastly, chapter seven contains the conclusions of this study. The report then presents the references and attachments.
5
2. Theoretical foundation
The theoretical foundation of this thesis is based on an extended literature review and an empirical, explorative case study on the use of big data analytics in Norwegian and Italian companies. The first part of the literature review (part A) was conducted in parallel with the case study and the second part (part B) was carried out subsequently.
Part A answered the following research question: “what assets facilitate the use of big data
solutions”? This is a fundamental question to understand the factors that lead to big data analytics initiatives. The same question was also used for the exploratory case study that formed the basis for the article “Big data analytics capabilities: Antecedents and Business Value” (Mikalef, Framnes, Danielsen, Krogstie & Olsen, 2017) which were submitted and accepted into the Pacific-Asia Conference on Information Systems 2017 conference (PACIS 2017, 2017).
Reflections made during this early phase led to further refinement of the research question, which guided us to expand the theoretical point of view. Part B was then carried out to further define competitive performance, dynamic capabilities and operational capabilities. We became aware of these concepts during part A.
The literature review and the exploratory case study were conducted through a rigorous and systematic process. The results from these studies were used to develop the overarching research model. These research model components are detailed in the sub sections below and they include: big data analytics capability, dynamic capability, operational capability, competitive performance and environmental factors.
2.1 Big data analytics capability
To acquire business value from big data analytics investments requires investments into big data analytics capabilities (Gupta & George, 2016). Garmaki et al. (2016) define BDAC as an organization's ability to exploit the combination of data and IT components with the goal of achieving competitiveness. In recent years, several researchers have focused their attention on systematically sorting and understanding these capabilities. In part A of the literature review we found broad support for Wamba et al. (2017)’s suggested model of big data analytics capabilities The model included three principle factors: expertise capabilities, management capabilities, technology skills. As we reviewed additional theories, we discovered new capabilities that were important. These include organizational skills (e.g., data-driven culture, organizational agility or organizational analytics capabilities), presentation capabilities and top management support. These competencies did not fit into Wamba’s framework. Therefore, we decided to use Gupta and George (2016) ’s framework as the basis for our description of
6 BDAC. We define the elements of Gupta and George (2016) framework in the sections that follow.
2.1.1
Tangibles
Gupta and George (2016) describe tangible resources as items “that can be sold or bought in a market”. The paper mentions examples like financial resources and physical assets. These assets are then divided into basic resources, data and technology.
Data
An important part of big data analytics capabilities is access to big data. Business organizations are becoming more and more aware of the value of data. Gupta and George (2016) surmise that the growth in business data utilization rate is directly related to the big data
growth rate. Five data types are identified: public data, private data, data exhaust, community data, and self-quantification data.
The definitions of these data types are source-specific. For example, Gupta and George (2016) refer to accessible data (e.g., non-personal data) when they define the following data types.
• Public data are often free data provided by either governmental institutions, private organizations or individuals.
• Private data are organization-owned data.
• Data exhaust represents data with no or little value in its own context but might provide valuable intel when connected to other data.
• Community data are, for instance, Facebook, Twitter and other social media generated
data.
• Self-quantification data are data generated from wearable technologies like smart
watches, fitness bands and the like (George, Haas & Pentland, 2014). Data can be further divided into external and internal data:
• Internal data are organizational data created by the organizational processes. Examples are inventory updates, sales, transactions or other internal processes.
• External data are data from external sources, either public, private but achievable through buying or trading, community data among others (Gupta & George, 2016; Zhao, Fan & Hu, 2014)
Gupta and George (2016, p. 4) state that “firms interested in creating big data analytics capabilities must integrate their internal and external data”. Often, business do not want to share proprietary data, even within its own organisation. Departmental issues can also bring about resistance to sharing and merging data across the organization. These problems highlight the need for support from business leaders to establish norms and standards that facilitate more transparent data policies. Particularly in cases when data will not only benefit individual departments, but become available to the whole company (GalbRaith, 2014). Big data analytics
solutions are performing now-casting analytics, which is a prediction of the present. In order to accurately now-cast, data access should be real-time or as close to real-time as possible (Akter, Wamba, Gunasekaran, Dubey & Childe, 2016).
7
Technology
In addition to have access to data from all above-mentioned sources, there is a need for technology that is able to handle and support analytical processes of those data, even if it is gigantic, diverse and fast-moving (Gupta & George, 2016). The systems should also support data handling that is required to, for instance, handle data as a data lake, where organizations collect data at a fast pace, both from internal and external sources.
Gupta and George (2016)State that as much as 80% of the data that companies hold have an unstructured format. As a result, relational database technology becomes an insufficient solution (Garmaki et al., 2016) More sophisticated technological solutions are needed in this case. Technologies such as Hadoop, which is a Java-based open-source framework, consequently appeared to tackle this type of data (Gupta & George, 2016). This is because many big data technologies support Hadoop. Emani et al. (2015) suggest using technologies that easily interface with Hadoop. This is also supported by interviews from our exploratory case study. Scalable infrastructure options are needed because of the data growth; a high data growth rate often requires parallel extensions of computer power (Emani et al., 2015).
Basic resources
Gupta and George (2016) explain the importance of investing both time and economical resources into big data analytics capabilities. Interviewees from our exploratory case study confirmed this and explained that since big data is a relative new phenomenon, the nature of how you operate analytical processes with big data requires testing, learning, searching, failing and patience. Tallon, Ramirez and Short (2013)further suggest that investments into big data
should be separate from other IT investments since these big data investments, if bundled with other IT investments, might undermine other strategic IT projects.
2.1.2
Human resources
Technical skills (technical knowledge) and managerial skills (technology management capability, business knowledge and relational knowledge) are the two most important skills as stated by Gupta and George (2016) and other prior IT capability researchers (Kim et al., 2011; Wamba et al., 2017). Further description of these two groups of skills follow.
Technology skills
This refers to skills required to extract value or intelligence from big data. Competencies like 1) understanding, operating and even modifying systems like Hadoop, 2) machine learning, 3) data scrubbing, 4) statistical analysis and 5) data extraction are examples of these skills (Gupta & George, 2016). Those abilities are rare for individuals trained in non-technical business fields and difficult to absorb, both for an organization and for individuals who are not trained in science, technology, engineering and mathematics (STEM). This is therefore a major business challenge for organizations who want to benefit from big data since they have to either hire new employees with those competencies and train them to learn about the non-technical field or invest in an existing employee to learn the required competencies by sending them to school (Chen, Chiang & Storey, 2012). Although this challenge might change or disappear over time, acquiring these advanced competencies will require significant investment, patience and time. Journeyman-level technical skills that are more commonplace, like competencies in database
8 management, typesetting languages, soft skills analysis or business enterprise systems are also skillsets that fall under big data management (Akter et al., 2016). These types of skills are easy to extend in a short period by hiring recent business school graduates with specific technical coursework or training current employees via online classes or short courses/seminars (Gupta & George, 2016).
Managerial skills
Unlike most technology skills, managerial skills are developed on-the-job and over time. Managerial skills are also industry-specific, tacit and heterogeneously dispersed across organizations (Gupta & George, 2016). This is an important component of big data analytics capabilities since managers need to have a good understanding of how to apply big data analytics. results. There needs to be good communication and collaboration between the management team, management levels and department staff to fully exploit the business value
big data analytics creates. Akter et al. (2016)suggest that big data management solutions are necessary to support business-oriented goals. They suggest that there are two types of managers: technology managers and “ordinary” managers. Both managers need to have good business understanding and knowledge. Wamba et al. (2015) point out that managers need to ensure that data scientists are familiar with and concerned about typical business topics/issues. They should also know how to use appropriate business vocabulary and have good interdepartmental communication skills to better understand how to use, track and report big data analytics results (Janssen, van der Voort & Wahyudi, 2017).
2.1.3
Intangibles
Teece (2015, p. 119) suggests that intangible resources are central to an organization's performance, especially in dynamic markets. These resources have no clear or visible boundaries and are highly context-dependent (Mata, Fuerst & Barney, 1995; Teece, 2014). They do not “travel” well and are hard to mimic. Exceptions do exist though, like tradable copyrights, trademarks, patents and the like. Gupta and George (2016) divide intangible resources into two sub categories: organizational learning and data-driven culture. This will be explained in the following paragraphs.
Organizational learning
One side of organizational learning is the ability to reconfigure resources according to changes brought on by possibilities or forced by external dynamic environmental situations. Big data
solutions might predict market trends that encourage internal changes to achieve continuous
competitive performance. Therefore, the added value drives the organizational need for (Grant, 1996; Teece, Pisano & Shuen, 1997). Gupta and George (2016) argue that data analytics does not tell the whole story and organizations with higher organizational knowledge will likely have an advantage when making decisions based on or supported by big data analytics results. Another view of organizational learning involves improving an organization’s day to day processes and learning how to incorporate big data analytics into those processes. The more organizations can see and perfect the seamless integration of big data, the higher competitive advantage they might achieve. This was discovered in our exploratory case study while interviewing several organizations in the media industry. Media organizations that had an established system in place to use big data solutions in their daily operations had an advantage
9 over the ones that were lagging. There was a broad agreement that, in this industry, it is necessary to use and make progress with big data analytics usage. In fact, their survival depends on it.
Data-driven culture
Organizational culture is an intangible and is very hard to understand and describe; therefore, it is difficult to replicate. The definition among some researchers proclaim that organizational culture is the glue of an organization, while others say it encompasses almost all areas of an organization (Gupta & George, 2016). Recent research supports that organizational culture is tightly connected with success of big data initiatives (LaValle, Lesser, Shockley, Hopkins & Kruschwitz, 2011; Ross, Beath & Quaadgras, 2013). To get the most value from big data, there must be an inherent trust in the results: that they are correct, and that intuition and personal beliefs don’t eclipse or contradict the decision-making process that is based on analytical results; particularly when decisions are influenced by individuals, as there might not be any personal gain from big data investments (Gupta & George, 2016; McAfee, Brynjolfsson, Davenport, Patil & Barton, 2012; Quaadgras, Ross & Beath, 2013).
2.2 Dynamic Capability
A key question in the field of strategic management is how organizations can achieve and sustain competitive advantage (Teece et al., 1997). This question has led to many different theories. One of the theories currently receiving a lot of attention is the ‘resources-based view of the firm’ (RBV), which sees firm resources as the source of competitive advantage. By obtaining resources that are valuable, imperfectly mobile and heterogeneously distributed across firms, the firm can attain superior performance and a sustained competitive advantage (Mata et al., 1995). However, RBV has received criticism, over the years, for ignoring factors that surround these resources. Essentially, the opinion is that RBV provides information that is static and does not provide solutions or give guidance about how future valuable resources should be acquired or how the resource base can be renewed. This shortcoming has fuelled the theoretical footing of the dynamic capabilities concept. The concept emerged in the 1990’s and has since progressively evolved to become one of the most influential approaches to management research of our time (Ambrosini & Bowman, 2009; Schilke, 2014b). The dynamic capabilities theory aims to explain how organizations can continually acquire valuable, competitive resources that match or change the marketplace (Wheeler, 2002).
The concept has, since it was first introduced, been developed further. The stream of literature has shared several definitions and concept breakdowns. Teece et al. (1997, p. 517) define
dynamic capabilities as “the ability to integrate, build, and reconfigure internal and external
competencies to address rapidly changing environments”. Winter (2003, p. 991) define
dynamic capabilities as “those that operate to extend, modify or create ordinary capabilities”. Another, more recent definition supported in the literature is based on the work by Helfat et al. (2009, p. 1), which states: “the capacity of an organization to purposefully create, extend or modify its resource base” (Fainshmidt, Pezeshkan, Frazier, Nair & Markowski, 2016; Kim et al., 2011; Protogerou, Caloghirou & Lioukas, 2012). The definitions show that there is a
10 consensus about the DC construct. This reflects that organizational processes are on a common basis, and have the role of changing the company’s resource base.
In a time of global markets, new technologies arise and new competition is bred. Modern companies must be alert and able to respond to potential threats or opportunities in the market by developing and using dynamic capabilities (Roberts, Campbell & Vijayasarathy, 2016). New and innovative solutions may put an end to established ways of doing work and businesses that are unable to adapt, could be eradicated. By using dynamic capabilities, businesses can become adaptable and escape unfavourable path dependencies, thereby achieving evolutionary fitness (Teece, 2007). The more often companies engage in sensing and transforming activities, the better their dynamic capabilities will become and the more it will be integrated into the organizational memory (Wilden & Gudergan, 2015). In environments characterized by change, even dynamic capabilities can become worthless. Companies therefore need to evaluate and renew their capabilities from time to time (Schilke, 2014b).
There has also been an ongoing discussion about what environment dynamic capabilities yield most value from. Teece et al. (1997) pointed out that there is an obvious value in obtaining
dynamic capabilities in rapidly changing environments. Several researchers have extended this point-of-view by expressing that dynamic capabilities are primarily of value in turbulent environments (Ferrier, Holsapple & Sabherwal, 2010; Wilden & Gudergan, 2015). According to Pavlou and El Sawy (2011), the literature has presumed that dynamic capabilities have no value in stable environment. They may even be detrimental. They further point out the misconception by showing that dynamic capabilities can only have a positive impact throughout the whole spectrum of environmental turbulence.
The concept is often divided into three connected activities, which are sensing, seizing and transforming.
Sensing
An important part of dynamic capabilities is the ability to sense threats and opportunities in the environment. In order to discover such threats or opportunities, it is essential for companies to frequently scan both 'local' and 'distant' markets and technologies (Roberts et al., 2016; Teece, 2007). To identify opportunities, employees must have access to information about the entire business ecosystem and be able to understand latent demands from customers. The information used as a basis may originate from a variety of sources, such as a conversation at an industry meeting, from news or feedback from frustrated customers (Teece, 2007). The use of technology can provide a lot of valuable information and thus strengthen the organization's sensing ability (Roberts et al., 2016).
Seizing
The sensing capability is of no value if the organization is unable to respond to what is being observed. An equally important characteristic of dynamic capabilities is therefore the ability to seize the identified opportunities. Seizing activity implies evaluation of various options to accommodate the identified opportunity. The option should acquire marketplace acceptance (Wilden, Gudergan, Nielsen & Lings, 2013). Careful planning is an essential part of seizing
11 and it usually involves more intensive resources than the sensing activity, which can be a low-cost activity (Teece et al., 1997).
Transforming
To benefit from sensing and seizing activities, the company's asset orchestration must be reconfigured to achieve better utilization. The transforming characteristic of dynamic capabilities implies the company's ability to adjust their capabilities in response to changes (Wilden & Gudergan, 2015). Organizational change is usually a costly affair, so companies must develop effective change processes to mitigate low pay-off changes. The ability for a company to transform and reconfigure its resource base is itself a learned skill. The more experience and the more practice, the more manageable it becomes (Teece et al., 1997; Wilden & Gudergan, 2015).
2.3 Operational Capability
An organization’s operational capabilities, sometimes referred as ordinary capabilities, is a collective description of an organization's ability to “make a living” (Drnevich & Kriauciunas, 2011) or to convert inputs into outputs (Wilden & Gudergan, 2015). Contrary to dynamic capabilities, operational capabilities is connected to technical fitness and not evolutionary fitness (Li, Shang & Slaughter, 2010). Higher operational capabilities helps organizations to execute operations more efficiently and therefore achieve greater technical fitness (Li et al., 2010). Many organizations do not understand that IT can enable dynamic capabilities. The focus on IT is as an enabler of high-level operational capabilities. Operational capabilities
only offers short-term temporary advantages and organizations could probably lose those advantages as changes occur in the environment (El Sawy & Pavlou, 2008). Teece (2007) found that if an organization lacked dynamic capabilities, it could still make a (good) competitive return for a short period. It cannot sustain “supra-competitive” returns in the long-term. Winter (2003, p. 992) has said “[the] archetypical enterprise [have] competencies/resources but [lack] dynamic capabilities [that] will in equilibrium ‘earn a living by producing and selling the same product, on the same scale and to the same customer population’”. Then again, if there is a significant, tacit, non-inimitable component of an organization's superior operational competence, it has the potential to support superior performance, even for a limited time (Teece, 2007). Wu, Melnyk and Flynn (2010) support this by saying that operational capabilities has emerged gradually over time and is not easy to mimic. Often, it is transferred to future generations by teaching (i.e. internships). Wilden and Gudergan (2015) divides operational capabilities into marketing and technological capabilities. Marketing capabilities is, for instance, market knowledge, customer relationships and distribution channels. Technological capabilities consider the efficiency of the internal processes in an organization, how well they handle day to day operations, technical expertise and equipment. When improving operational capabilities, the industry ‘best practise’ may provide greater results and advantages, even though “best practises” are widely imitable, and don't offer heterogeneity (Drnevich & Kriauciunas, 2011). Operational capabilities appears to have a foundation of a firm’s operations (Drnevich & Kriauciunas, 2011).
12
2.4 Competitive performance
The abovementioned capabilities (big data analytics capabilities, dynamic capabilities and
operational capabilities) affect an organization's performance. Research literature often focus on performance, to some degree, as our literature review revealed. Several different ways were proposed to define performance and measure it. Some methods define and measure performance (e.g. financial performance, operational performance, market performance or product/service performance) as increased/decreased efficiency and productivity based on history (Chang & Gurbaxani, 2013; Pavlou & El Sawy, 2011). Other methods proclaim that the best way to define performance is via comparison to relevant competitors (Ferrier et al., 2010; Rai & Tang, 2010). Other terms and definitions have surfaced, for instance, competitive performance (Ferrier et al., 2010; Lim, Stratopoulos & Wirjanto, 2011; Lu & Ramamurthy, 2010; Rai & Tang, 2010)or competitive advantage (Drnevich & Kriauciunas, 2011; Li & Liu, 2014; Li et al., 2010). A description of competitive performance provided by Rai and Tang (2010)states that it is an ability to capture market share, remain profitable, keep growing, and be innovative and cost-efficient in comparison to major competitors. Sometimes the time dimension is also accounted for in, for example, the overall financial performance over the past few years (Kim et al., 2011). Organizations might have a competitive advantage in some business activities and disadvantages in others. For instance, they could have advantages when it comes to achieving product effectiveness (quality and innovativeness) and disadvantages when it comes to process efficiency (time to market and low cost) (Drnevich & Kriauciunas, 2011). Therefore, these factors should always be considered since competitive performance is a complex concept.
2.5 Environment factors
Studies have supported the notion that the effect of capabilities on performance can be affected or moderated by environmental factors (Chen, Preston & Swink, 2015; Chen et al., 2014; Rai & Tang, 2010; Wilden et al., 2013). Both in RBV theory and in dynamic capabilities theory, scholars have conducted empirical investigations on the effects environmental factors have on organizations (Chen et al., 2014; Li & Liu, 2014). Some scholars divide the organizational environment into dynamism (or stability), complexity (or simplicity) and hostility (or munificence) (Chen et al., 2014; Li & Liu, 2014). Environmental factors can also moderate
big data analytics capabilities (Chen et al., 2015), operational capabilities (Pavlou & El Sawy, 2011; Wilden & Gudergan, 2015) and dynamic capabilities. While some scholars proclaim that environmental factors decide if dynamic capabilities have organizational value (Chen et al., 2015; Wilden et al., 2013), others have provided research that shows dynamic capabilities can add value through the entire spectrum of environmental turbulence (Li & Liu, 2014). Pavlou and El Sawy (2011) have also done research to establish the positive moderation effect that environmental factors have on the relationship between dynamic capabilities and competitive performance.
13
Environmental hostility
Organizations operate in environments with some grade of hostility. Zahra and Garvis (2000) describes this observation as the existence of unfavourable external forces in the organization's business environment. This can again lead to, for instance, radical changes in the industry, more intense regulatory burdens or fierce rivalry among competitors (Chen et al., 2014; Dess & Beard, 1984; Werner, Brouthers & Brouthers, 1996). Other impacts could be high taxes, lack of knowledge and education in the population, which leads to a lack of staff competence, fragile infrastructure, economic instability and workforce insecurity. Chen et al. (2014) argues that this might hinder developing capabilities (e.g., IT capabilities) which in turn staggers an organization's ability to be agile and flexible. Chen further explains that hostile environments also lead to greater restrictions in communication, formal procedures and centralization of strategic decision-making. This could have a negative effect on both big data analytics capabilities, where big data might be prevented in lightening decision-making and easing strict centralization of decision-making, and dynamic capabilities, where agility might stagger because of rules, procedures and slow, formal decision making.
Environmental dynamism
An environment that is dynamic might be a negative moderator between an organization's ordinary, day to day processes and competitive performance. Li and Liu (2014, p. 2795) explains that “dynamism is interpreted as unpredictability, that is, the rate of change and innovation in an industry as well as the uncertainty or unpredictability of actions by customers”. Other researchers describe environmental dynamism as the rate of unpredictability of an environment. Dynamism can mean changes to, for instance, product/service obsolescence, technology change, competitors’ moves, and shifts in customer demand (Chen et al., 2014). In
dynamic capabilities theory, environmental dynamism is a key situational parameter that affects the grade of correlation between dynamic capabilities and competitive performance
(Chen et al., 2015). Teece et al. (1997) propose that dynamic capabilities are directly counteracting environmental change, which makes creating a competitive advantage difficult since many changes occur simultaneously. Maintaining previously gained competitive benefits (Chen et al., 2014). Li and Liu (2014) also supports this statement by adding that in very high competitive environments, resources are difficult to obtain and therefore the agility of an organization can contribute to short term advantages. On the other hand, less competitive environments might not hinder long term advantages even in an organization that lack agility. So, even if there might be some use of dynamic capabilities in a less turbulent environment, scholars, like Li and Liu (2014), point to the natural connection between environmental dynamism and dynamic capabilities.
Environmental complexity
Environmental complexity is the heterogeneity and diversity of external factors. It occurs in terms of diversity of customer buying habits, nature of competition and product lines (Chen et al., 2014; Newkirk & Lederer, 2006). Competition might enable or strengthen environmental complexity since organizations struggle in environments that is comprised of finite resources. Thus, the more competitors there are, the higher the competitive intensity among the organizations (Wilden et al., 2013). Managers of organizations with complex environments are
14 concerned with more factors than those that operate in more simple environments (Chen et al., 2014). Thus, managers have more difficulties with their decision making in the higher-complexity environments. Chen et al. (2014) also found that managers have difficulties making fundamental changes and opt for making smaller-scale decisions in these environments.
15
3 Conceptual model and hypotheses
We created a research model based on our research question, the literature review and our exploratory case study. This model represents the relationships among key constructs in our research area. To help explain the connection between the variables in the model, a hypothesis was constructed. The following sections describe the model and theory in detail.
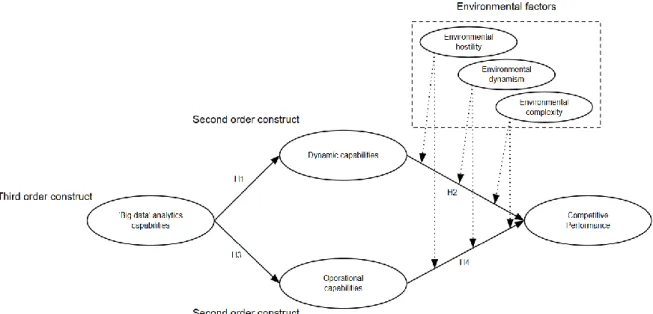
3.1 Conceptual model
To ensure the quality of our model, we developed a model that leverages prior (empirical and theoretical) research so that all the elements of our model were extensions of established principles. Early in the project, we designed a trial model that we could adapt as our knowledge expanded. By developing the model in this adaptive way, we ensured that our research model did not disregard prior work in the field. Additionally, implementing our own empirical work and data increases the reliability and validity of our model. See figure 1 for the conceptual model.
16
3.2 Hypotheses
The next step after developing a model is to determine a hypothesis. The connection between
big data (or big data analytics capabilities) and performance (or competitive performance) could now be explained by mediating variables. To be able to test if there was a correlation effect between the model’s elements, four hypotheses were created. These are presented in the following section.
Hypothesis 1
In today’s technological business environment, we leave digital footprints in almost every activity we perform. If analysed, these remaining bits and bytes may provide great business insight. However, the vast amounts of information surpass the human processing ability. By using information technology to tackle such informational resources, firms can obtain knowledge assets (Chi, Ravichandran & Andrevski, 2010). Assets like these enhance the sensing, seizing and transforming capabilities of managers; enabling them to better capture market intelligence, accelerating their decision-making processes, making better decisions based on real-time data, respond to changes in the market and swiftly reconfiguring the resource base accordingly (Chi et al., 2010; Roberts et al., 2016).
By using big data analytics, companies are capable of extracting insight from vast amounts of recurring data and a variety of formats (Garmaki et al., 2016).
Success stories of big data analytics implementations in the literature has created a gold-rush-like atmosphere (Espinosa & Armour, 2016). Some companies' adoption of big data analytics
can be explained by the concept of isomorphism, which denotes the pursuit of similarities with competing companies. Moreover, some companies’ IT innovation and adoption is affected by the adoption of the same concept in a well-known company, regardless of the rationality of doing so (Kwon et al., 2014). Business insight does not emerge automatically simply by applying technical big data analytics solution to data (Sharma, Mithas & Kankanhalli, 2014). To capitalize on big data and big data analytics investments, companies should invest in big data analytics capabilities which incorporates the organizational ability to utilize data assets (Espinosa & Armour, 2016; Garmaki et al., 2016).
We therefore postulate the following hypothesis:
H1: “There is a positive correlation between big data analytics capabilities and dynamic capabilities”
Hypothesis 2
The potential competitive performance that companies gain by developing their dynamic capabilities does not likely stem from functionality (e.g. various forms of analytical tools).
competitive performance is usually acquired in the open market and is thus accessible by competitors. The potential value is located in the new resource configuration that is derived from the insight that dynamic capabilities provides. By being able to sense, seize and transform the resource base according to the threats and opportunities in the market, companies can continue to search for new temporary advantages (Chen et al., 2015). Dynamic capabilities can increase the speed, effectiveness and efficiency of the company to better accommodate for
17 upheavals in the environment (Drnevich & Kriauciunas, 2011). Outstanding dynamic capabilities are therefore expected to improve the firm’s competitive performance (Kim et al., 2011).
We therefore postulate the following hypothesis:
H2: “There is a positive correlation between dynamic capabilities and competitive performance”
Hypothesis 3
In addition to using big data analytics to enhance an organization's ability to be agile, we believe big data analytics can be used to enhance the organization's day to day routines. When looking at big data analytics as a source of information, those analytic results can be used in, for instance, advertising placement or by sales staff needing “evidence” when generating sales (this was an example that surfaced during interviews in our explorative case study). Another example is that big data analytics can lead to greater optimization of transportation resources. This could therefore enable faster and better asset utilization over time (Chen et al., 2015). As Gupta and George (2016) suggest, big data analytics capabilities affects the results provided by big data analytics and as Kim et al. (2011) also suggest, capabilities derived from IT generally affect performance through operational capabilities.
We therefore postulate the following hypothesis:
H3: “There is a positive correlation between big data analytics capabilities and operational capabilities”
Hypothesis 4
Stronger operational capabilities is a more efficient and economical way of performing day to day tasks. It enables organizations to surpass less strong organizations, which provides the strong company a competitive advantage (Li et al., 2010; Roth & Jackson III, 1995; Wilden & Gudergan, 2015; Wu et al., 2010). This advantage is temporary, short term (El Sawy & Pavlou, 2008; Teece, 2007). operational capabilities can provide an organization with technical fitness but not evolutionary fitness (Teece, 2007). By using big data analytics based solutions an organization can achieve even stronger operational capabilities (e.g. by advertising placements, better assets resource scaling or other intelligence related to increase efficiency and decrease costs). This was observed in our exploratory case study as well as supported in the literature review (Chen et al., 2015).
We therefore postulate the following hypothesis:
H4: “There is a positive correlation between operational capabilities and competitive performance”
19
4. Research method
In this chapter, we explain the choice of method used to answer our research question, which is "By what paths are big data analytics capabilities transformed into competitive performance ".
"A method is a procedure, a means of solving problems and developing new knowledge. Any means that serves this purpose belongs to the arsenal of methods" (Hellevik, 2011, p. 12, Our own translation).
In accordance with the above definition, we first present the research approach, research design and timeline. Then we present phase one. This phase contains methods used in the initial exploratory case study, the literature review process, operationalising the model’s variables and a description of how we planned to secure reliability and validity of the survey. After this, we present phase two. This phase contains methods for collecting and analysing data. Model reliability and validity is also presented here, but this time in more detail and with focus on the analysing stage. Finally, we explain our view and goals regarding research ethics.
4.1 Research approach
Initially, we performed an exploratory qualitative study to become more familiar with the concept and the phenomenon of big data in organizations. This study had an intensive research strategy where we examined a small group of organizations in depth. The results of this study and the parallel conducted literature review (part A) helped further shape the agenda for the research in this study.
To answer the formulated research question, we considered it appropriate to use a quantitative approach with an extensive research strategy where we examined many units with few variables (Hellevik, 2011, p. 111). Thus, a priority of width rather than depth. The study can be seen as deductive, where our hypotheses are based on theoretical knowledge from the literature. As we want to test our model that was deductively divided we adopted a quantitative approach. This approach fits the requirements for collecting empirical evidence that can be used to evaluate the hypotheses and thus enlighten research question.
4.1.1 Survey
In this study, we have mainly used a survey as a strategic approach to answer our research question. The study is also a triangulation of the strategies since we have applied both a case study and a survey strategy. The survey aims to obtain the same kind of data from a larger group of people in a systematic manner and thereby looks for statistical patterns and ultimately generalizes the results for a larger population (Oates, 2006, pp. 35, 37).
20
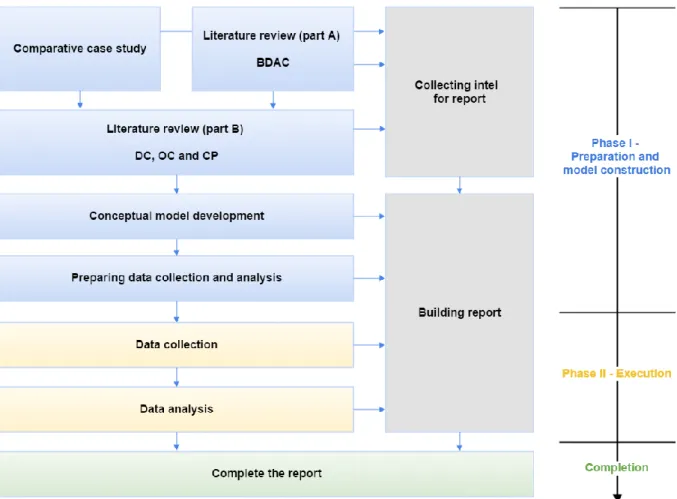
4.2 Research design
The research design shows our action plan to collect and process data needed to answer our research question. As shown in the graphical representation (see figure 2), the plan was divided into two phases in addition to a completion phase for refinement. The first phase (Phase I) consisted of the initial exploratory case study, the literature review, the conceptual model development and the collection protocol and data analysis plan. In other words, all the planning and preliminary work was accomplished prior to the data collection. The second phase (Phase II) consisted of the execution of the data collection and -analysis. As soon as the survey was sent out, it was no longer possible to make changes. We therefore worked a lot in Phase I to ensure that we would collect the appropriate data. The transition to the second phase can thus be a "point of no return". Throughout both phases, we worked on structuring and building this report so that it would reflect the work that was done.
21
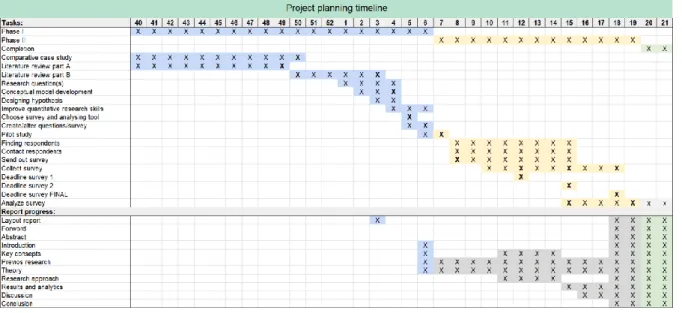
Project planning timeline
To successfully conduct a research project of this magnitude, a plan needs to be made with a list of milestones. The plan is an important component to maintain control of all components of the research, from preparations and sub-studies to analysing the results and preparing the discussion goals. This implies constructing and following a timeline with milestones and goals. This also contributed to ensuring steady progress while providing time for reviewing, rewriting and quality assurance. See figure 3 for our plan.
Figure 3: Timeline plan for this research
4.3 Phase I: Preparation and model construction
In this section, we explain the key parts of the process that have shaped our understanding and provided a foundation for the quantitative study. First, we explain the procedure for our case study and the systematic literature review. Next, we explain how the survey questionnaire was designed and how the concepts are defined and operationalized. Lastly, we explain how we secured reliability and validity to the questionnaire.
4.3.1 Exploratory case study process
In parallel to the thorough literature study, an exploratory case study was conducted as a part of this master's thesis. It is sometimes necessary to identify elements that is considered important in the quantitative research through the use of another research method (Oates, 2006, pp. 35, 36). In our case, it was necessary to investigate organizations' use of big data and learn how they utilized big data analytics and the value added by the practice. By searching for people who worked with big data via the business- and employment-oriented social networking service, LinkedIn, we got in touch with several organizations. We selected six interview subjects who were willing to be interviewed. These interviews were conducted face-to-face in five of the six cases. The last one, an organization in Italy, was performed through Skype.
22 The interviews lasted approximately one hour and were based on a semi-structured interview guide (Oates, 2006, p. 188). This guide was prepared with the aim to provide us insights on the actual use of big data analytics in organizations. Specifically, we were interested in exploring: Data (e.g. type of data, durability of data and quality of data), Technology (e.g. analytical tools and advanced data visualization (ADV) tools), Organizations (e.g. involved roles in the big data initiative, top management support, data-driven culture, challenges and strategies) and Performance (e.g. potential benefits, different usage and ability adopt to new insight). The semi-structured interview guide developed and matured for each interview as we found interesting results.
The interviews were transcribed and then sent to the interview subjects for validation. This also provided an opportunity to add changes or introduce new responses and comments. When all were approved, we analyzed our transcripts with the aim to trance communalities and differences among interviewees and overall, with the aim to advance our understanding of the domain. This analysis process was based on Creswell (2014, p. 247)'s suggested procedure. Since it was limited to six interviews the coding of the interviews was done manually and not through software tools like, for instance, Nvivo. Then, themes and descriptions were sorted and examined for interesting findings and similarities between the different interviews.
4.3.2 Literature review process
Reviewing prior literature of relevance is a key component in any academic project. By conducting cumulative research, theory building is facilitated. Additionally, research areas that are well-studied are further validated and areas where more research are needed is uncovered (Webster & Watson, 2002). The backbone of this thesis is therefore deeply rooted in prior research. The amount of literature and scientific papers out there is overwhelming. Thus, ensuring sound research at the literature review stage is difficult. By managing the literature in a systematic manner, the review phase is feasible and possesses a high level of quality. Such a systematic approach also helps to avoid so-called “cherry picking” of articles, where the researcher picks literature that speaks in favour of personally established ideas.
There are several papers with pragmatic guidelines to carry out a systematic literature review. Inspired by such papers, a proper systematic approach was chosen and applied to our literature review. The steps of the review method are documented below.
Planning
There are two important factors to consider when searching for articles. Firstly, the sources that are to be used should be determined (e.g. which conferences and journals to include). As the major contributions are likely to be found in the leading journals (Webster & Watson, 2002), the process of collecting articles for both parts of the literature review were aimed towards the “Senior Scholar’ Basket of Journals” also known as “basket of eight”. This is a well-known compilation for the field of information systems, consisting of eight high quality journals (Association for Information Systems, 2011). The electronic databases Google Scholar and Oria were used to trawl the different journals for articles. An overview of the included journal can be seen in table 1.
23 Table 1: The basket of eight
Secondly, one must ensure that the search phrases used yields articles of relevance for the topic of interest. Based on the research question, the phrases were carefully selected by listing out possibilities and performing trial and error searches. To ensure the quality of the search phrases, they were also evaluated in terms of relevance prior to the initiation of the search process. The search strings used for the two parts of the review are shown with explanations in table 2. Table 2: Literature review search phrases
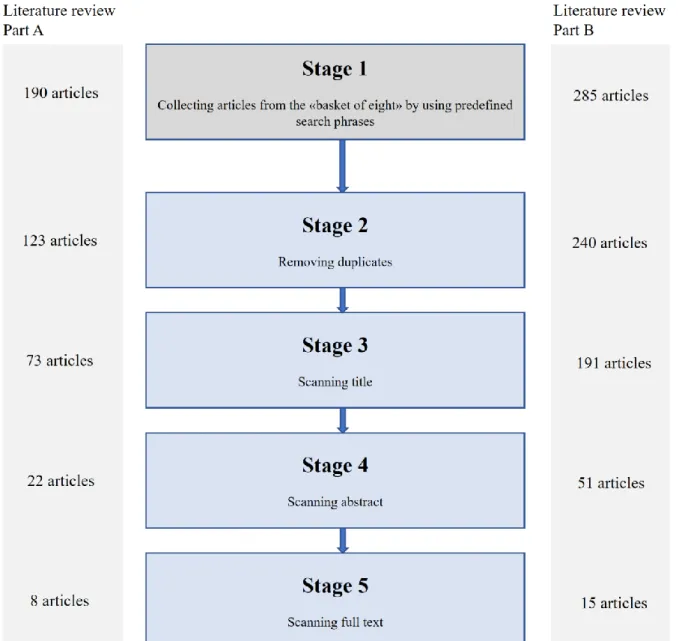
Searching
After having compiled sets of search phrases, they were iteratively used to retrieve published articles from the specified outlets. At this stage, all the search results were included to accumulate a relatively complete census of the relevant literature. This led to a plethora of gathered articles. In figure 4, we provide information on the number of articles identified in the two parts of our literature review and the way we processed them. All the gathered articles were fed into tables with attributes such as name, author, year, journal and which search string that generated the article.
Literature selection
By using this collection method, it is conceivable that some of the search results are not relevant to the research question, even if the search phrases are present in the text of the article. Therefore, the collected articles were manually reviewed to assess the relevance. To facilitate this filtering process, we developed a set of inclusion and exclusion criteria for both parts of the literature review. Articles that met one of the defined inclusion criteria were included as
24 primary studies. On the other hand, the articles that met one of the exclusion criteria were excluded from the study. The inclusion and exclusion criteria are shown below.
In part A, peer-reviewed articles on the following topic were included: I1: Articles that focus on big data and relate to the research question. Furthermore, articles on the following topics were excluded:
E1: Duplicate articles (multiple entries of the same article).
E2: Articles with a solely technical focus.
E3: Articles that mention the search phrases, but in a context that cannot be related to our research question.
In part B, peer-review articles on the following topics were included:
I1: Articles dealing with a thematic scope that can be linked to our research question.
Articles on the following topics were excluded:
E1: Duplicate articles (multiple entries of the same article).
E2: Articles published before 2002.
E3: Articles that mention the search phrases, but in the context of what cannot be related to our research question.
Unlike part A of the literature review, which exclusively dealt with articles about big data, we also considered research that did not reflect on this theme in the second part. By doing so, we chose a more concept centric approach to gather literature. This allowed us to also see how related ‘business intelligence’ (BI) solutions affected performance which could be useful in shaping hypotheses.
Due to the youth of the field of big data, there was no need to incorporate any time constraints in part A of the literature review. The literature on dynamic capabilities, operational capabilities and competitive performance is on the other hand larger and stems from a more mature field. It was therefore considered necessary to refine the time period in which the articles were published. A timespan of 15 years was selected as appropriate to get a sufficient portion of the literature in the field. The year 2002 thus became a delimiter for exclusion. The filtering process for both parts (A and B) of the review started out by removing duplicate articles. In part A, this resulted in 67 removed articles and in part B, 45 articles were removed. From there, we scanned and evaluated the relevance of the article title. 50 articles were removed from part A and 49 were removed from part B. Shortly thereafter, we read through the abstract of the articles. At this stage, another 51 articles were peeled off part A and 140 off part B. In the final step of the filtration process, we read through the remaining articles, which