ISSN: 2088-8708, DOI: 10.11591/ijece.v8i5.pp2661-2670 2661
Probabilistic Performance Index based Contingency Screening
for Composite Power System Reliability Evaluation
Venkata Satheesh Babu K.1, Madhusudan V.2, Ganesh V.3 1
Department of EEE, Jawaharlal Nehru Technological University Anantapur, India
2Department of EEE, Vallurupalli Nageswara Rao Vignana Jyothi Institute of Engineering &Technology, India 3
Department of EEE, JNTUA College of Engineering, India
Article Info ABSTRACT
Article history:
Received Dec 22, 2017 Revised Jan 22, 2018 Accepted Aug 11, 2018
Composite power system reliability involves assessing the adequacy of generation and transmission system to meet the demand at major system load points. Contingency selection was being the most tedious step in reliability evaluation of large electric systems. Contingency in power system might be a possible event in future which was not predicted with certainty in earlier research. Therefore, uncertainty may be inevitable in power system operation. Deterministic indices may not guarantee the randomness in reliability assessment. In order to account for volatility in contingencies, a new performance index proposed in the current research. Proposed method assimilates the uncertainty in computational procedure. Reliability test systems like Roy Billinton Test System-6 bus system and IEEE-24 bus reliability test systems were used to test the effectiveness of a proposed method.
Keyword:
Composite power system Probabilistic performanceIndex Contingency analysis
RBTS
Reliability evaluation
Copyright © 2018 Institute of Advanced Engineering and Science. All rights reserved. Corresponding Author:
Venkata Satheesh Babu K., Department of EEE,
Jawaharlal Nehru Technological University Anantapur, Ananthapuramu, Andhra Pradesh, India.
Email: [email protected]
1. INTRODUCTION
Electricity is one of the greatest innovations of mankind. With unprecedented progression in population worldwide it is indispensable commodity of modern days. The economic growth of a nation is strongly coupled with its per capita energy consumption, which is only possible with a robust power system. Reliability is the measure of robustness of electric power system. Reliability, Security, and Stability were closely related terms often misinterpreted among researchers. As commendably outlined in [1], Power system reliability completely depends on its security, which further depends on its stability. Hence, security and stability were subsets of reliability. Security and stability were assessed by verifying the functioning of the system for a given set of operating conditions. However, reliability was being judged only by considering the time averaged performance over a reasonable period of time, generally over a year. So, security and stability were time varying attributes whereas reliability was time-averaged characteristic of electric power system.
Reliability assessment of bulk electric power system comprises the following steps: a. Selection of system states
b. Evaluation of adequacy of states c. Computation of reliability indices
State space is gigantic for a practical interconnected power system. For instance a power system with ‘n’ components has 2n states. It may be highly cumbersome task to select and assess the enormous state space, which necessitate extreme computational endeavor. Several practises were proposed in earlier research for condensing the state space. Contingencies were ranked based on the severity of voltage degradation to
condense state space [2]. Bound estimates for evaluating the extremity of the contingencies may further lessen state space [3]. Misclassification of state space was considered as the masking effect in contingency screening algorithms. Research carried out by [4] deploys an adaptive procedure for compensating the masking effect in contingency classification heuristics. A contingency ranking table, indicating more or less events, for minimizing state space was employed by [5]. Chan KW et.al, [6] developed an online algorithm of system instability studies for considerable amount of reduction in state space with dynamic security contingency screening.
Singular value analysis of load flow jacobian was used for ranking the contingencies with regard to voltage collapse to reduce the state space effectively [7]. Idea of integrating operators experience in contingency selection for decreasing the state space was proposed [8]. Artificial neural networks were also explored for contingency ranking. Fuzzy logic based MW ranking for contingency selection was explored [9]. He J et.al, [10] took an advantage of combining state enumeration and Monte Carlo simulations, by exercising state space partitioning method. Further, feed forward neural network was employed for online contingency screening [11]. Support vector machines along with scalar performance indices were exploited to rank contingencies according to the severity [12]. Ali Mansouri et.al, [13]investigated the impact of direct load control on nodal reliability of a deregulated power system. Saeed Afshar et.al, excersised preventive maintenance for electrical distribution system deliberating ageing [14].
Earlier research was centered on computation of deterministic performance indices and development of ANN based manipulating techniques for those indices. But, contingency by definition has a great degree of uncertainty imbibed in it. Previous methods employed deterministic indices which does not guarantee randomness in computation, which was the major problem never been addressed. Proposed Probabilistic index or Probabilistic Performance Index (PPI) integrates randomness in the process of its computation. In the current research investigations PPI method is proposed, which may be practical for contingency screening of power system.
2. COMPOSITE POWER SYSTEM RELIABILITY EVALUATION
There were two conventional methods available for calculating the reliability of composite power system:
a. Monte Carlo Simulation Techniques b. Analytical Methods
Monte Carlo methods of simulation computed the reliability indices by considering random characteristic of the system. These methods considered the problem as a sequence of experiments. In analytical methods, a mathematical model was being used to characterize the system and reliability indices were computed from the model. In the current research paper, state space enumeration approach is adopted. Analytical methods and Monte Carlo methods were having own advantages and disadvantages as discussed in [15], [16].
Computational time required for obtaining indices was relatively lesser in analytical techniques. Particular simplifying assumptions may be needed when the system became complex and large. Also, simulation methods may need long time for the computation.
2.1. State space enumeration method
Set of all possible outcomes of a random phenomenon can be designated as state space. In other words, combination of individual states of various components like generators, transmission lines, and load may be termed as state of a power system. The state space of a power system is represented as vector X.
X={x1, x2,…, xn} (1)
where, x1, x2,…, xn are states of individual components like generators and transmission lines
A system state in state space enumeration method may be designated by present state and transition that can occur between states. System state indicates the present working condition of working, failed, maintenance, etc. Change in state may cause the transition from one state to another. Such possible combination of all states makeup the system state space. Ideally, for precise assessment of power system reliability, entire contingency states of all orders needs to be considered. But it might be practically impossible task for assessing all contingencies. For example, RBTS-6 bus test system with 11 generators and 9 transmission lines, total number of states needed are 220 (i.e. 10,48,576)for the assessment.
To minimize the effort of a tedious task, numerous approximations and methods were developed. Truncation of State-Space (TSS) was proposed in the earlier research to decrease the computational burden [17]. In the TSS method, states with insignificant probabilities were excluded in state enumeration procedure.
Further, truncation is carried out on supposition considering that the probabilities of states denoting a large number of overlapping failures and lower number of failures. It was contemplated that probabilities of states with overlapping failures may be negligible when compared with probabilities with lower number of failures [1]. It was observed a great reduction in the number of states to be assessed and possibility for assessment in large variety of systems with the aid of suitable computer program [17]. Earlier, conventional methods of contingency ranking used the concept of Performance Index (PI) as described in Equation 2.
PI =∑ �Pflowl Plmax� 2n n l=1 (2) where,
𝑃𝑓𝑙𝑜𝑤𝑙=the MW flow on line ‘l’
𝑃𝑙𝑚𝑎𝑥=maximum flow on line ’l’
Once power flows were under the limit (rated line capacity), then larger values of ‘n’ leads to smaller value for PI. PI may be greater when one or more lines are overloaded in the power system. Contingencies were ranked based on the magnitude of the PI values. Contingencies below the threshold were discarded due to insignificant contribution for reliability. However, the earlier concept of performance index suffers certain shortcomings. The real power values used for computation of PI were absolutely deterministic. There was no uncertainty in earlier computations. Also, the computation of PI was dependent on exponent selection. Smaller values of exponent caused the masking effect. Greater the value of exponent lesser was the chance of misclassification of states and that was considered as masking effect [4]. In addition, larger value of exponent gives rise to nonlinearity. Accordingly, former research investigations disclosed that optimum integer selection for exponent will highly influence the PI calculation and further affects the contingency ranking [18].
3. PROPOSED METHODOLOGY
In the current research investigations, a new index is proposed that overcomes aforementioned shortcomings. Though the computational procedure is laborious vis-à-vis conventional Performance Index (PI), the ranking of contingencies is quite promising. The proposed index is designated as Probabilistic Performance Index (PPI) and is defined in equation 3.
PPI =∑𝑛𝐾=1𝑡𝑜𝑁�𝑊𝑌� 𝑗=1 � 𝐿𝑘𝑗𝐹𝑗 𝐿𝑚𝑎𝑥� 𝑌 (3)
where: W =Real non-negative weighting factor Y =Order of the exponent
N =No. of buses n =No. of contingencies
Lkj =MW curtailed at kth bus for jth contingency
Fj =Frequency of failure for jth contingency
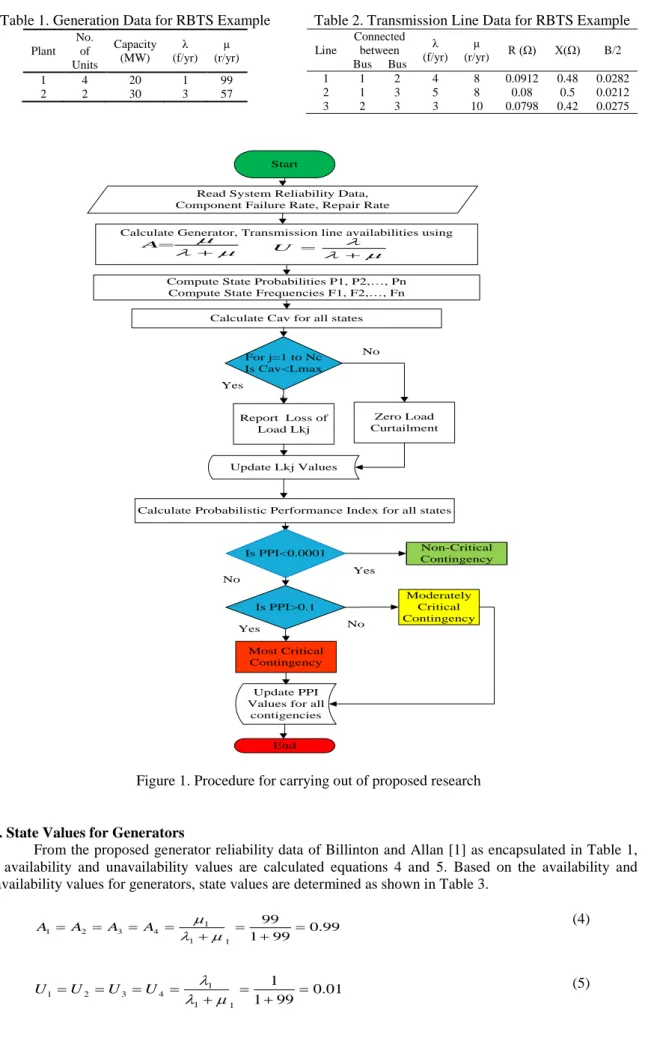
Value of the weighting factor (W) may be taken as 1. Order of exponent (Y) has to be optimally selected. Lower or higher values for Y may result in masking and nonlinearity problems in ranking the contingencies, respectively. The procedure for computation of PPI is illustrated in the following section. It was proposed to carry out research studies in a systematic manner as shown in Figure 1. Initially it was planned to gather the reliability data, component failure rate, repair rate for the test power system network. Henceforth, generator and transmission availabilities were calculated [1]. Further, state probabilities and state frequencies were computed and available capacity (Cav) was calculated for different states. Finally, PPI is determined and contingencies were screened for composite power system.
4. COMPUTATION OF PROBABILISTIC PERFORMANCE INDEX
In this section, the process of PPI calculation is illustrated by considering a small 3 bus Roy Billinton Test System (RBTS) [1]. Table 1 shows summary of generation data and Table 2 shows summary of transmission data for Roy Billinton Test System (RBTS).
Table 1. Generation Data for RBTS Example Table 2. Transmission Line Data for RBTS Example Plant No. of Units Capacity (MW) λ (f/yr) μ (r/yr) 1 4 20 1 99 2 2 30 3 57 Line Connected
between (f/yr) λ (r/yr) μ R (Ω) X(Ω) B/2 Bus Bus
1 1 2 4 8 0.0912 0.48 0.0282 2 1 3 5 8 0.08 0.5 0.0212 3 2 3 3 10 0.0798 0.42 0.0275
Start
Read System Reliability Data, Component Failure Rate, Repair Rate
Calculate Generator, Transmission line availabilities using
Compute State Probabilities P1, P2,…, Pn Compute State Frequencies F1, F2,…, Fn
Calculate Cav for all states For j=1 to Nc Is Cav<Lmax Report Loss of Load Lkj Zero Load Curtailment Yes No Update Lkj Values
Calculate Probabilistic Performance Index for all states
Is PPI<0.0001 Is PPI>0.1 Non-Critical Contingency Most Critical Contingency Update PPI Values for all
contigencies Moderately Critical Contingency End Yes No Yes No µ λ µ+ = A µ λ λ+ = U
Figure 1. Procedure for carrying out of proposed research
4.1. State Values for Generators
From the proposed generator reliability data of Billinton and Allan [1] as encapsulated in Table 1, the availability and unavailability values are calculated equations 4 and 5. Based on the availability and unavailability values for generators, state values are determined as shown in Table 3.
99 . 0 99 1 99 1 1 1 4 3 2 1 = = = =λ +µ = + = µ A A A A (4) 1 0 . 0 99 1 1 1 1 1 4 3 2 1= = = = λ +µ = + = λ U U U U (5)
Table 3. State values for generators State values for plant 1 (4 generators) Units Down Units Considered Probability 0 A1A2A3A4 0.96059601 1 4*(U1A2A3A4) 0.03881196 2 4*(U1U2A3A4) 0.00058806 3 4*(A1U2U3U4) 0.00000396 4 U1U2U3U4 0.00000001 State values for plant 2 (2 generators) Units Down Units Considered Probability 0 A1A2 0.9025 1 2*(U1A2) 0.095 2 U1U2 0.0025
4.2. State Values for Transmission Lines
From the proposed transmission line reliability data of Billinton and Allan [1] as encapsulated in Table 2, the availability and unavailability values are calculated equations 6 and 7.
99636033 . 0 1095 4 1095 1 1 1 1 =λ +µ = + = µ A (6) 00363967 . 0 1095 4 4 1 1 1 1 = λ +µ = + = λ U (7)
Similarly, A2, U2, A3, and U3 are computed. Summary of availability and unavailability values for transmission lines are tabulated in Table 4.
Table 4. Summary of Transmission Line Availabilities Line No. Availability Unavailability
1 A1=0.99636033 0.00363967 2 A2=0.99545455 0.00454545 3 A3=0.99658703 0.00341297
4.3. State Probabilities
Most of the probabilistic applications in power system reliability assessment assume that component failures within a fixed atmosphere are independent events. When component failures are independent, then system state probabilities may be available by the product of unit state probabilities. From the state values of generators and transmission lines, state probabilities are computed as follows.
State 1: with all components in service
P1=(0.96059601x0.9025x0.98844633)=0.85692158 (8)
State 2: with G1 out, all lines in service
P2=(0.03881196x0.9025x0.98844633)=0.03462309 (9)
Similarly, other state probabilities are calculated and tabulated using availability and unavailability values for transmission lines as shown in Table 5.
4.4. State Frequencies
During steady state, frequency of encountering a state is equal to frequency of exiting from the state. This concept is known as frequency balance approach [19]. Using frequency balance approach, state frequencies may be computed as,
Fj=Pj* (transition rate) (10)
Also, from the state values of generators and transmission lines, the state frequencies are computed as follows. State 1: with all components in service
F1=P1 * (4λG1+2 λG2+ λL1+ λL2+ λL3)=0.85692158(4+6+4+5+3)=18.85227476 (11) State 2: with G1 out, all lines in service
F2=P2 * (3λG1+ μ g1 +2 λG2+ λL1+ λL2+ λL3)=0.03462309 (3+99+6+4+5+3)=4.15477080 (12) Similarly, other state frequencies are calculated and tabulated as given in Table 5.
Table 5. State Values for Transmission Lines Lines Out Lines considered Probability
0 A1A2A3 0.98844633 1 U1A2A3 0.00361076 2 A1U2A3 0.00451345 3 A1A2U3 0.00339509 1,2 U1U2A3 0.00001649 1,3 U1A2U3 0.00001237 2,3 A1U2U3 0.00001546 1,2,3 U1U2U3 0.00000006
Amount of load curtailed for each contingency may be obtained using capacity available for each contingency and maximum load curtailed equation 13.
𝐿𝑘𝑗 =𝐶𝑎𝑣− 𝐿𝑚𝑎𝑥 (13)
where:𝐿𝑘𝑗 =Load curtailed at ‘kth’ bus for ‘jth’ contingency 𝐶𝑎𝑣 =Capacity available for each contingency
𝐿𝑚𝑎𝑥 =Maximum load at bus ‘k’
5. SIMULATION RESULTS AND DISCUSSION
From state frequencies and load curtailments, the Probabilistic Performance Index (PPI) is calculated using equation 3 and summary of consolidated state values is portrayed in Table 6. Table 6 shows the PPI values for various contingencies that are arranged in descending order. Similar results are perceived using MATLAB based simulation analysis. Contingencies are classified into three categories as Non Critical, Moderately Critical, and Most Critical as shown in Table 7.
Table 6. Consolidated State Values for RBTS 3 Bus System State j Elements Out State Probability (Pj) State Frequency (Fj) Load Curtailed (Lkj) PPI 1 - 0.85692158 18.85227476 0 0.000000 2 G1 0.03462309 4.15477080 0 0.000000 3 G1, G1 0.00052449 0.11436062 15 0.000061 4 G1, G2 0.00364454 0.63414996 25 0.005193 5 G1, L1 0.00012648 0.15329376 0 0.000000 6 G1, L2 0.00015810 0.19145910 29 0.000636 7 G1, L3 0.00011857 0.11774001 20 0.000115 8 G2 0.09020227 6.85537252 5 0.024275 9 G2, G2 0.00237374 0.30858620 35 0.002410 10 G2, L1 0.00032951 0.38783327 5 0.000078 11 G2, L2 0.00041148 0.48438029 29 0.004077 12 G2, L3 0.00030891 0.29115559 20 0.000710 13 L1 0.00313030 3.48402390 0 0.000000 14 L1, L2 0.00001430 0.03150290 55 0.000062 15 L1, L3 0.00001072 0.02128992 35 0.000011 16 L2 0.00391288 4.35112256 29 0.328550 17 L2, L3 0.00001340 0.02659900 110 0.000177 18 L3 0.00293466 2.62652070 20 0.057013
Table 7. Contingency Grouping Criteria 0<PPI<0.0001 0.0001<PPI<0.001 0.1<PPI<1
Class A (Non-Critical) Class B (Moderately Critical) Class C (Most Critical) Red indicates the most critical contingency
Yellow indicates moderately critical contingency Green indicates Non-critical contingency
Based on the contingency grouping criteria, Contingencies are itemized in decreasing order of PPI values as shown in Table 8. Contingency No. 16 (L2 out) is identified as the most critical contingency and Contingency No. 13 (L1 out) is recognized as non-critical contingency.
Table 8 Contingency Ranking Using PPI State j Elements Out State Probability (Pj) State Frequency (Fj) Load Curtailed (Lkj) PPI 16 L2 0.0039129 4.3511226 29 0.328550 18 L3 0.0029347 2.6265207 20 0.057013 8 G2 0.0902023 6.8553725 5 0.024275 4 G1, G2 0.0036445 0.63415 25 0.005193 11 G2, L2 0.0004115 0.4843803 29 0.004077 9 G2, G2 0.0023737 0.3085862 35 0.002410 12 G2, L3 0.0003089 0.2911556 20 0.000710 6 G1, L2 0.0001581 0.1914591 29 0.000636 17 L2, L3 0.0000134 0.026599 110 0.000177 7 G1, L3 0.0001186 0.11774 20 0.000115 10 G2, L1 0.0003295 0.3878333 5 0.000078 14 L1, L2 0.0000143 0.0315029 55 0.000062 3 G1, G1 0.0005245 0.1143606 15 0.000061 15 L1, L3 0.0000107 0.0212899 35 0.000011 1 - 0.8569216 18.852275 0 0 2 G1 0.0346231 4.1547708 0 0 5 G1, L1 0.0001265 0.1532938 0 0 13 L1 0.0031303 3.4840239 0 0
Red indicates the most critical contingency Yellow indicates moderately critical contingency Green indicates Non-critical contingency
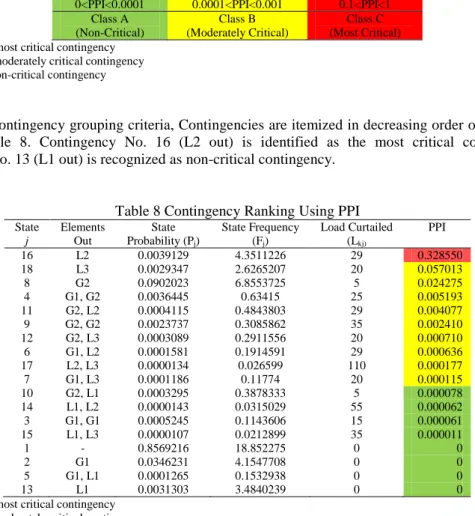
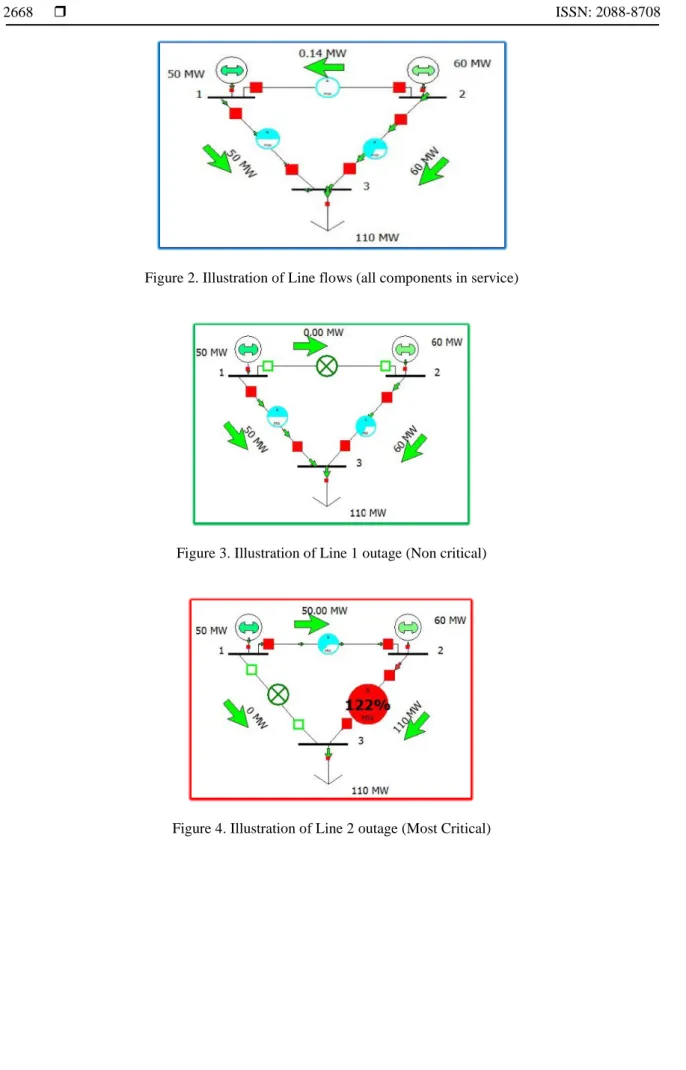
In order to validate the ranking procedure and to understand the contingencies graphically, RBTS test system is simulated using power world simulator [20]. Power world simulator is a cooperative power system simulation package intended to simulate high voltage interconnected power system. Figure 2 shows the simulation of RBTS system with all components in service. There are no line overloads and loss of load as shown in Figure 2.
From the results of power world simulator, it is quite evident that outage of L1 does not cause any overload and loss of load on bus as shown in Figure 3. PPI ranking grouped such outage as ‘Non-Critical’ contingency. Simulation of Contingency No.16 illustrates an overload on line L3 due to outage of line L2 as shown in Figure 4. According to PPI ranking, this is the ‘Most Critical’ contingency. Hence, the PPI ranking is convincing in the par of power world simulation results.
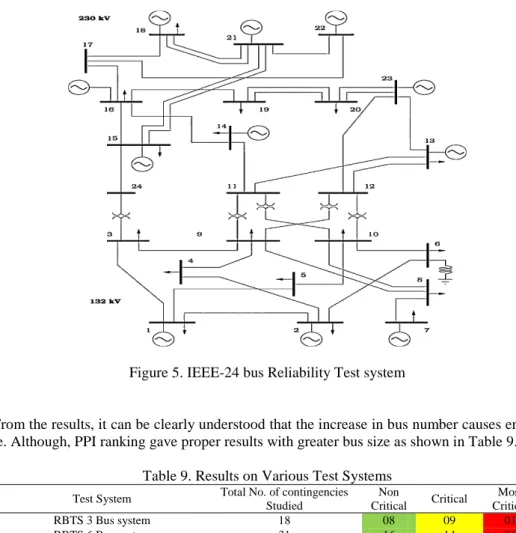
As per the amount of load curtailed, other contingencies like (L2, L3), (L1, L2), (L1, L3) may look like more critical, but their probability of occurrence is low. Therefore, from the results it was clearly understood that ranking of contingencies based on deterministic data is not appropriate. Such ranking may give deceiving results. PPI ranking was observed to be more promising as it takes out the uncertainty data of individual components into account. Further, PPI ranking limits the values between 0 and 1, in which any contingency may fall in the range. Also, ranking the contingencies based on other data like load curtailment may require wide range of values which again increase deliberately with size of the system. PPI ranking gives comprehensive scale for any dimension of the system. Furthermore, PPI ranking of contingencies for other test systems were simulated using MATLAB as shown in Figure 5 and obtained results are tabulated as shown in Table 9.
Figure 2. Illustration of Line flows (all components in service)
Figure 3. Illustration of Line 1 outage (Non critical)
Figure 5. IEEE-24 bus Reliability Test system
From the results, it can be clearly understood that the increase in bus number causes enlargement of state space. Although, PPI ranking gave proper results with greater bus size as shown in Table 9.
Table 9. Results on Various Test Systems Test System Total No. of contingencies
Studied Non Critical Critical Most Critical RBTS 3 Bus system 18 08 09 01 RBTS 6 Bus system 31 16 14 01
RTS-24 Bus Reliability Test System 3000 2979 18 03 Red indicates the most critical contingency
Yellow indicates moderately critical contingency Green indicates Non-critical contingency
6. CONCLUSIONS
This paper proposes a probabilistic performance index for contingency screening of composite power system. The modus operandi of the proposed index lies in translating probability data of the individual components into an index which incorporates the inherent randomness of the system. Conventional methods of contingency analysis use deterministic data which is quite irrational in reliability studies. As the index range from 0 to 1 the results are quite meaningful. The proposed approach has been tested on RBTS-3 bus system to validate the simulation results with rigorous theoretical calculations. The technique is also tested on large RTS-24 bus reliability test system to substantiate the results. The simulation results depict the appropriateness of the approach for classifying the contingencies into Non-critical, Moderately Critical & Most critical contingencies. Probabilistic Performance Index ordering facilitates the power system planner to identify the vulnerable areas and assists in developing reinforcement methods. The results also endorsed that the method is adoptable for large systems.
REFERENCES
[1] R. Billinton and R. N. Allan, Reliability evaluation of engineering systems. Springer, 1992.
[2] G. C. Ejebe and B. F. Wollenberg, “Automatic contingency selection,” IEEE Trans. Power Appar. Syst., no. 1, pp. 97–109, 1979.
[3] F. D. Galiana, “Bound estimates of the severity of line outages in power system contingency analysis and ranking,” IEEE Trans. Power Appar. Syst., no. 9, pp. 2612–2624, 1984.
[4] K. F. Schafer and J. F. Verstege, “Adaptive procedure for masking effect compensation in contingency selection algorithms,” IEEE Trans. Power Syst., vol. 5, no. 2, pp. 539–546, 1990.
[5] B. L. Silverstein and D. M. Porter, “Contingency ranking for bulk system reliability criteria,” IEEE Trans. Power Syst., vol. 7, no. 3, pp. 956–964, 1992.
[6] K. W. Chan et al., “On-line dynamic-security contingency screening and ranking,” IEE Proc. Gener. Transm. Distrib., vol. 144, no. 2, pp. 132–138, 1997.
[7] A. Berizzi, Y. G. Zeng, P. Marannino, A. Vaccarini, and P. A. Scarpellini, “A second order method for contingency severity assessment with respect to voltage collapse,” IEEE Trans. Power Syst., vol. 15, no. 1, pp. 81–87, 2000.
[8] E. B. Evangelista, A. Bianco, J. A. Gomes, J. C. F. Guimaraes, A. A. da Silva, and A. L. da Silva, “Automatic contingency analysis integration to an expert system in scheduled outage,” in Power Tech Proceedings, 2001 IEEE Porto, 2001, vol. 3, p. 6–pp.
[9] A. Ozdemir and C. Singh, “Fuzzy Decision Making Against Masking Problem in MW Contingency Ranking,” IEEE Power Eng. Rev., vol. 22, no. 2, pp. 55–56, 2002.
[10] J. He, Y. Sun, D. S. Kirschen, C. Singh, and L. Cheng, “State-space partitioning method for composite power system reliability assessment,” IET Gener. Transm. Distrib., vol. 4, no. 7, pp. 780–792, 2010.
[11] K. Verma and K. R. Niazi, “Supervised learning approach to online contingency screening and ranking in power systems,” Int. J. Electr. Power Energy Syst., vol. 38, no. 1, pp. 97–104, 2012.
[12] Y. Jia, P. Wang, X. Han, J. Tian, and C. Singh, “A fast contingency screening technique for generation system reliability evaluation,” IEEE Trans. Power Syst., vol. 28, no. 4, pp. 4127–4133, 2013.
[13] A. Mansouri, A. Aazami, A. Omidian, E. Mohamadian, and R. Aazami, “Evaluation of Power System Reliability Considering Direct Load Control Effects,” Int. J. Electr. Comput. Eng., vol. 3, no. 2, p. 254, 2013.
[14] S. Afshar and M. F. Firuzabad, “Reliability and Cost Model of PM in A Component of an Electrical Distribution System Considering Ageing Mechanism,” Int. J. Electr. Comput. Eng., vol. 4, no. 2, p. 193, 2014.
[15] R. Billinton and L. Wenyuan, “Hybrid approach for reliability evaluation of composite generation and transmission systems using Monte-Carlo simulation and enumeration technique,” in IEE Proceedings C (Generation, Transmission and Distribution), 1991, vol. 138, pp. 233–241.
[16] Y. Liu and C. Singh, “Reliability evaluation of composite power systems using Markov cut-set method,” IEEE Trans. Power Syst., vol. 25, no. 2, pp. 777–785, 2010.
[17] K. Venkatasatheesh Babu, V. Madhusudhan, and V. Ganesh, “TSS based composite power system reliability evaluation considering demand response,” Int. J. Latest Technol. Eng. Manag. Appl. Sci. IJLTEMAS, vol. 6, no. 6, pp. 150–154, Jun. 2017.
[18] B. P. Soni, A. Saxena, and V. Gupta, “A least square support vector machine-based approach for contingency classification and ranking in a large power system,” Cogent Eng., vol. 3, no. 1, p. 1137201, 2016.
[19] V. Sankar, “System Reliability Concepts,” Himalaya Publ. House, 2015.
[20] L. Bam and W. Jewell, “Power system analysis software tools,” in Power Engineering Society General Meeting, 2005. IEEE, 2005, pp. 139–144.