Seton Hall University Dissertations and Theses
(ETDs) Seton Hall University Dissertations and Theses
Summer 8-17-2015
The Predictive Power of Community, Family, and
School Variables on Student Achievement on the
NJ Ask Language Arts Literacy in New Jersey in
Grades 6 and 7
Meredith Fox
Follow this and additional works at:https://scholarship.shu.edu/dissertations
Part of theCurriculum and Instruction Commons,Educational Assessment, Evaluation, and Research Commons, and theEducational Leadership Commons
Recommended Citation
Fox, Meredith, "The Predictive Power of Community, Family, and School Variables on Student Achievement on the NJ Ask Language Arts Literacy in New Jersey in Grades 6 and 7" (2015).Seton Hall University Dissertations and Theses (ETDs). 2086.
THE PREDICTIVE POWER OF COMMUNITY, FAMILY, AND SCHOOL VARIABLES ON STUDENT ACHIEVEMENT ON THE NJ ASK LANGUAGE ARTS LITERACY IN NEW
JERSEY IN GRADES 6 AND 7
Meredith Fox
Dissertation Committee Anthony Colella, Ph.D., Mentor Jan Furman, Ed.D., Second Reader
Christopher Tienken. Ed.D. Claire Reder, Psy.D.
Submitted in partial fulfillment of the requirements for the degree of
Doctor of Education
Seton Hall University May 2015
Acknowledgments
I would like to begin by thanking my dissertation committee members for their motivation and support throughout this process. As any doctoral student knows, having a dedicated dissertation committee is the key to successful defense.
To Dr. Anthony Colella, I thank you for always being available to me whenever I needed guidance during this process. I thoroughly enjoyed our many conversations over the years! Your work and insight into the world of education has inspired me in more ways than you can imagine. I hope to one day visit the wonderful state of Tennessee and cross paths with you again.
To Dr. Jan Furman, I am very thankful for all of the wonderful advice you have given me over the past few years. I truly feel blessed to have had you not only as a committee member, but also as a professor in the program. Your extensive experience in education gave me and my colleagues a lot to consider as we move forward in our careers. I thank you for your devotion to me and my dissertation over the past two years.
To Dr. Chris Tienken, I can not thank you enough for your words of wisdom and encouragement throughout this journey. I would be remiss if I did not also thank you for the many laughs you provided, mostly at Kevin’s expense, and for your constant reassurance that every timeline was reachable, no matter how tight, and that every chapter would somehow get completed. Your knowledge of teaching and learning is inspiring and I look forward to learning more from you in the years to come.
To Dr. Claire Reder, thank you for agreeing to be part of my committee and for your support and friendship over the last ten years. It was you who told me all those years ago that I could do it and for that, I will forever be grateful. Thank you from the bottom of my heart.
Dedication
I dedicate this dissertation to my parents, Richard and the late Anna Fox, my late grandfather, Ronald Durbin, my husband Thomas Hartigan and our children, Samantha and Taylor Hartigan, my friend and colleague, Dr. Kevin McCahill. Without their unconditional love and support, this important work could not have been accomplished.
To my father, Richard Fox, thank you for your love, support, and guidance over the years. Dad, without you, none of this would be possible. From the time I was a little girl, you have supported my decisions and pushed me to be the best I could be, no matter what the challenge was ahead. I have made it through many challenges in life because you have been by my side and the completion of this dissertation is no different. Your nightly text messages and weekly phone calls checking in on my progress gave me the encouragement I needed to cross the finish line. Thank you.
To my late mother, Anna Fox, who left this world way too soon and did not get to witness this wonderful accomplishment. Mom, you taught me at a very early age that no matter what, everything would all work out in the end as long as hard work was involved. Your work ethic was admirable and you truly taught me how to approach a challenge with confidence. I miss your humor and free spirit every day, but I know you are smiling down on me now. As we always said, “Go big or go home!” I did it!
To my late grandfather, Ronald Durbin, thank you for starting the tradition of collecting my school report cards when I was five years old so you could reward me for hard work and excellence in school. Pop, your interest in my accomplishments made me feel proud and gave me the confidence I needed to be successful. You inspire me every day to push my students to work hard and achieve their dreams. I miss you dearly.
To my husband Tom, thank you for your unending patience and understanding throughout this grueling process. I know it is not easy to run a household while your wife is locked in her office researching and typing for hours on end but you did it with a smile. You made me laugh when I wanted to cry and you pushed me to the very end. You gave me all the support and love I could ask for. For that, I will always be grateful. Always remember, I love you more.
To Samantha and Taylor, thank you for understanding when I needed to “study” and for your sacrifices throughout this process. You’ve watched me work hard to achieve this goal over the past several years and I hope that this dissertation is an inspiration for you to work hard to achieve your dreams. Remember, no one can get in the way of your dreams without your permission. Stay focused, work hard, and always believe in yourself. I love you both.
To Dr. Kevin McCahill, my friend and colleague, thank you for everything. When our paths crossed at orientation, I had no idea how inspirational you would be and how important our friendship would become. You have guided me through the bumps, bends, and forks in the road and without you, I am not sure I would have ever learned the art of “chipping away”. I will forever be grateful for the levity you brought when I needed it most. Thank you for your friendship and your guidance. I could not have done this without you.
Finally, to my friends and colleagues at Nanuet, thank you. I feel truly blessed to work among some of the most dedicated, hard working professionals in education. You have all supported me through this journey and I look forward to sharing this accomplishment with you and all of our students in Nanuet. To Donna Lennane, my friend and mentor, I thank you for giving me the confidence to forge ahead in school leadership. You taught me more about leadership and teaching and learning than anyone I have ever known and for that, I am forever
appreciative. Last but not least, thank you to Jayne Fox Knips, for encouraging me to pursue a career in education when I was uncertain about my what path to take many years ago. Your passion for teaching, along with your love and kindness, are what inspired me to enter the field of education.
“A teacher affects eternity; he can never tell where his influence stops”--Henry Adams
All of you will never know the influence you have had on me. Thank you from the bottom of my heart. This accomplishment is dedicated to you.
Abstract
THE PREDICTIVE POWER OF COMMUNITY, FAMILY, AND SCHOOL VARIABLES ON STUDENT ACHIEVEMENT ON THE NJ ASK LANGUAGE ARTS LITERACY IN NEW
JERSEY IN GRADES 6 AND 7
This non-experimental, correlational, explanatory, cross-sectional study using
quantitative methods sought to determine which combination of 20 out-of-school community demographic factors, while controlling for two school level variables, predicted and accounted for the most variance in New Jersey schools’ percentages of students scoring Proficient or above on the 2010 NJ ASK Language Arts Literacy in sixth and seventh grades. This study focused on both community variables and school level variables to determine whether the current federal and state evaluation policies in place for schools and school personnel that utilize student
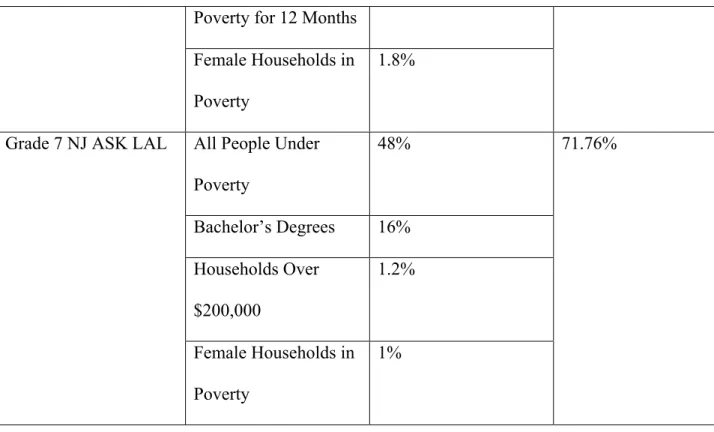
outcomes on high-stakes standardized assessments are reasonable. The study examined over 300 schools in New Jersey. Using simultaneous and hierarchical linear regression, two community variables, households over $200,000 and female households in poverty, were identified as statistically significant predictors at both grade levels. The contribution of households over $200,000 ranged between 1.2% and 44%. Although statistically significant in both grades, female households in poverty contributed a small amount of variance, ranging from 1% to 1.8%. Two other variables that represent poverty, all families in poverty and all people under poverty for 12 months, were also present in both grades, contributing from 3% to 48% of the variance in the models. These findings illustrated that family and community variables influence student achievement on high-stakes assessments in Grades 6 and 7. At the Grade 6 level, 76% of schools’ percentage of students scoring Proficient or above on the 2010 NJ ASK LAL were accurately predicted. At the Grade 7 level, 71.76% of schools’ percentage of students scoring Proficient or above on the NJ ASK LAL 2010 were accurately predicted.
Table of Contents Abstract………..ii Acknowledgments………...iii Dedication………..iv Table of Contents………..vii List of Tables………...ix List of Figures……….x I INTRODUCTION……….1 Theoretical Framework………..4
Statement of the Problem………...6
Purpose of the Study……….10
Significance………...11
Research Questions.………..13
Study Design and Methodology………13
Delimitations……….15
Limitations……….16
Definition of Terms………...17
Chapter Summary………..18
II REVIEW OF THE LITERATURE……….21
Introduction…………..………..21
Literature Search Procedures……….21
Overview of Existing Literature………22
Historical Background………...22
High-stakes Assessment and Student Achievement.……….26
Community and Family Demographics and High-Stakes Assessment……….28
Review of Literature Topics………..31
Assessment and High-Stakes Policy Development………...31
Current Federal Policy………...37
TEACHNJ: New Jersey’s Evaluation Policy………...41
New Jersey Assessment of Skills and Knowledge (NJ ASK)……….43
NJ ASK Language Arts Literacy...44
Community and Family Variables that Impact Student Achievement………..44
Poverty and Student Achievement………...44
Poverty and Language Arts Achievement………...47
Household Income and Student Achievement……….50
Lone-Parent Household and Student Achievement……….55
Parental Educational Attainment and Student Achievement………...66
School Level Variables that Impact Student Achievement………68
Teacher Mobility and Student Achievement………68
Chapter Summary………...76 III METHODOLOGY……….77 Introduction……….………77 Research Design………..77 Research Questions. ………...80 Null Hypotheses………..80
Data Collection and Sample...……….………....81
Data Analysis……….……….83
Instrumentation………...86
Reliability..………..87
Validity…………..………..90
Chapter Summary………...94
IV ANALYSIS OF THE DATA………..97
Introduction……….97
Research Questions……...………..97
Independent Variables……….98
Procedure...………100
Grade 6 Language Arts Literacy.………...102
Grade 7 Language Arts Literacy.………...117
Overall Conclusions………...132
V CONCLUSIONS AND RECOMMENDATIONS………...137
Introduction……….………...137
Recommendations for Policy……….…139
Recommendations for Practice………..143
Recommendations for Future Research……….…146
Conclusions.………...147
REFERENCES………...150
APPENDIX A………..169
List of Tables
Table 1. 2010 NJ ASK Language Arts Literacy Cronbach’s Alpha………...88
Table 2. 2010 NJ ASK Consistent Indices for Performance Levels………...89
Table 3. Names and Labels of Independent Variables………...99
Table 4. Grade 6 Language Arts Descriptive Statistics Table………...103
Table 5. Grade 6 Language Arts Literacy Descriptive Statistics for the Dependent Variable………..104
Table 6. Interpretation of the Size of a Correlation Coefficient………...107
Table 7. Grade 6 Language Arts Literacy Correlational Matrix………..108
Table 8. Grade 6 Language Arts Literacy Model Summary………....109
Table 9. Grade 6 Language Arts Literacy ANOVA Table………...109
Table 10. Grade 6 Language Arts Literacy Coefficients Table………...110
Table 11. Grade 6 Language Arts Literacy Hierarchical Model Summary Table…………...112
Table 12. Grade 6 Language Arts Literacy ANOVA Table………..113
Table 13. Grade 6 Language Arts Literacy Coefficients and VIF Table………...114
Table 14. Grade 6 Language Arts Literacy Percentage of Scores Predicted Accurately……...116
Table 15. Grade 7 Language Arts Descriptive Statistics Table………...117
Table 16. Grade 7 Language Arts Literacy Descriptive Statistics for the Dependent Variable Table……….119
Table 17. Interpretation of the Size of a Correlation Coefficient………...120
Table 18. Grade 7 Language Arts Literacy Correlation Matrix……….122
Table 19. Grade 7 NJ ASK Language Arts Literacy Model Summary………..123
Table 20. Grade 7 Language Arts Literacy ANOVA Table………...123
Table 21. Grade 7 Language Arts Literacy Coefficients Table………..124
Table 22. Grade 7 Language Arts Literacy Hierarchical Model Summary Table………..126
Table 23. Grade 7 Language Arts Literacy ANOVA Table………...127
Table 24. Grade 7 Language Arts Literacy Coefficients and VIF Table………....129
Table 25. Grade 7 Language Arts Literacy Percentage of Scores Predicted Accurately……...131
Table 26. Summary of Hierarchical Regression Models and Predictive Models………...132
Table 27. Summary of Hierarchical Regression Standardized Beta Values by Independent Variable………...134
List of Figures
Figure 1. Histogram of Grade 6 Language Arts Literacy NJ ASK Passing Percentages……..105 Figure 2. Stem and Leaf Plot of Grade 6 Language Arts Literacy NJ ASK Passing
Percentages………..106 Figure 3. Histogram of Grade 7 Language Arts Literacy NJ ASK Passing Percentages……..119 Figure 4. Stem and Leaf Plot of Grade 7 Language Arts Literacy NJ ASK Passing
CHAPTER I INTRODUCTION
Introduction
Since the inception of the No Child Left Behind Act (United States Department of Education, 2002), there has been increased pressure from policymakers to demonstrate evidence of improved student performance and educator effectiveness. On a state and national level, there is a move to utilize the results of standardized state-mandated assessments to assess student achievement, teacher effectiveness, and administrator effectiveness. As Maylone (2002) explained, President Bush’s education policies changed the way America’s schools are evaluated. Increased attention is paid to school accountability via quantitative data from standardized tests, and more emphasis has been placed on higher standards of student and teacher output as measured by results from those tests. School personnel face sanctions for failure. Overall, school administrator, teacher, and student achievement is now based in part on how well students perform on some type of high-stakes state-mandated assessment.
High-stakes testing policies attach consequences to school personnel based on student academic performance with the goal of incentivizing teacher effectiveness and student
achievement (Herman & Haertel, 2005; Ryan, 2004). The rationale is that by attaching significant rewards or serious threats to student achievement on high-stakes assessments, educators will be prompted to work harder (Nichols, Glass, & Berliner, 2012).
Public school personnel are judged on how their students perform on such assessments. Since the passage of President Bush’s No Child Left Behind Act, many more states have followed suit. NCLB mandated the most intrusive use of tests for influencing how and what teachers would teach and how and what students would learn (Nichols, Glass, & Berliner,
2012). NCLB has led the public to believe that when students score high on assessments, teachers and administrators in the district are of high quality or highly effective.
Unfortunately, the opposite also remains true. When students perform poorly on state standardized assessments, staff is assumed to be ineffective. As Popham (1999) explained, “In either case, because educational quality is being measured by the wrong yardstick, those evaluations are apt to be in error” (p. 8). The state standardized assessments currently in use were not designed or validated to make determinations about teacher effectiveness, yet they are used that way in every state that received a Race to the Top grant. According to the United States Department of Education (2009):
The Race to the Top Grant is a competitive grant program designed to encourage and reward States that are creating the conditions for education innovation and reform; achieving significant improvement in student outcomes, including making substantial gains in student achievement, closing achievement gaps, improving high school
graduation rates, and ensuring student preparation for success in college and careers; and implementing ambitious plans in four core education reform areas:
! Adopting standards and assessments that prepare students to succeed in college and the workplace and to compete in the global economy;
! Building data systems that measure student growth and success, and inform teachers and principals about how they can improve instruction;
! Recruiting, developing, rewarding, and retaining effective teachers and principals, especially where they are needed most; and
! Turning around our lowest-achieving schools.
achievement and have the best plans to accelerate their reforms in the future. These States will offer models for others to follow and will spread the best reform ideas across their States, and across the country (p. 2).
The gradual adoption of high-stakes accountability measures across the country has prompted several studies to be conducted on the effectiveness of using student achievement data to measure educator effectiveness. Nichols, Glass, & Berliner (2012) explain that policymakers continue to argue for its effectiveness through the reauthorization of NCLB and the development of new state evaluation processes, despite evidence to the contrary. Most of the research that was conducted around the time of the passing of NCLB provides little support for the use of high-stakes assessments as a measure of student achievement or as an influencer of increased graduation rates (Amrein & Berliner, 2002; Braun, 2004, Rosenshine, 2003; Haney et al.,2004; Heubert & Hauser, 1999; Marchant & Paulson, 2005). In fact, results from empirical studies suggest that high-stakes assessment results have little or no relationship to student reading achievement and a weak to moderate relationship to math (Braun, Wang, Jenkins, & Weinbaum, 2006; Braun, Chapman, & Vezzu, 2010; Figlio & Ladd, 2008; Nichols, Glass, and Berliner, 2006). The results from such tests most commonly relate to factors outside of the control of educators, such as student eligibility for free lunch (Sirin, 2005)
A follow-up study examining state policy accountability as it relates to 2005, 2007, and 2009 National Assessment for Education Progress (NAEP) revealed that the amount of pressure exerted on students and educators as a result of high-stakes accountability policies is related to increases in achievement in math more consistently than in reading (Nichols, Glass, & Berliner, 2012). However, the data are unclear because it is difficult to measure whether or not gains in student achievement are really a result of better instruction or a result of educators growing more
efficient at simply training students to take the test due to the pressure to avoid ineffective ratings.
Further complicating this approach to assessing educator effectiveness is the fact that the results from standardized achievement tests are influenced not only by what students learned inside of school, but also what they learned outside of school as well (Popham, 1999). Herein lies another problem with the reliance on standardized assessments to judge educator
effectiveness and school quality. If children come from advantaged families in which they are provided many opportunities to learn, then they are more likely to perform well on standardized assessments than students who come from environments in which learning outside of school is minimal (Popham, 1999).
Researchers have determined that the higher a student’s socioeconomic status is, the more likely they will perform well on standardized assessments. Tienken (2012) cites poverty as one of the factors that negatively impacts student performance on state assessments, actually accounting for up to 60% of the variance in standardized test scores. Therefore, a problem occurs when policymakers make determinations about educator effectiveness based on student performance on one standardized assessment that does not take into account where students start based on their socioeconomic status (Tienken & Orlich, 2013). There is a need for further quantitative research to be conducted to determine whether or not community factors are predictors for student success on NJ ASK in Language Arts Literacy in Grades 6 and 7.
Theoretical Framework
Existing literature on the relationship between out-of-school influences on student
achievement indicates that many factors, including SES, can directly impact student achievement on high-stakes assessments. Maylone (2002) suggested that results from high-stakes
standardized assessments might explain little about student achievement because of the impact the out-of-school variables were found to have on student scores. As previously mentioned, results from high-stakes assessments are increasingly being used as a tool for education reform. However, of note is the fact that many of these high-stakes assessments are not actually designed to effectively measure teacher quality. As Turnamian (2012) explains:
Education policymakers may be rewarding or punishing school districts based on a false paradigm by using high-stakes test data to identify quality and success in school districts without consideration or control for other significant socioeconomic variables proven to impact student achievement as measured by standardized assessments (p. 90).
My purpose for this study was to offer an extension of the research that has already been completed examining the community, family, and district factors that impact student
achievement. This study was rooted in the idea that policymakers should operate with the intention of creating opportunities for all students to achieve. Ecological systems theory, the vision of Urie Bronfenbrenner, a pioneer in studying the behavior of children in their natural life space of family, school, peer group, and community, guided this study, as it required an
examination of the key circles of influence, family, school, and community, that surround children and how they either hinder or encourage upward student mobility and equity in society (Brendtro, 2006). The theory operates on the premise that the circles of influence around a child often operate in a broader cultural, economic, and political context, which can all impact a child’s behavior and achievement (Phelan, 2004).
According to Brofenbrenner’s ecological systems theory, the only way one can gain an accurate understanding of a child is by considering the child’s family, peer group, school, and community. Therefore, this theory challenges narrow approaches of assessment. From an
ecological approach, any attempt at measuring a child’s ability using isolated assessment instruments is considered pseudo-science (Brendtro, 2006). Rather, one must consider the transactions of the child with the family, school, and community if they plan to draw conclusions about a child’s success in society.
Brofenbrenner’s ecological systems theory is in direct conflict with the current policy in New Jersey that utilizes results from high-stakes assessments to measure student achievement and make determinations about students and the educators who work with them. His hope was that his theory would change public policies that are antagonistic to youth development. His original research led the Head Start movement that attempted to educate disadvantaged youth. Tienken and Orlich (2013) explain that this modern school reform movement may actually lead education down the opposite path by “Balkanizing and siloing students along economic and racial lines” (p. xv). Brofenbrenner’s belief that the most direct impact on children resides in his or her immediate sphere of influence does not align with what policymakers in New Jersey have proposed through the TEACHNJ model. Perhaps educators who are labeled ineffective based on student achievement on state-mandated high-stakes assessments are not really ineffective at all. Perhaps the indicators used, the standardized test results, are too blunt an instrument to capture the effects of the teacher.
Statement of the Problem
One consequence of the Race to the Top competitive grant program and NCLB waivers has been increased policy pressure from policymakers to link student performance on state mandated standardized tests as one important indicator of teacher effectiveness. On a state and national level, there is a move to utilize the results of standardized assessments to assess teacher quality. President Obama’s administration has continued with the NCLB-style reform efforts by
funding the Race to the Top (RTTT) grant program, which entices states to implement new accountability standards for educators and administrators. Increased attention is paid to school accountability, a stronger emphasis has been placed on higher curriculum standards and student performance on state-mandated standardized tests, and school personnel face sanctions that escalate with each passing year. Under NCLB, the federal government can use the threat of withdrawing ESEA funds to bring significant pressure on states, school districts, and schools to meet the demands of the law (Fowler, 2013). Overall, school, teacher, and student success is based on how students perform on some type of standardized assessment. Across the nation, state education bureaucrats are moving toward a policy model in which teachers are evaluated based on student performance on state assessments.
In New Jersey, the teacher evaluation system is defined under the Teacher Effectiveness and Accountability for the Children of New Jersey Act (TEACHNJ Act), a bipartisan tenure reform that was signed into law by Governor Chris Christie on August 6, 2012. According to the New Jersey Department of Education (NJDOE, 2013), prior to this law, New Jersey’s state policies did not clearly differentiate performance among educators, provide feedback or opportunities for professional development, or produce data to inform important personnel decisions such as tenure. The state-advertised purpose of TEACHNJ is to raise student achievement by improving instruction through the use of evaluations, inform professional development, and inform personnel decisions, including decisions about educator tenure. Those impacted by the legislation include teachers, principals, assistant principals, superintendents, assistant superintendents, school nurses, school athletic trainers, and any other employees required to hold certificates issued by the Board of Examiners.
New Jersey teacher evaluation rubrics are based on four rating categories: Highly
Effective, Effective, Partially Effective, and Ineffective. Since 2012, evaluations in New Jersey have been based on multiple measures of student achievement that specifically call for the use of standardized assessments as a measure of student progress (New Jersey Department of
Education, 2012). Initially, the system called for student academic growth to represent 30% of teacher evaluations, with 55% classroom observations and 15% student growth objectives. Student growth is measured using growth percentiles (SGPs). According to the NJDOE, SGPs measure how much a student has learned from one year to the next compared to students with a similar performance history from across the state. A teacher’s effectiveness rating is then
determined by taking the median SGP score of the teacher’s class. The SGP score is then placed on a 1.0-4.0 scale, which is then combined with other evaluation components to arrive at a summative rating for a teacher.
Critics of the legislation have cited problems with the SGP method, specifically citing the New Jersey Department of Education’s Evaluation Pilot Advisory Committee’s (EPAC) Final Report (2013) as lacking data about the correlation between SGP scores and educator practice. The New Jersey Education Association (NJEA) reveals that the EPAC report indicates that there was a positive correlation between SGP scores and teacher performance; however, they do not report how many districts experienced the correlation, nor does the report reveal or explain districts that did not.
Following implementation challenges and much criticism from the field, in July, 2014, Governor Chris Christie announced that the New Jersey Department of Education would provide greater flexibility to school districts in the two student achievement components of the teacher evaluation system as well as introduce a review process for teachers based on summative ratings
from the 2013-2014 school year (New Jersey Department of Education, 2014). For the 2014-2015 school year, the Department of Education decided to modify the weights of the student growth components. Under the modification, 10% of an educator’s score will be based on student academic growth as measured by statewide assessments, 20% less than the initial weight under TEACHNJ. For the 2015-2016 school year, 20% of the evaluation score will be based on student academic growth, as measured by statewide assessments, again below the initial 30% requirement. Last, the Department of Education will also offer flexibility to teachers in reviewing their ratings for the 2013-2014 school year as a result of the challenges with the implementation of the law as well as concerns surrounding the measurement of student
achievement using high-stakes statewide assessments. It is clear that New Jersey has undertaken the challenge of developing a new evaluation system. What is not clear is whether or not student growth on high-stakes assessments is actually a result of educator effectiveness and not other factors.
The evaluation policy ignores the fact that researchers have determined that the higher a student’s socioeconomic status is, the more likely he or she will perform well on high-stakes assessments. Previous studies by Maylone (2002), Jones (2008), Turnamian and Tienken (2013), and Tienken (2015) have used community and family demographic data to predict the actual percentage of students scoring Proficient or above, at the district-level, on state tests of language arts and mathematics. However, none of these studies considered the predictive power of ecological variables from the family and town, at the school level, along with school-level factors such as teacher qualifications and teacher mobility.
Therefore, given the results from previous research, a problem occurs when policymakers make determinations about teacher and administrator quality based on student performance on
high-stakes assessments without considering the impact of out-of-school demographic and socio-economic variables such as median income of a community, parental education levels,
percentage of lone parents in the community, percentage of high school dropouts in the community, and other related indicators that have been demonstrated to influence student achievement on large-scale standardized tests (Tienken, 2015). Previous research has informed the field at the high school level (Maylone, 2002; Jones, 2008) and only two studies have been conducted at the elementary level (Turnamian & Tienken, 2013; Tienken, 2015). All of the previous studies have been done at the district level. There is a gap in the research at the middle school level.
There are no studies that have been conducted at the school level of analysis or that consider the mediating influence of school level variables such as the influence of teacher mobility and the level of teacher education on student achievement. Therefore, a need exists in New Jersey for empirical, correlational, explanatory, quantitative analyses to determine how accurately community-level demographic data, combined with school variables, can predict the actual percentage of students scoring Proficient or above on the New Jersey Assessment of Skills and Knowledge in Language Arts Literacy (NJ ASK LAL) at the sixth and seventh grade levels.
Purpose of the Study
The purpose for this study was to explain the predictive power of out-of-school community and family-level demographic variables of school-level percentages of students scoring Proficient or above on the NJ ASK LAL in Grades 6 and 7 when controlling for teacher mobility and level of teacher education. It cannot be assumed that data generated from high-stakes standardized assessments can accurately measure the quality of an educator without
considering the out-of-school community and family factors as well as certain district factors that could be influencing student achievement (Turnamian, 2012).
Currently, policymakers may be operating under the false assumption that high scores on high-stakes assessments accurately identify quality and success in school districts. Specifically, policymakers may be misidentifying educators as ineffective or effective using measures of student achievement without controlling for the community, family, and district factors that may be influencing how students achieve on the high-stakes measures that are being used to evaluate educators. Previous results from Fetler (2001) suggest that educator effectiveness, as measured by student achievement, can be correlated to longevity in the field. Therefore, when evaluating educator effectiveness, it is important to consider issues of teacher mobility in addition to school, community, and family factors.
Significance
While recent studies conducted by Maylone (2002), Jones (2008), and Turnamian and Tienken (2013) have demonstrated that more than half the variance in state standardized test scores at the high school level in Michigan and New Jersey and at the third grade level in New Jersey can be accounted for at the district level by knowing three to five community
demographic variables and without school and student characteristic data needed, none of these studies address middle school grade levels. Additionally, none of these predictive studies have been done at the school level, which yields data that are more precise than district level data. Empirical data are needed at the middle school level to build research to further practice as well as inform policymakers whether or not student achievement data from high stakes assessments should be used as part of an educator evaluation process, given the premise of the ecological systems theory.
This study can also further the previous research by including school level factors, teacher qualifications, and staff mobility, combined with community and family level factors, to determine whether or not educators can or should be evaluated in isolation by considering only one measure of a child’s life space since policymakers continue to argue for the use of high-stakes assessments as a measure of student achievement and teacher effectiveness. While previous research has been done in the area of teacher mobility and student achievement, it has not been considered as a predictor of students scoring Proficient or above on the NJ ASK Language Arts Literacy, nor have school level variables, including teacher qualifications and mobility, been added as a predictor in any of the previous studies conducted using community and family level factors (Sanders & Rivers, 1996; Falch & Ronning, 2005; Hanushek, Kain, & Rivkin, 2003; Dolton and Newson, 2003; Plecki et al., 2005).
Furthermore, none of the studies consider teacher degree levels as a predictor of student achievement, combined with family and community variables. Again, research has been done on the impact of teacher degree levels on student achievement (Swan, 2006; Riordan, 2009;
Woolridge, 2003; Badgett, 2011); however, most of the research is considered in isolation from community and family level factors. One study examined the relationship between teacher licensure level and student achievement in the state of New Mexico, with a secondary
consideration of the impact of student ethnicity and socio-economic status on the relationship (Morris, 2010). However, that study did not seek to examine the relationship of any other community or family level factors in combination with student socioeconomic status. Given the current educational landscape and the use of the results from high-stakes assessments to
research and provide state policymakers with valuable insight into how much community demographics, family factors, and school factors influence the student achievement measure.
Research Questions
1. How accurately can family and community variables predict a school’s percentage of students scoring Proficient or above on the 2010 NJ ASK 6 and 7 in Language Arts Literacy when controlling for teacher mobility and level of teacher education? 2. Which combination of family and community variables can accurately predict a
school’s percentage of students scoring Proficient or above on the 2010 NJ ASK 6 and 7 in Language Arts Literacy when controlling for teacher mobility and level of teacher education?
Study Design and Methodology
This study used archival NJ ASK 6 and 7 school level Language Arts Literacy percentages of Proficient and Advanced Proficient from 2010 and data from the 2010 U.S. Census to determine if a predictive equation exists between the data. The study also used archival teacher mobility and teacher degree data from the New Jersey School Report Card as well. Grades 6 and 7 were chosen to be the focus of this study because there is no research yet of this topic at these grade levels and because middle school is a pivotal time in a student’s
educational career. According to the National Middle School Association (2003), middle school is considered a time when adolescents develop into lifelong learners, ethical and democratic citizens, and competent, self-sufficient young people. The impact of high-stakes testing on middle school students, particularly on urban students, is important for policymakers to consider. Zhao (2009) explains that the increased pressure to raise test scores, particularly in urban areas,
leads schools to neglect the more complex aspects of subjects and teach only to what is being tested, ultimately narrowing the curriculum for students.
Unit of Analysis and Variables
The unit of analysis for this study was the school. The study extends the independent variables of Maylone (2002) and Turnamian and Tienken (2013) and includes the following:
! Percentage of people employed
! Percentage of households making under $25,000 ! Percentage of households making under $35,000 ! Percentage of households making more than $200,000 ! Percentage of families making less than $25,000 ! Percentage of families making less than $35,000 ! Percentage of families making more than $200,000 ! Percentage of families in poverty for 12 months ! Percentage of female households in poverty ! Percentage of all people under poverty
! Percentage of male-only households, no females ! Percentage of female-only households, no males ! Percentage of lone-parent households (total) ! Percentage of population with no high school
! Percentage of population with less than 9th grade education ! Percentage of population with some college
! Percentage of population with a bachelor’s degree ! Percentage of population with an advanced degree
! Percentage of teachers within a school that hold a bachelor of arts or bachelor of science degree
! Percentage of teachers within a school that hold a master of arts or master of science degree
! Percentage of faculty within a school who entered or left the school during the school year
The dependent variables for this study were the 2010 school district NJ ASK Grades 6 and 7 Language Arts data, which is defined as the percentage of the student population that achieved either a Proficient or Advanced Proficient score.
Delimitations
The data for this study were collected from two sources. Community demographic data were collected from the U.S. Census Bureau. Analysis of this data was delimited to the variables identified by Maylone (2002) and Turnamian and Tienken (2013) as well as two additional variables, teacher mobility and teacher degrees. Additional variables used were identified from the review of the literature. School performance data on the NJ ASK Language Arts Literacy 6, 7 during the year 2010 were collected from the school district School Report Card, which is released annually. Since the Language Arts Literacy assessment was the only assessment that was used for this study, it was the only measure of student achievement. Assessment data also reflect achievement on only one date in time in a given year. Information about each school’s percentage of economically disadvantaged students was also collected using the School Report Card data. Additionally, the degree of teacher mobility, as well as the qualifications of teachers within a given school, were also accessed using the school district report card. For the purposes
of this study, the unit of analysis remained at the school level only. Therefore, analysis of individual students was not conducted.
Since this study included only analysis at the school level, the findings cannot be
generalized to individual students within New Jersey. Since the study utilized school and census data from New Jersey only, the findings of this study cannot be generalized beyond the state. Finally, since the data for this study included only two grade levels (Grade 6 and Grade 7), generalizations about student achievement should not be made beyond the studied grade levels.
Limitations
The results of this study can be applied only to data generated from the NJ ASK 6 and 7 Language Arts Literacy percentages of Proficient or above, community demographic data and teacher mobility and degree from the sampled New Jersey schools. Any errors in U.S. Census data or school data as a result of data entry or reporting data cannot be identified. Because this study is a correlation design, cause cannot be determined since cause and effect relationships cannot be determined by correlational design. The sample size for this study included 311 schools with Grade 6 data and 301 schools with Grade 7 data. In order for a school to be included, there had to be at least 25 students enrolled in sixth or seventh grades.
The data that were gathered for this study represented a three-year longitudinal view of student achievement. School district NJ ASK Language Arts Literacy percentages of students scoring Proficient or above were taken from the year 2010 in Grades 6 and 7. It is assumed that the reported percentages are valid and that each school complied with testing regulations.
The study utilized two forms of multiple regression, simultaneous multiple regression (SMR) and hierarchical linear regression (HLR) to analyze the results of the NJ ASK LAL 6 and 7. The results were reported from the hierarchical models of best fit. Therefore, a threat to
reliability and validity exists. The impact of multicollinearity on the independent variables can cause individual coefficient estimates to change, which can negatively impact calculations regarding the predictive power of each school.
Definition of Terms
District Factor Group (DFG): According to the NJDOE (2013), groupings of school districts in New Jersey for the purpose of comparing students’ performance on statewide assessments across demographically similar school districts. DFGs represent an approximate measure of a community’s socioeconomic status (SES) and are calculated using six variables that are closely related to SES and include percent of adults with no high school diploma, percent of adults with some college education, occupational status, unemployment rate, percent of individuals in poverty, and median family income.
Predictive Validity: According to Gay, Mills and Airasian (2012), predictive validity is defined as the degree to which a test can predict how well an individual will do in a future situation; a form of criterion-related validity.
Standard Error of Measurement: An estimate of how often one can expect errors of a given size in an individual’s test score (Gay, Mills, & Airasian, 2012, p. 631).
New Jersey Assessment of Knowledge and Skills (NJ ASK): The state test for students in grades 3 through 8. The test measures student achievement in English Language Arts,
Mathematics, and Science (Grades 4 and 8). The assessment is administered in the spring of each school year over four school days (NJDOE, 2011).
No Child Left Behind (NCLB): Legislation that was signed into law in 2002 by President George W. Bush with the intent to ensure that all children have a fair, equal, and significant opportunity to obtain a high-quality education. This mandate requires that students in all
states must demonstrate 100% proficiency on state academic assessments by the year 2014 (Tanner & Tanner, 2007).
Student Growth Percentiles (SGP): One of the multiple measures used to assess teachers whose students are in Grades 4-8 and take the state standardized assessments. A teacher’s SGP score is calculated by comparing a student’s growth on the standardized assessment to the growth made by students from around the state with similar score histories (NJDOE, 2013).
High-Stakes Assessment: For a test or testing program to be considered high-stakes, Tienken and Rodriguez (2010) suggest that it must meet the following conditions:
! A significant consequence related to the individual student’s performance
! The test results must be the basis for the evaluation of quality and success of school districts
! The test results must be the basis for the evaluation of quality and success of individual teachers.
Race to the Top (RTTT): Race to the Top is an initiative that was launched by President Barack Obama’s Administration in 2012. The initiative offers incentives to states willing to spur systemic reform to improve teaching and learning in America’s schools. RTTT was designed to raise standards and align policies and structures with the goal of making every student in America college and career ready. RTTT is the driving force behind states pursuing changes to teacher evaluation systems (Towe, 2012).
Chapter Summary
Although the practice of utilizing assessment to distribute rewards and sanctions to educators and schools has been ongoing since the mid 1800s, recent education reform efforts
have increased the value placed on such tests by using the results as measures of educator effectiveness. The passage of President Bush’s NCLB forced states to develop high-stakes assessments so that student achievement could be measured and educator effectiveness
determined using the results of the assessments. Attached to this policy is the requirement that educators be punished, in some cases even dismissed, if their students do not demonstrate adequate growth over the course of a school year. It is clear that at the federal level, President Obama’s plan is to continue prior reform efforts with the introduction of Race to the Top, yet another performance-based standard for teachers and administrators. The state of New Jersey has followed suit by creating an evaluation system, ACHIEVENJ, for teachers and
administrators that relies on student performance on the NJ ASK to determine whether or not schools and educators are effective. New Jersey’s Governor, Chris Christie, strongly defends his state’s policy, although serious questions remain regarding the accuracy of its measures of student achievement.
Previous research completed by Maylone (2002), Jones (2008), and Turnamian and Tienken (2013) found that out-of-school variables explain and predict student achievement on high-stakes assessments. Their research sought to identify how much variance in NJ ASK scores could be explained by out-of-school socioeconomic variables using demographic data to predict percentages of students who scored Proficient or above on assessments. The unit of analysis for those studies was at the district level.
This study, however, sought to analyze community, family, and school variables at the school level, which allowed for a more refined look at how accurately family and community level variables could predict New Jersey school districts’ percentage of scores Proficient or above on the NJ ASK Language Arts Literacy in Grades 6 and 7. This study also sought to
further the prior research by analyzing student performance at the middle school level. Two school level variables, teacher mobility and teacher qualifications, were chosen to be included in the study based on a review of the literature as to what school level factors can impact student performance on high-stakes assessments as well as consideration of Brofenbrenner’s ecological systems theory, which contends that children are impacted by a combination of community, school, and family factors.
CHAPTER II
REVIEW OF THE LITERATURE Introduction
This chapter provides a relevant review of the literature on federal and state policy with regard to high-stakes, standardized assessments, community and family factors, and school level variables that impact student achievement. The literature review also provides a historical description of teacher evaluation practices in the United States. This literature review is organized into six sections: Assessment and High-stakes Policy Development, Current Federal Policy, New Jersey’s Evaluation Policy, New Jersey Assessment of Skills and Knowledge, Community and Family Variables that Impact Student Achievement, and School Level Variables that Impact Student Achievement.
The following literature review includes a description of studies that have examined the influence of family and community variables on student achievement as well as studies that have examined the impact of school level variables on student achievement. Studies found in this review supplied the researcher with information about which variables should be examined in this study. The purpose of this review and study was to supply policymakers with critical information about the impact community, district, and school level variables have on student outcomes measured by high-stakes assessment, as student outcomes are often used to determine educator and school quality.
Literature Search Procedures
Various research sources were used to analyze the topics listed above. I utilized the Seton Hall Library’s website to access Journal Storage (JSTOR), ProQuest, electronic journals, and ERIC databases. The New Jersey Department of Education’s website, as well as the United
States Department of Education’s website, were used to gather information about the policies related to standardized assessment and student achievement. The main research questions guided the literature review and resulted in the following sections: federal and state policy, high-stakes assessment, community and family variables and the impact on student achievement, and school level variables’ impact on student achievement. The literature review identifies empirical research that attempts to determine the predictive power, if any, that community and family variables have on student achievement.
Overview of Existing Literature Historical Background
The practice of evaluating schools and teachers has recently become a major focus of education. While teacher evaluation practices have been in place for decades, accountability for student learning is currently at an all-time high. Therefore, the evaluation process has evolved. Daley and Kim (2010) explain that the teacher evaluation process has undergone major changes over the last 100 years. Years ago, teachers were evaluated based on moralistic and ethical qualities such as cultural norms, beliefs, religious ideology, and other personal traits (Daley and Kim, 2010). Perhaps one of the most pivotal moments in education came in 1957, when the announcement came from Russia that the Soviets had launched Sputnik, the space satellite. As Tienken (2013) explains, the launch of Sputnik sparked a wave of modern school reform that is still in place today. Policymakers reacted to the launch of Sputnik with fear and disbelief. The perception was that the American public school system was inadequate compared to other nations (Tienken, 2013).
As a result, during the 1950s and 1960’s, a more scientific method of evaluation was applied, and the teacher evaluation process shifted to include more observable behaviors as the
need for high quality teachers became more and more apparent in America. During that time, there was a widely held belief that if America was going to compete with countries such as the Soviet Union, American students had to have access to the best teachers available and teacher quality had to be better judged (Darling-Hammond, Wise, & Pease, 1983).
Since the Russian launch of Sputnik, the effectiveness of America’s teachers and schools has become the major concern of American presidents and policymakers and education reform has continued over the years. Tienken (2013) describes the Russian launch of Sputnik as the beginning of a perceived educational crisis in the United States. In response to the crisis, U.S. Congress enacted the National Defense Education Act (NDEA) to assist schools in United States in catching up to the Soviets, although there was no evidence that schools in the United States were failing. Assistance to public schools was offered in an attempt to improve educational programs to meet the critical needs of the country at the time.
Reform attempts continued into the 1980s and 1990s, when increased attention was brought once again to teacher effectiveness and quality. Teacher evaluations became a critical piece for improving instruction. During this time period, many states implemented systematic processes for evaluating teachers. As part of the process, many states started to mandate that teachers be evaluated for licensing, promotions, merit pay, and renewed certification (Daley & Kim, 2010).
Just ten years later, President George Bush signed into law the No Child Left Behind Act (NCLB) as his attempt to close the achievement gap between disadvantaged and advantaged children in America. According to Tanner and Tanner (2007), NCLB drastically changed the way American schools operated. School administrators and teachers were required to
determined by student performance on state assessments. Students were required to be tested annually in reading and math, and student performance on those assessments was to be made public. If schools failed to made adequate yearly progress for three consecutive years, they then faced serious consequences, including the reallocation of federal funding to nonpublic schools, to which parents had the right to send their children if their current schools failed to demonstrate the yearly progress NCLB demanded. Unfortunately, although well intended, NCLB also failed to address the fact that as school communities experienced shifts in their demographics, the result could be significant differences in test scores (Tanner & Tanner, 2007).
Although NCLB did not specifically address the teacher evaluation system, it continued to stress the reliance on student test performance to determine whether or not schools were of high quality. According to Hazi and Rucinski (2009), NCLB led to a trend of expanded state oversight and regulation of local evaluation practices by attempting to define teacher quality, set minimum standards for evaluator training, and require data collection. Parents relied on this information to make choices about their child’s education, and the public’s perception relied on this information to draw conclusions about the quality of a school and its instructors.
Since NCLB was enacted, both federal and state governments have continued to make standards-based educational reform a top priority. President Obama has put education reform on the forefront of his agenda. Although states have been relieved of some of the requirements of NCLB, President Obama has continued to push high standards and accountability for students and teachers with the implementation of the Race to the Top Initiative (RTTT), a creative reform movement that was intended to spark competition among schools and innovative practice among teachers (Towe, 2012). RTTT was coupled with the creation of the Common Core State
bureaucrats from 48 states, two territories, and the District of Columbia. The CCSS was
intended to include rigorous content and application of knowledge through higher order thinking, be closely aligned with college and work readiness skills, capitalize on current state standards, and be internationally benchmarked and based on evidence and research (Tienken & Orlich, 2009). The RTTT initiative awards schools with funding and other merits if they are successful at implementing the CCSS and can demonstrate such through high scores on high-stakes
assessments.
Since the focus on school improvement and standards-based reform movements have been in place, there has been increased attention on student achievement and teacher quality. The Educational Testing Service (2009) explains that when teacher evaluation is approached meaningfully, it can be used as a tool to support school districts in targeting professional development to address teachers’ needs. Further, recent literature indicates that student achievement is directly linked to teacher quality. However, according to Medley and Coker (1987), there is clear evidence that traditional evaluation systems have not been associated with higher student achievement. Therefore, there is a call for a change in how teachers are
evaluated.
While the research is clear that the impact of an effective teacher is the single most important factor influencing increased learning, recent changes in policy to include student performance on standardized assessment as a measure of teacher quality may not be the most effective approach to solving this dilemma. As Maylone (2002) explained, “Policymakers appear to be operating under the assumption that student scores on standardized tests provide valid and reliable indicators of the quality of schools and school districts” (p. iv). However, the profession as a whole has voiced major concerns about using student performance on
standardized assessments as a valid measure of teacher quality and sometimes this trepidation comes with good reason (Tucker & Stronge, 2005). Specifically, this approach often fails to consider the responsibility of other stakeholders, such as parents, who are involved in the student learning process. Failing to recognize that teachers are not the only stakeholders responsible for student achievement can lead to unfair evaluations and scapegoating.
Another reason such a process can lead to unfair evaluations is linked to how student learning is actually measured when it is based on a single performance on a standardized
assessment. Rather than relying on an end of year high-stakes state assessment, a more accurate measure of student achievement could be determined by the administration of
curriculum-aligned assessments that are given to students at both the beginning of the year and the end of the year (Tucker & Stronge, 2005). While policymakers have recognized the need for change within the teacher evaluation system, a quick rush to utilize results from high-stakes assessments may not provide accurate information about teacher quality. The need for change is multi-faceted, challenging, and as a result of legislation such as NCLB, urgent.
High-stakes Assessment and Teacher Evaluation
One of the major concerns surrounding the use of student achievement data on high-stakes standardized assessments is the fact that standardized assessments are not necessarily valid measures of student achievement nor are they designed to draw conclusions about teacher effectiveness. Rather, they are single snapshots in time that are meant to help teachers
understand what students have learned which can lead to the delivery of effective instruction as a result.
Another reason the use of student outcomes on high-stakes assessments may not necessarily reflect teacher quality is that the assessments being used may not even measure
quality of instruction. Very often student achievement on high-stakes assessments is directly linked to socioeconomic status. “A meaningful amount of what’s measured by today’s high-stakes tests is directly attributable not to what students learn in school, but what they bring to school in the form of their families’ socioeconomic status or the academic aptitudes they happened to inherit” (Popham, 2001, p. 18). If students come from affluent homes, they are more likely to perform well on standardized assessments than students who come from environments in which learning outside of school is minimal (Popham, 1999). Does this phenomenon then fairly measure teacher quality?
Popham (2001) believes that, in fact, there is abysmal instruction taking place in some of the nation’s wealthiest schools; but because of students’ socioeconomic backgrounds and
experiences at home in relationship to their learning, they will still outperform students who come from low-income backgrounds (p. 18). Unfortunately, the reliance on results from high-stakes tests to evaluate teachers often fails to measure the actual quality of instruction students actually receive due to these factors. This causes a massive misidentification of schools’ effectiveness, and teachers that are actually good teachers are being identified as needing improvement. These teachers, according to Popham (2001), are actually good teachers who when measured by any other standard, would probably be considered “skillful” (p. 18). The opposite is also true. There are plenty of weak teachers in schools with students who score high because of their socioeconomic status and family background; but they are not being identified as needing improvement, and those students are being subjected to teachers who actually need to significantly alter the way they teach (Popham, 2001). No matter how one looks at it, student performance on standardized assessments is, as the research shows, directly linked to one’s socioeconomic background.
Community and Family Demographics and High-Stakes Assessment
There is no doubt that student achievement should be at the forefront of policymakers’ minds. As Koretz (2008) explains, the main goal of educational improvement is to accurately differentiate between effective and ineffective programs, schools, and systems so that necessary changes can be made. However, if we are going to make such decisions, we must consider the impact of non-educational factors, such as community and family demographics, on student achievement on standardized measures. Determining what causes a school to perform well or poorly is not always easy once these factors are introduced. Further, there is a vast amount of research that has been done in the United States indicating that variations in social factors can account for the bulk of variability of scores. However, other researchers maintain that some educational factors, such as quality of teachers, also have a large influence on the variability on test scores (Koretz, 2008). Either way, “The impact of non-educational factors on test scores is widely ignored—by politicians who want to claim credit or place blame; by the press, which wants to tell a compelling story; by both consumers and agents in the real estate trade; and, all too often, by educators” (Koretz, 2008, p. 117). Ignoring these factors does not help achieve the main goal of identifying effective versus ineffective programs, structures, or teachers. While all stakeholders would probably agree that low scores are an indication that something is wrong and further intervention is warranted, blindly using test scores without considering how
non-educational factors such as socioeconomic status are impacting scores will not help.
Policymakers cannot give “all the credit or blame to one factor, such as school quality, without investigating the impact of others” (Koretz, 2008, p. 123).
One of the major flaws of utilizing student outcomes on standardized assessments to assess school and teacher quality lies in the basic design of the assessment. Very often, test
items are directly linked to socioeconomic status. Students who are from middle class or affluent families are more likely to answer test items correctly than children with lower socioeconomic status (Popham, 2001). According to Popham (2001), social factors such as parental education levels and family income can directly impact how a student responds on a test item. Students who are from wealthier families are more likely to have out-of-school experiences that enrich their in-school experiences (Popham, 2011). In wealthier homes, students are more likely to have access to educational cable channels such as The History Channel or The Discovery Channel as well as the kinds of books, newspapers, and magazines on which test items on
standardized achievement tests are based. Adults in these homes are more likely to speak proper American English because affluent homes often house well-educated people. When students who live in these environments encounter test items that require an understanding of standard American English, they are more likely to answer correctly than a student who comes from a non-English speaking home (Popham, 2001). Researchers have conducted item analyses of two national standardized tests and discovered that in the area of language arts, up to 65% of test items are linked to student SES (Popham, p. 65). Based on this information, the question is whether or not it fair to judge the effectiveness of a teacher based on student scores on
standardized assessments in which more than half of their questions include test items that are based on community social factors.
Several studies have been conducted examining the link between such factors and student achievement on standardized assessments. Maylone (2002) found that three family
socioeconomic factors (student living in poverty with a single parent who is not a high school graduate) accounted for 60% of the variation in average test scores among Pennsylvania school districts. Similarly, a study conducted by the Educational Research Service (1994) showed that
poverty alone accounted for 56% of the variance among state average test scores on the NAEP-92 Trial State Assessment in mathematics, with 89% of those variations due to poverty and three other out-of-school social factors: number of parents living at home, parents’ education, and community type. Jones (2008) attempted to determine whether or not student scores on New Jersey’s public high school standardized assessment, the High School Proficiency Assessment (HSPA), could be predicted based on out-of-school factors that included student mobility, student attendance, and level of English language proficiency, among five other variables. This study found that all eight variables, including the out-of-school social factors listed above, account for nearly 90% of the variability in test scores for all students studied. Overall, Jones (2008) revealed that a relationship exists between out-of-school social variables and student performance on high-stakes assessments and that student scores may very well be influenced by social factors that teachers cannot control.
Another study conducted by Sirin (2005) found a medium to strong relationship between socioeconomic variables and student achievement through the meta-analysis of 74 independent studies published between 1990 and 2000. That is, the amount of school and community resources a student has can directly impact his or her achievement. Coleman (1988) further explains that of all of the factors examined in the literature, SES is one of the strongest indicators of student performance. A child’s SES can directly and indirectly impact student performance. Students of high SES who are provided resources at home or come from families who have the income to support learning demonstrate higher levels of achievement than those who do not (Coleman, 1988).
In a study conducted by Turnamian (2012), 54% of the variance in school district percentages of Proficient or above on a high-stakes language arts state assessment in Grade 3