ISSN 1330-3651 (Print), ISSN1848-6339 (Online) DOI: 10.17559/TV-20160525151022
STUDY ON CUTTING HIGH-SLOPE STABILITY EVALUATION BASED ON FUZZY
COMPREHENSIVE EVALUATION METHOD AND NUMERICAL SIMULATION
Xiaodong Yan
Original scientific paper The cutting of a high-slope is a complex nonlinear system that is random, fuzzy and variable. Stability evaluation for it from both qualitative and quantitative perspectives is essential in disaster management. This study firstly conducts the engineering experience analogy, giving a qualitative description of the stability of the slope. Then the cutting slope stability evaluation index system and the grade evaluation standard was established. With the weight vector and membership degree in the index evaluation system determined by the fuzzy comprehensive evaluation method, the degree of stability of the slope was comprehensively evaluated according to the membership function group. The key point on the slope was quantitatively evaluated by the numerical simulation method based on qualitative results acquired from fuzzy comprehensive evaluation. This research shows that this comprehensive analysis model can be more accurate in reflecting the various factors affecting the stability of a high slope. Furthermore, the calculation and analysis result is reasonable and of relatively higher precision, so it can provide some guidance for complex slope engineering and its systems. Keywords: accurate evaluation; cutting high-slope; fuzzy analysis; numerical simulation
Analiza procjene stabilnosti kod usijecanja velike kosine temeljena na fuzzy integralnoj metodi procjene i numeričkoj simulaciji
Izvorni znanstveni članak Usijecanje velike kosine je složeni nelinearni sustav koji je slučajan, nejasan i promjenljiv. Procjena njene stabilnosti, uzevši u obzir i kvalitativne i kvantitativne mogućnosti, bitna je u procjeni izbjegavanja velike nesreće. U radu se najprije na temelju inženjerskog iskustva daje kvalitativni opis stabilnosti kosine. Zatim je određen sustav indeksa procjene stabilnosti usijecanja padine i standarda stupnja procjene. S težinskim vektorom i stupnjem uključenja u sustav procjene indeksa određenog fuzzy integralnom metodom procjene, sveobuhvatno je procijenjen stupanj stabilnosti kosine u skladu s funkcijom. Ključna se točka kosine kvantitativno procijenila metodom numeričke simulacije na osnovu kvalitativnih rezultata dobivenih fuzzy sveobuhvatnom evaluacijom. Ovo istraživanje pokazuje da se ovim modelom sveobuhvatne analize mogu točnije prikazati razni faktori koji utječu na stabilnost velike kosine. Nadalje, rezultat analize i proračuna je razuman i relativno vrli precizan te može biti putokaz u kompleksnom inženjerstvu velike kosine i njegovim sustavima.
Ključne riječi: fuzzy analiza; numerička simulacija točna procjena; usijecanje velike kosine
1 Introduction
The steadiness of cutting high side slope is subjected to a combination of side slope lithology, including rock mass structure, geological structure, degree of weathering degree, moisture, disposition of bed, structural plane and other relevant factors. If slope structure is developed, the interaction between its bed disposition and slope poses a more significant influence to the side slope steadiness. Hence, the factors that influence the stability of side-slope are numerous, some of which are difficult to be confirmed and estimated. Through the above factors influencing side-slope stability, some scholars conducted a series of research projects [1÷3], and the current evaluation methods for side slope steadiness are divided into two types. The first one is quantitative evaluation, which includes the engineering analogy method, limit equilibrium method and numerical calculation analysis method. Although these methods can analyse the steadiness of side slope to some degree, they still have difficulty in judging and confirming uncertain, random or complicated factors [4÷7]. The second type is uncertainty analysis methods such as the fuzzy evaluation method [8], neural network evaluation method [9÷12], grey theory method and genetic algorithm [13], etc. However, it is for this type of method to accurately judge and confirm random, unclear or changeable factors in a complicated side slope’s qualitative and quantitative analysis via solely the evaluation method.
Hence, following the research above, this article proposes to combine the uncertainty analysis method and numerical simulation to analyse the steadiness of side
slope from quantitative and qualitative perspectives to provide a leading for project construction.
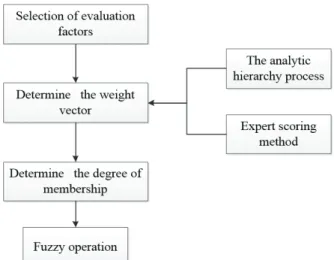
Figure 1 Operation flow chart of the fuzzy comprehensive evaluation model
2 Fuzzy comprehensive evaluation method:
The uncertainty analysis method refers to adopting the fuzzy transform principle and maximum membership principle to analyse with consideration of relevant factors. Such a model is adopted with wizard mode and finished in four steps to select quantitative index factors. The confirmation of weight vector can be done by two methods: analytic hierarchy process (AHP) and the expert evaluating method. For quantitative index factors,
membership is confirmed by membership function, while for the qualitative index factors, it is confirmed by uncertain computation, as it is a discrete date. The implementation of such a model is shown in Fig. 1.
In the end, the results from uncertain computation are regarded as the degrees of danger and taken back to landslide monitoring and early warning systems, which will be illustrated by figures.
2.1 Establishment of the model
Firstly, the evaluation factors were selected, then it should establish the evaluation factors set and determine the forecast evaluation set; that is, ranged target levels of very unstable, unstable, potential unstable, basically stable, and stable.
The evaluation factors set are: }
,..., ,
{ 1 2 m
U = m m m (1) The evaluation results set are:
} ,..., , {v1 v2 vm
V = (2) In the same way, it can be concluded that the single factor evaluation set under the influence of the factor ui.
} ,..., , {i1 i2 ij i r r r r = (3) On the basis of this, the general evaluation matrix is constructed, and is made up of m factors; that is:
mn m m n n r r r r r r r r r R 2 1 2 22 21 1 12 11 = (4)
where R is the evaluation factor set U to the evaluation result set of a fuzzy relation, rij is membership degree of
the factor ui versus vicorresponding. When carrying out a
single factor ui slope safety assessment, it is defined as
fuzzy sets: ) ,..., , (a1 a2 an A= (5) where 1. 1 =
∑
= m i i aThe weight vector matrix and fuzzy "synthetic", calculated evaluation set are:
) ,..., , (b1 b2 bn R A B= ⋅ = (6) Where, (0 < bj ≤ 1), , 0,1 ,..., . 1 n j r a b m i i ij ij =
∑
= =According to the principle of maximum of membership degree, the value of bi0 was calculated as bi0
= max{bj}.
2.2 Confirmation of weight vector
The weight vector is confirmed by the analytic hierarchy process (AHP), which is strictly verified in mathematical evidence, so it is suitable for various complicated vector systems to analyse, confirm and check its importance sequence.
2.3 Confirmation of rijmembership
The confirmation of membership value of those quantitative predictors can be expressed by trapezoidal membership function, and given μ1 as the first danger degree (the steady membership); given μ2 as the second danger degree (the basically steady membership); given μ3 as the third danger degree (the potential unsteady membership); given μ4 as the fourth danger degree (the unsteady membership); given μ5 as the fifth danger degree (the extreme unsteady membership).
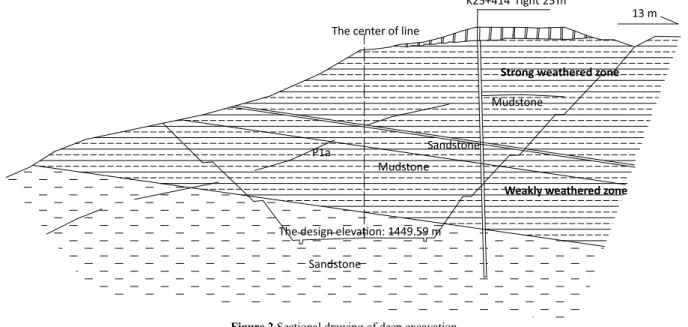
3 Project case analysis 3.1 General of project
A certain section of highway in Shanxi province is deep-cutting, which spans 455 meters. In the middle of route, the maximum depth of digging reached 38,0 meters, the maximum height of side slope was 46,3 meters. The cutting side slope is composed of slightly-intensive collapsed silt from the Quaternary period (Q3p)l and intensively-moderately weathered sandy shale, sandstone and shale P1X and P1S from the Permian period. The component type of this section’s side slope is upper-lithologic side slope, so it is soil-stone composite side slope. The research shows that the sliding aspect of the left side incline direction is the same as that of rock mass, presenting an unfavourable combination. Whereas, it is converse with the right slope, it presents a favourable combination. Both sides of the cutting are high side slopes, in which the gob covered a length of 470 meters and a thickness of 4 meters and adopted a short wall mining method. This gob is located 76 ÷ 167 m
underground where the ground surface has cracks and sinks.
3.2 Comprehensive uncertain analysis for cutting steadiness
3.2.1 Establishment of risk evaluation index system
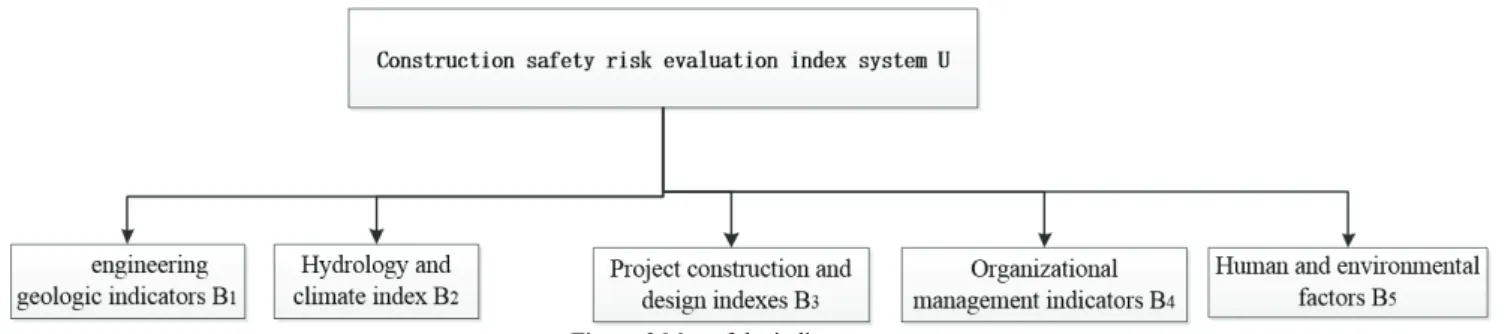
According to reference [13], the engineering geology, hydrogeology, project design and construction, organization and management and relations between human and environment should all be taken into consideration and selected when considering the identification method of features and risk sources of landslide, collapse and sharp deformation in the side slope of a road bed. Meanwhile, it should be considered that the road bed is located in a gob when the first index is further specified. Hence, the location risks should be considered more seriously when designing the project. From the analysis above, the specific risk evaluation indexes [14÷18] are shown in Fig. 3.
Figure 3 Map of the indicator system
3.2.2 Establishing the evaluation set
V = {v1, v2, …, vn}; that is,{I, II, III, IV}, where I is
safe, II is moderately dangerous, III is dangerous, IV is very dangerous.
3.2.3 Confirmation of evaluation index weight value
The weight vector is confirmed by the analytic hierarchy process (AHP), and its specific computation
processes are shown below:
(1) To compute the judgment matrix
Firstly, the first weight index value is known according to the first evaluation index from the judgment matrix. The weight index value is calculated by expert estimation according to engineering properties and the relationship of each index. Taking the membership degree of slope as an example, because there are five evaluation factors, the weights of each factor are:
In Eq. (7), μm is weights of each evaluation factor x is
the score of expert estimation
Table 1 First class index weights
Risk assessment B1 B2 B3 B4 B5 Wi B1 1,0000 2,0 1,0 2,00 3,00 0,3065 B2 0,5000 1,0 0,5 2,00 2,00 0,1864 B3 1,0000 2,0 1,0 1,00 2,00 0,2460 B4 0,5000 0,5 1,0 1,00 2,00 0,1623 B5 0,3333 0,5 0,5 0,50 1,00 0,0987
(2) CR = CI/RI = 0,0379 < 0,1, Check and test for conformity rate.
From a similar method, the second weight index value and total weight value can be computed [19, 20], which are illustrated in Tab. 2.
Table 2 Weights of evaluation indexes
The first class index Weights (Wi) The second class index Weights (Ri) The total weight (Bi)
The engineering geologic indicators 0,3065
The average slope 0,1463 0,0449
The height of the slope 0,1463 0,0448 Ingredients in geotechnical engineering 0,2218 0,0680 Topography and slope structure 0,2926 0,0897 Slope degree of weathering 0,1930 0,0592 Hydrology and climate index 0,1864 rainfall groundwater 0,5000 0,2500 0,0932 0,0466
vegetation 0,2500 0,0466
Project construction and design
indexes 0,2460
Retaining measures 0,2000 0,0492
The excavation way 0,2000 0,0492
Protective drainage measures 0,2000 0,0492 construction specifications 0,2000 0,0492 The construction technology 0,2000 0,0492 Organizational management
indicators 0,1623
Develop and implement management system 0,2500 0,0406
Training of personnel 0,2500 0,0406
Construction machinery management 0,2500 0,0406 Regular safety inspection system 0,2500 0,0406 Human and environmental factors 0,0987 The number of people The construction of environmental impact 0,2599 0,4126 0,0257 0,0407
Mechanical quantity 0,3275 0,0323
3.2.4 Confirmation of membership
With all membership of indexes being confirmed, the uncertain analysis results can be figured out from applying uncertain computation into uncertain judgment
matrix R and weight vector set W and the default of the computing process. According to the above computation, the uncertain judgment set is:
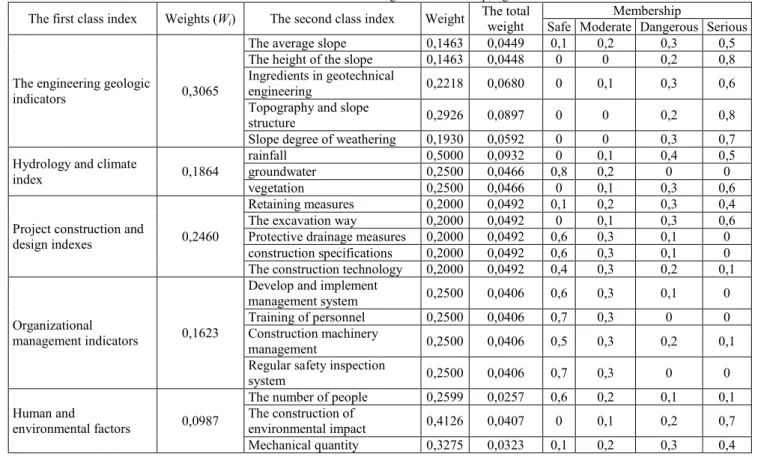
Table 3 Evaluation indexes weight and membership degree
The first class index Weights (Wi) The second class index Weight The total weight Safe Moderate Dangerous Serious Membership
The engineering geologic
indicators 0,3065
The average slope 0,1463 0,0449 0,1 0,2 0,3 0,5 The height of the slope 0,1463 0,0448 0 0 0,2 0,8 Ingredients in geotechnical
engineering 0,2218 0,0680 0 0,1 0,3 0,6
Topography and slope
structure 0,2926 0,0897 0 0 0,2 0,8
Slope degree of weathering 0,1930 0,0592 0 0 0,3 0,7 Hydrology and climate
index 0,1864
rainfall 0,5000 0,0932 0 0,1 0,4 0,5
groundwater 0,2500 0,0466 0,8 0,2 0 0
vegetation 0,2500 0,0466 0 0,1 0,3 0,6
Project construction and
design indexes 0,2460
Retaining measures 0,2000 0,0492 0,1 0,2 0,3 0,4 The excavation way 0,2000 0,0492 0 0,1 0,3 0,6 Protective drainage measures 0,2000 0,0492 0,6 0,3 0,1 0 construction specifications 0,2000 0,0492 0,6 0,3 0,1 0 The construction technology 0,2000 0,0492 0,4 0,3 0,2 0,1 Organizational
management indicators 0,1623
Develop and implement
management system 0,2500 0,0406 0,6 0,3 0,1 0 Training of personnel 0,2500 0,0406 0,7 0,3 0 0 Construction machinery
management 0,2500 0,0406 0,5 0,3 0,2 0,1
Regular safety inspection
system 0,2500 0,0406 0,7 0,3 0 0
Human and
environmental factors 0,0987
The number of people 0,2599 0,0257 0,6 0,2 0,1 0,1 The construction of
environmental impact 0,4126 0,0407 0 0,1 0,2 0,7 Mechanical quantity 0,3275 0,0323 0,1 0,2 0,3 0,4
3.2.5 Fuzzy comprehensive evaluation
After determining the membership degree of each index, the fuzzy operation was used by the fuzzy evaluation matrix (R) and weight set (W). Then, the result of fuzzy operation needs to; that is, the normalized result is the result of fuzzy evaluation. Therefore, the result of
fuzzy comprehensive evaluation is:
) 3989 0 , 2116 0 , 1625 0 , 237 0 ( ) , , , (b1 b2 b3 b4 = , , , , = × =W R B
According to the maximum membership principle, the degree of risk can be judged as extreme danger.
3.3 Computation of analysis results
The road cutting is 455 meters long, and its largest side slope is 46,3 meters high, which is located on the left side of road. The comprehensive analysis of influencing factors on side slope steadiness is demonstrated as follows.
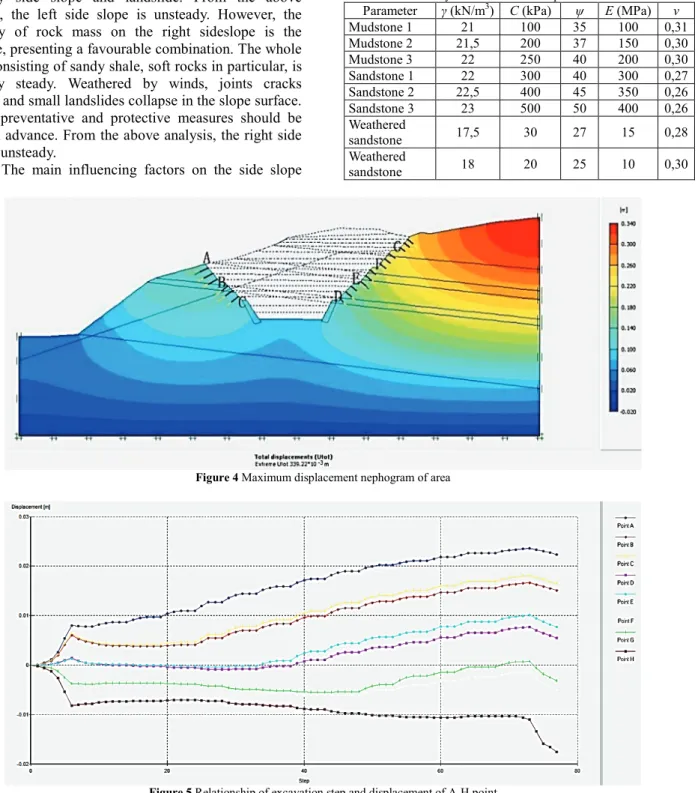
(1) The tendency of rock mass and slope is consistent, presenting an unfavourable combination. The body of the slope consists of sandy shale or sandy shale and silt, from which the upper rocks are seriously weathered with cracks appearing in joints that are combined with soft and hard rocks. The soil is vertically developed and contains pores so that rainfall water can penetrate into the sandy shale or soil-rock surface, resulting in the sandy shale becoming softer and shaped into a soft sandwich or soft-plastic soil, which may subsequently cause a hard-to-harnessed unsteady side slope and landslide. From the above analysis, the left side slope is unsteady. However, the tendency of rock mass on the right sideslope is the opposite, presenting a favourable combination. The whole body, consisting of sandy shale, soft rocks in particular, is basically steady. Weathered by winds, joints cracks develop and small landslides collapse in the slope surface. Hence, preventative and protective measures should be taken in advance. From the above analysis, the right side slope is unsteady.
(2) The main influencing factors on the side slope
include the combined relationships of the both tendency of rock mass and slope, joint cracks and weathering and the erosion effect.
4. Value analysis and check
4.1 Establishment of the finite element model
Selecting a fracture surface K25+414 in the right side at 25 m, a 2D model is set up by Plaxis software. Physics parameters are selected in accordance with a geological investigation report on deep cutting with consideration of digging, the anchorage system and retaining wall. These parameters are shown in Fig. 4. The deformation of A-H points with digging is shown in Fig. 4, and the maximum settlement is shown in Fig. 5.
Table 4 Physical and mechanical parameters of rocks Parameter γ (kN/m3) C (kPa) ψ E (MPa) v Mudstone 1 21 100 35 100 0,31 Mudstone 2 21,5 200 37 150 0,30 Mudstone 3 22 250 40 200 0,30 Sandstone 1 22 300 40 300 0,27 Sandstone 2 22,5 400 45 350 0,26 Sandstone 3 23 500 50 400 0,26 Weathered sandstone 17,5 30 27 15 0,28 Weathered sandstone 18 20 25 10 0,30
Figure 4 Maximum displacement nephogram of area
Table 5 Maximum displacement of A-H point
Point A B C D E F G H The max displacement
(cm) 24 17 18 8 1 0,5 0,3 1,7 As is shown in Tab. 5, with further construction and excavation, the road cutting settlement reached the maximum value in point A at 24 cm. Hence, the result of calculation and numerical analysis is the same.
4.2 Necessary construction measures
According to results from fuzzy comprehensive evaluation and numerical analysis, a sharp deformation appeared in the deep excavation cut. Hence, a landslide and collapse is more likely to occur, and the harnessing of the mined-out area should be given more importance. The measures are divided into a couple of aspects: monitoring and early-warning, engineering protection.
4.2.1 Monitoring and early-warning
The Anchorage system and retaining wall are applied into the side slope, so they should be monitored. As for rock bold, 3÷5 monitoring sites can be arranged in one rock bold, and the protection wall is monitored by a soil pressure meter. The clinometer will be buried in deep road cutting where rainfall meters are installed to monitor rainfall levels and intensity. According to depth and collapse features in the gob area, the full-pressure granting method as well as a supplementary project of granting-retaining wall are recommended to harness this area.
4.2.2 Preventative measures
According to the depth and collapse features in the mined-out area, the full-pressure granting method as well as a supplementary project of granting-retaining wall is recommended to harness this area. Hence, the slope cutting method can be adopted and counter-pressure methods as well as installing a protective wall in the side slope so as to avoid damage from falling stones.
5 Conclusions
With a qualitative description of high cutting side slope steadiness through the engineering analogy method and the establishment of an evaluation index as well as degree standards and the comprehensive evaluation of west side slope from membership functions, several conclusions can be reached, as follows.
(1) The steadiness index establishes five first-class indexes and sixteen second-class indexes, and the risk evaluation is reasonable and feasible.
(2) To conduct a safety evaluation for high cutting slope and a quantitative analysis, key points can be determined through numerical simulation. It can be known that the high cutting slope safety model has a high accuracy and reasonable classification of computation, which can more easily and quickly analyse and provide a protective scheme for complex highway high side slopes.
6 References
[1] Carrara, A. A multivariate model for landslide hazard evaluation. Math Geol. // Mathematical Geology. 15, 3(1983), pp. 403-426. DOI: 10.5545/sv-jme.2014.2046
[2] Xia, Y.; Li, M. Evaluation Method Research of Slope Stability and Its Developing Trend. // Chinese Journal of Rock Mechanics and Engineering. 21, 7(2002), pp. 1087-1091.
[3] Li, Z. Application of Fuzzy Analysis in Slope Stability Evaluation. // Chinese Journal of Rock Mechanics and Engineering. 16, 5(1997), pp. 490-495.
[4] Huang, Z. Q.; Cui, J. L.; Liu, H. D. Chaotic network method for slope stability prediction. // Chinese Journal of Rock Mechanics and Engineering. 2005, 23(22), pp. 3808-3812.
[5] Huang, R. Large-scale landslides and their sliding mechanisms in China since the 20th century. // Chinese Journal of Rock Mechanics and Engineering. 26, 3(2007), pp. 433-454.
[6] Liu, Y.; Chen, C. A new approach for application of rock mass classification on rock slope stability assessment. // Engineering Geology. 89, 1-2(2007), pp. 129-143. DOI: 10.1016/j.enggeo.2006.09.017
[7] Sah, N. K.; Sheorey, P. R.; Upadhyaya, L. N. Maximum likelihood estimation of slope stability. // International Journal of Rock Mechanics & Mining Science & Geomechanics Abstracts. 31, 1(1994), pp. 47-53. DOI: 10.1016/0148-9062(94)92314-0
[8] Vignaux, G. A.; Michalewicz, Z. A genetic algorithm for the linear transportation problem. // IEEE Transactions on Systems, Man and Cybernetic. 21, 2(1991), pp. 445-452.
DOI: 10.1109/21.87092
[9] He, X.; Li, S.; Liu, Y.; Zhou, Y. Analyzing method of rock slope stability based on artificial neural network. // Rock and Soil Mechanics. 24, s2(2003), pp. 73-76.
[10]Shi, H.; Bai, M. Z.; Tan, D. Q.; Wang C. L. On the Optimization of Deformation Prediction Method for Karst Tunnels in Complex Geological Conditions. // Modern Tunneling Technology. 10, 5(2013), pp. 43-49.
[11]Simunovic, G.; Simunovic, K.; Saric, T. Modelling and Simulation of Surface Roughness in Face Milling. // International Journal of Simulation Modelling. 12, 3(2013), pp. 141-153. DOI: 10.2507/IJSIMM12(3)1.219
[12]Klancnik, S.; Begic-Hajdarevic, D.; Paulic, M.; Ficko, M.; Cekic, A.; Husic, M.C. Prediction of Laser Cut Quality for Tungsten Alloy Using the Neural Network Method. // Strojniski vestnik-Journal of Mechanical Engineering. 61, 12(2015), pp. 714-720. DOI: 10.5545/sv-jme.2015.2717
[13]Wang, L.; Yuan, C. C.; Lu, D. G.; Zhang, S. H. Application of rough sets in high-rise building structure's knowledge discovery. // Journal of Harbin Institute of Technology. 38 12(2006), pp. 2073-2076.
[14]Geddes, J. D. Stresses in foundation soils due to vertical subsurface load. // Geotechnique. 16, 3(1966), pp. 231-255.
DOI: 10.1680/geot.1966.16.3.231
[15]Ogura, H.; Yamagata, K.; Ohsugi, F. Study of bearing capacity of nodular cylinder pile by full-scale test of jacked piles. // Journal of Structural and Construction Engineering. 386, (1988), pp. 66-77.
[16]Wang, T. Z.; Wang, C. M.; Huang, X. H.; Zhu, H. B. Spatial distribution of accumulation landslide thrust based on transfer coefficient method. // International Journal of Heat and Technology. 34, 2(2016), pp. 287-292. DOI: 10.18280/ijht.340219
[17]Shu, G. J.; Qian, H. G. Correlation analysis of factors affecting slope stability. // Journal of Southwest Jiaotong University. 38, 2(1991), pp. 23-29.
[18]Pantelidis, L. Rock slope stability assessment through rock mass classification systems. // International Journal of Rock
Mechanics & Mining Sciences. 46, 2(2009), pp. 315-325.
DOI: 10.1016/j.ijrmms.2008.06.003
[19]Hack, R.; Alkema, D.; Kruse, G. A. M.; Leenders, N.; Luzi, L. Influence of earthquakes on the stability of slopes. // Engineering Geology. 91, 1(2007), pp. 4-15. DOI: 10.1016/j.enggeo.2006.12.016
[20]Fall, M.; Azzam, R.; Noubactep, C. A multi-method approach to study the stability of natural slopes and landslide susceptibility mapping. // Engineering Geology. 82, 4(2006), pp. 241-263. DOI: 10.1016/j.enggeo.2005.11.007
Author’s address Xiaodong Yan Faculty of Architecture,
Civil Engineering and Environment, Ningbo University,
818 Fenghua Road, Jiangbei District, Ningbo City, Zhejiang Province, China E-mail: [email protected]