EFFICIENT DATA MINING METHOD TO LOCALISE ERRORS IN RFID
DATA
Bela Stantic MeiLin Chang
Institute for Integrated and Intelligent Systems Griffith University, Queensland, Australia Email: [email protected], [email protected]
ABSTRACT
Since the emergence of Radio Frequency Identifica-tion technology (RFID), the community has been promised a cost effective and efficient means to identify and track large number of items with relative ease. Unfortunately, due to the unreliable nature of the passive architecture, the RFID revolution has been reduced to a fraction of intended audience due to the anomalies. These anomalies are du-plicate, positive and negative readings. While duplicate readings and wrong data (false positive) can be easily iden-tified and reciden-tified, that is not the case for false negative or missed readings. To identify missed readings data min-ing methods can be used. However, due to its vast volume and complex spatio-temporal structure of RFID data, tradi-tional data mining methods are not necessarily directly ap-plicable. In this paper we propose method to identify pos-sible missed RFID readings by applying association rules data mining method. In empirical study we show that our algorithm is accurate and efficient and also we show that it scales well with increased number of rows therefore it is applicable on vast volume on spatio-temporal RFID data. KEY WORDS
RFID Applications, Data Mining
1
Introduction
Radio Frequency Identification (RFID) technology has opened up the possibility of allowing automatic wireless data collection. Despite advances in technology for captur-ing data, wrong data is still present in almost all application systems. Missing or inconsistent data has been a pervasive question in data analysis since the original data collection.
The RFID system consists of tags, which uniquely identifies objects, and readers that scan tags. Most often passive RFID tags are used due to their low price. There-fore systems with passive tags produce problems which reduces the quality of the data recorded. These recorded problems come in the form of three data anomalies: Unre-liable readings or Wrong data,Missing DataandDuplicate Data. While duplicate and wrong data (false positive) can be easily identified and rectified, that is not the case for missing data. Therefore, missing data represents the most
hazardous problem, as the data are not and will never be recorded.
In order to rectify missing data, the first step is to identify which RFID data are possible missing. Basically, RFID data represent spatio-temporal movement of tagged objects. These tagged objects have tendency to move gether over the time and space (tagged objects are stored to-gether in boxes, boxes are stored on same pallet, etc). Data mining methods can be used to identify the rules of object movement and based on those rules to create a path tree. Looking into spatio-temporal path tree it is possible with high accuracy to make a valid assumption which tagged ob-jects are not identified at certain location and then to take appropriate action to insert those data.
In this work, we propose an algorithm to identify pos-sible missing spatio-temporal RFID data by employing as-sociation rules data mining method. In empirical study, we show that our algorithm is accurate, efficient and scales well with increased number of rows, therefore we con-cluded that it is applicable on RFID data.
2
Background
Radio Frequency Identification (RFID), has been a much researched area in recent years due to its promises of wireless automatic tagged object identification. It uses radio-frequency waves to transfer data between readers and moveable tagged objects. RFID has been adopted for more efficient manufacturing, logistics and supply-chain man-agement such as Walmart, Target and Albertsons, and as a measure for security enforcement (9). The main compo-nents of the RFID system are:
Tag- A RFID tag has in its memory unique Electric Product Code - EPC. The tag is also called a transponder. There are three types of RFID tags: Passive,Semi-Passive and Active. The tag itself is made up of three different parts: theChip, which holds the information the tag is to dispense;Antenna, which is used to transmit the signal out; and thePackaging, which houses the chip and antenna and may be applied to the surface of tagged objects. Further-more tags can be read only or rewritable (10).
Reader- A reader comes with one or more antennas that converts the radio waves reflected back from the tags into the digital information. Readers are usually mounted
to the fixed point; however, they can be as well hand-held and moveable. For example, a reader can be set up in a warehouse entrance, exit or point of sale for fixed spot or be hand-held and wireless for mobile access (10).
The exact content of EPC depends on application do-main. It stores unique number and additional information that identifies tagged object. When the tag’s signal is within a reader’s area, the antenna enables chip to transmit the in-formation stored in the tag to the reader. The reader will convert the radio waves reflected back from the RFID tag into the digital information and pass that information to a host computer (6).
The price for passive RFID tags has dropped signifi-cantly, and taking into considerations the advantages of the RFID technology, the RFID tagging is becoming competi-tive with printed barcodes. It is expected that the RFID tags will replace bar codes in near future. For example, Wal-mart, Target and few other large retailers are already using RFID tagging in their warehouses and distribution centers, however at this stage only on pallet and case level. It is ex-pected that the price of passive tag further drop in near fu-ture, which will enable tagging on item levels as well. Item level tagging will enable retailers to track the movement of products from suppliers to warehouses, and eventually to the point of sale (8) (4), (5).
2.1 The Structure of RFID Data
The RFID system allows readers to read tags without line of sight within the range of the reader. The original RFID data are usually stored according to the time sequence. The layout of data is(EPC, location, time). Periodically reader scans tags within the reader’s area therefore a single tag has multiple readings at samelocation, each reading is at fixed time periods (8). Location is the place where the RFID reader is located. A sample of RFID data is shown in Fig-ure 1.
In order to reduce the amount and redundancy of RFID data the original format is preprocessed and con-verted into more suitable format:(EPC, Location, Time in, Time out).EPCis the unique ID which uniquely identifies tagged object whileTime inis time when the object ID was first identified at the specifiedLocation. And, theTime out is the time when the object was last time identified at the Location(8). The compressed forms of sample RFID data data is shown in Figure 2.
Figure 1. Original RFID Data (8)
Figure 2. A Compressed form of RFID Data (8)
In this work, and in line with widely accepted format, we will use the compressed format of RFID data, where the time period represents time during a particular tagged object is present at a particular location.
2.2 Issues with RFID data
RFID has been widely used in a variety of industries such as retail, postal package tracking, pet identification, health care, banking, toll charge and even baggage and passenger tracing at airports. However, missing, duplicate or incon-sistent data have been a pervasive weakness in RFID tech-nology. No matter how efficient the process of data col-lection is, errors will still occur. Thus, data validation and correction cannot be ignored.
Missed readings, unreliable readings (wrong data) and data redundancy (duplicate data) are three common forms of data errors in RFID application systems (6).
Missed readings means that the system did not re-port objects which are actually present at specific location. Missed readings are very common in RFID systems and of-ten happen in systems with low-cost and low-power hard-ware in wireless communications. The current RFID sys-tems suffer from frequent missed readings. If the location of tagged object is constantly changing, the system will have difficulties in grouping the items and it will be hard to find out the correct unit of spatial granule (6).
The characteristic of the RFID application system is different than the traditional data application system. Con-sequently, traditional data analysis techniques are no longer directly applicable for RFID data. Moreover, considering the fact that the vast volume of RFID data only has 65%of valid and valuable data (6), the quality of RFID data clean-ing becomes the prominent problem.
The primary purpose of data cleaning is identification errors and causes, then using related information to im-prove the collection of data to prevent those errors from re-occurring, and also to clean the wrong data in the databases.
2.3 Data mining methods
Data mining is a process of nontrivial extraction of im-plicit, previously unknown and potentially useful informa-tion from the data which is stored in a database (1). Using data mining methods or algorithms, the useful knowledge hiden in the vast volume of data can be discovered. In order to get that valuable knowledge many methods have been presented in literature. There are several strategies for the data mining such as classification, clustering, association rules, estimation, novelty detection and sequence detection. Association rules are mostly used in cases where there is a need to deal with a large data set (2). Therefore in our study we will utilise association rules.
Association rulesare one of the most popular meth-ods of data cleaning and the most common representation for local patterns in data mining. The idea of this algorithm is to find frequent itemsets from a transaction dataset and derive association rules. There are two measures for asso-ciation rules: Support, which is percentage or fraction of transactions that containX∪Yto the total number of trans-actions in the database.X−→Yhas supportSifP(XY) = S; andConf idence, which is percentage or fraction of num-ber of transactions that containX ∪Y to the total number of records that containX.X −→Y has confidencecif:
P(sup(LH.S∪RH.S)|sup(LH.S) ) = c
LH.S - Left hand side, in this case equalsX (3).
3
Related Work
There is a number of papers found in literature which fo-cuses on cleaning data by using different data mining meth-ods. In this section we briefly discuss typical representa-tives and highlight why they cannot be directly applied on large volume of spatio-temproal RFID data.
• Weijie Wei et al. presented a data cleaning method which is based on the association rules. Basically, the method is based on business rules to generate associa-tion rules with the new advanced business rules. From these advanced business rules, they identify and clean the missing data (14). They consider business rules for cleaning dirty data, therefore this method is not applicable on RFID data.
• Gerardo et al. employed the Apriori algorithm to han-dle the missing data (7). They use pairwise dele-tion and casewise deledele-tion for deledele-tion of wrong data, and mean substitution for recovering and deduction of missing value.
• Chih-Hung Wu et al. used the concept of association rules for completing missing data (15). They consid-ered each factor of association rules to identify and guess the possible value of missing data.
• Frank Wang and Na Helian implemented algorithm to mine global association rules (13). They summarised a few types of counter item sets from their result. • Maletic et al. presented extension of the Boolean
as-sociation to incorporate ordinal relationships among data items and then identify possible errors in data sets (11). They used association rules to compare each item with minimum support and minimum confi-dence. It is a simple and clear method; however, it only focuses on the ordinal rules therefore it is not suitable for identifying missing records in RFID data. Most presented methods rely on classic Apriori algo-rithm which requires repeated scans of the whole database thereby resulting in unrealistically heavy CPU and disk I/O access, therefore it is not suitable for large volume of RFID data (12).
4
Algorithm to Identify Errors in RFID Data
In the following section, we will describe the definitions and procedures of our algorithms. Our method is based on association rules and follows the 1-itemset counter. It relies on every single individual record, which is compared with associated records based on the relationship of movement between each levels.The objective is to identify spatio-temporal rules of RFID data in form of tree structure and then look which data is possible missing as these rules are violated.
The process of using spatio-temporal association rules to identify potential missing records in data sets is based on following ideas:
• Find spatio-temporal rule for tagged objects with a minimum confidenceC.
• Identify the records that broke the rules and which can be considered as potential errors.
The assumption is that all discovered rules that hold for more records represent valid possible spatio-temporal rule. Algorithm start with looking into user-specified min-imum support.
Then (a1,a2,a3, ...,am)⇒(a1µ1a2µ2a3...µm−1am),
where eachµi∈ { ≤, = ,≥ }, is an association rule if:
• a1...amare non-empty and occur together in at least
s% of the n records, whereSis the support of the rule. • In a subset of the recordsR0 ⊆ R, where a1 ... am
occur together and:
φ(rj, a1)µ1 · · · µm−1φ(rj, am)
is true for eachrj ∈R0. Thus|R0 |is the number of
records that the rule hold for and the confidence,C, of the rule is the percentage of records that hold for the ruleC=|R0|/|R|.
The spatio-temporal rules are identified and they are based on chosen minimum confidence. The minimum con-fidence is chosen empirically, range of values are consid-ered. The results indicate that only high values for confi-dence provides satisfactory outcome. The minimum con-fidence about 99 provides the best result. The algorithm checks the values in those fields within the relationship in-dicated by the pattern. Once every pair of fields that corre-spond to a rule is analysed, the average number of possible error marks for each marked path is computed. Only those paths that are marked as possible errors more times than the average are finally marked as containing a high probability of errors (See Algorithm 1).
Algorithm 1Algorithm Analyse Records (11) begin
foreach record in the database (1...N)do Determine spatio-temporal rule type and pairs Compare item pairs
ifpattern NOT holdsthen
mark each item as possible error end if
Compute average number of marks select the high probability marked errors end for
end
Initially, the algorithm also calculates the support S from the RFID datasets. The result of this calculation will be stored in specifically created support table so that we can utilise this information for the next step without need to scan the original data source again.
Algorithm 2Find Possible Missed Readings INPUT:D- RFID Table
begin FETCH D loop
EPC0 = considered record; ifEPC0 in the first level then
Found = Found + 1;
else ifEPC0 in the next child levelthen Found = Found + 1;
else if...then ...
else ifEPC0 in the last child levelthen Found = Found + 1;
end if
Locations = maximum tree depth of particular EPC; ifLocation<>Found then
Report EPC0 is possible missing at Node/level; end if
end loop end
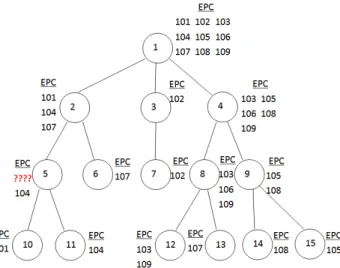
Any missed reading will be basically represented as missing data in the unbalanced tree which is formed based on spatio-temporal rules. For example, the root node (Node 1 or Location 1) of the tree structure has nine records, which are ”EPC = 101, 102, 103, 104, 105, 106, 107, 108, 109”. At the second level (Node two) has ”EPC = 101, 104, 107”; and at the fourth level (Node ten) has ”EPC = 101” and (Node eleven) has ”EPC = 104”. However, the third level (Node five) only has ”EPC = 104”. It is impossible that the previous node (Node two, the second level) and the next node (Node ten, the fourth level) both have ”EPC = 101” but node five (the third level) does not. Based on this observation, by looking into the tree formed as a result of actual data it is clear that the ”EPC = 101” must be missing in node five (the third level) (See Figure 3).
Figure 3. Sample of the tree structure
In the next step, we will calculate the confidenceC from the target data and the support table. The purpose of this step is to attempt to find the number of transac-tions which contain these special datasets in the database such as the relationship betweenEPC = 101 in Location 1, EPC = 101 in Location 2andEPC = 101 in Location 10 in the RFIDtable (See Figure 3). This outcome will be also recorded in Supporttable so that we can use this information for analysis of patterns in the future.
In the final step, we compare the confidenceCwith minimum confidence in order to find possible missing records. Because we employed the single tree structure and the relationship between each level or node is the sin-gle relationship, the confidence for this example must be 100 %. Therefore, if the confidenceCis less than 100 %, we can determine that some records are probably missing in that particular path. By looking into specific data at a specific location, it should be possible to identify which reading is possible missing at specific location. For exam-ple as shown in Figure 3, the confidence (EPC = 101) = 74.99%, as it is less than 100% it indicates that the EPC = 101 reading is possible missing at the some location.
Fol-lowing the spatio-temporal rule that items EPC=101 and EPC=104 are together it is straight forward that EPC = 101 is possible missing at Location five.
In order to investigate the effect of the percentage of missing records to the accuracy of our algorithm we ran-domly deleted certain percentage of RFID data from whole data set. To be able to check the accuracy, we keep original RFID data in separate tables and after the deployment of the deletion procedure and our algorithm, we compare the difference between the original table and the table where the deletion and our algorithm are deployed.
5
Experimental evaluation
In order to demonstrate the applicability of our method we conducted empirical evaluation. In this section we present the experimental evaluation and report our results on the accuracy of finding the possible missed readings, we also provide the CPU usage, physical disk I/O and duration of execution of the algorithm.
5.1 Environment
All experimental results presented in this section are com-puted on a Sun Fire V880 server with 8 x UltraSPARC-III 900 MHZ CPU using 8 GB RAM, running Oracle 11g RDBMS. The database block size was 8 K and the SGA size was 1000 MB. At the time of testing the database server had no other significant load. We used built-in meth-ods for statistics collection, analytic SQL functions, and the PL/SQL procedural runtime environment.
5.2 Data set
We randomly generated data sets of 3,’000, 30’000 and 300’000 records. Every data set has the originalRFID0 table and a test RFID table (RFID1 for 3’000, RFID2 for 30’000 and RFID3 for 300’000 records), on which the dele-tion of records and reconstrucdele-tion with our algorithm will be employed; and aSupporttable where values of sup-port will be captured.
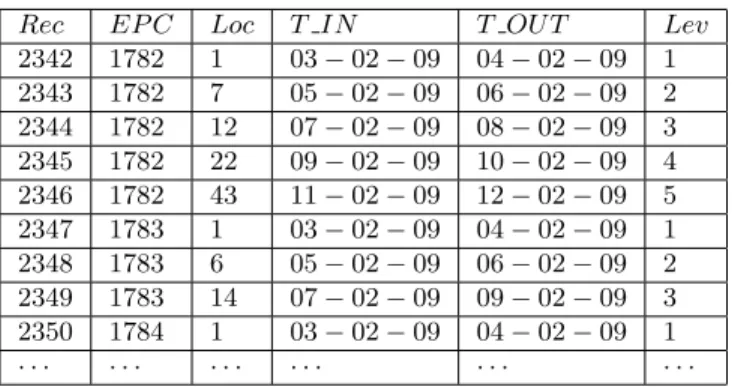
All tables have the same structure in compressed form mentioned in subsection 2.1. In Table 1 we show the struc-ture and sample data. TheRECis the unique primary key, theEPCis the unique tag ID, theLOCrepresents the place or the node where a tag has been scanned.T INandT OUT represent the time when the first time and the last time tag is scanned at a specific location. We also added aLEV col-umn to represent a level or depth in the unbalanced tree, which is identified based on spatio-temporal rules.
In absence of real data we randomly generated the testing data to simulate retail industry with number of dis-tribution centers and also number of shops. These ran-domly generated data are stored inRFID0original table. Generated data follow the certain path of tags movement, therefore it can be represented as a tree structure. Every
Rec EP C Loc T IN T OU T Lev
2342 1782 1 03−02−09 04−02−09 1 2343 1782 7 05−02−09 06−02−09 2 2344 1782 12 07−02−09 08−02−09 3 2345 1782 22 09−02−09 10−02−09 4 2346 1782 43 11−02−09 12−02−09 5 2347 1783 1 03−02−09 04−02−09 1 2348 1783 6 05−02−09 06−02−09 2 2349 1783 14 07−02−09 09−02−09 3 2350 1784 1 03−02−09 04−02−09 1 · · · ·
Table 1. The RFID Table with data
EPC is at first created in the root node and then inserted into other levels randomly. After the originalRFID0table is created, a test RFIDn table is created as a copy of the RFID0table and then a number of missing records were introduced through the random deletion of the specific per-centage of records.
5.3 Query set
In order to investigate the accuracy and the capability of our method to identify missing records, we decided to conduct experiments with different percentages of deleted records from the original tables. We considered 1%, 5%, 10% and 40% of randomly chosen records deleted from RFIDn ta-bles. Then, we executed our algorithms to localise possi-ble missing records from 3’000 records (RFID1), 30’000 records (RFID2) and 300’000 records (RFID3). Accord-ing to the confidence of association rules, we can conclude if some records are possible missing or not. We compare the test table with the originalRFID0table and then calcu-late the accuracy of our algorithm.
5.4 Results and analysis
In this section we present the results of our experiment. The Table 2 shows the result for 3000 records. We randomly deleted 1%, 5%, 10% and 40% of data in original table. TheDurationrepresents the processing time of the execution and in this case, because the number of records is relatively small, is the same regardless of percentage of deleted/missing data.
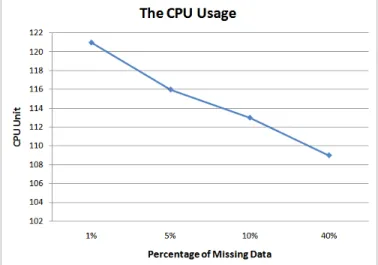
The CPU usage for 3,000 records showed that the CPU usage has a negative growth with the increase of miss-ing records. When the percentage of missmiss-ing records is in-creasing from 1% to 5%, the load of the CPU drops down from 121 to 116. Moreover, when the percentage of miss-ing records rises to 40%, the load of CPU usage decreases to 109. This is because when the number of missing records is getting larger, it will be able to identify less association rules; thus, the usage of CPU is decreasing as well Figure 4.
M issing% M issing F ound Accuracy CP U U sage Disk Read Duration
1 % 30 30 100.00 % 121 59 1
5 % 150 141 94.00 % 116 58 1
10 % 300 260 91.67 % 113 62 1
40 % 1,200 778 65.58 % 109 62 1
Table 2. The Statistic for 3,000 Records
As can be also seen in Table 2 for 3,000 records physi-cal disk I/O reads is not influenced significantly by the per-centage of missing records. This is because scan once of the whole support table needs to be performed while col-lection of data from RFIDn table is through the primary key access.
Figure 4. The CPU Usage for 3,000 Records
Additionally, the results showed that the accuracy will be significantly influenced by the amount of missing records. When the amount of missing records is increas-ing, the accuracy of finding possible missing records is de-creasing. The accuracy is 100 % in case of 1 % of missing records. However when there are 5 % of missing records the accuracy is reduced to 94.00 %. The accuracy has a dra-matic decrease to 65.58 % when the percentage of missing records is 40 %, which means that only 65.58 percent of possible missing records can be identified. This is because algorithm is not able to identify all association rules cor-rectly in case when a lot of records are missing.
In Table 3 we show the result for 30,000 records. We also performed four test with different percentage of miss-ing data. We randomly deleted 1%, 5%, 10% and 40% of records from the original data. Then, we used the our Algo-rithm to find possible missed readings. The result showed that the accuracy ofRFID2for 30’000 records is similar to RFID1(3’000 records) but the results of CPU usage and the usage of physical I/O read are slightly different.
The duration of execution showed that although the percentage of missing records is increasing the duration remains the same. This is because of need to scan once whole support table and while direct access to the RFID table has low cost and therefore do not influence duration significantly. This result is in line with results for 3,000 records only about 10 times bigger which is proportional with difference in number of rows, which indicates that our algorithm scales linearly with increased number of rows.
The CPU usage for 30,000 records is influenced by the percentage of missing records. When the percentage of missed readings is increased significantly, the association rules between records will be reduced so that the load of CPU usage will be reduced as well. The result also show that the physical disk I/O is only slightly influenced by the percentage of missing records.
The accuracy for 30,000 records the result has shown that the accuracy will be influenced by the percentage of missing records, which is the same as for 3,000 records. When the amount of missing records is increased, the ac-curacy of finding missing records will be decreased. When there are 1% of missing records, the accuracy is just under 100%. However, when there is 5% of missing records the accuracy is reduced to 95.67%. The accuracy has a dra-matic decrease: from 89.87 % down to 65.45% when the percentage of missing records change from 10% up to 40% Figure 5.
M issing% M issing F ound Accuracy CP U Disk Read Duration 1 % 300 299 99.67 % 1,030 473 10 5 % 1,461 1,383 94.66 % 1,012 475 10 10 % 2,856 2,571 90.02 % 1,010 479 10 40 % 12,000 7,854 65.45 % 912 479 10
Table 3. The Statistic for 30,000 Records
M issing% M issing F ound Accuracy CP U Disk Read Duration 1 % 3,000 2,974 99.13 % 9,635 4437 100 5 % 15,000 14,254 95.03 % 9,827 4437 99 10 % 30,000 27,057 90.19 % 9,531 4438 97 40 % 120,000 78,462 65.39 % 9,120 4463 94
Table 4. The Statistic for 300,000 Records
We also performed experiments for 300,000 records with different percentage of missing data 1%, 5%, 10% and 40% of randomly deleted records from original table. Comparing the results with 3,000 and 30,000 records, we concluded that the accuracy for 300,000 records is similar, but the results of the CPU usage and physical I/O read are slightly different.
The duration of execution is reduced when the num-ber of missing records is increased. Especially, when the percentage of missing records is 40%, the processing time is decreased to 94 seconds. When the number of rows in table becomes larger, the execution cost is reduced because the number of association rules is reduced, this is partic-ularly the case when a significant percentage of records missing, which reduces the usage of the CPU.
As can be seen in Table 4 the accuracy is influenced by the amount of missing records, which is in line with testing for 3,000 and 30,000 records. When the volume of missing records is increased, the accuracy of finding missed readings will decrease.
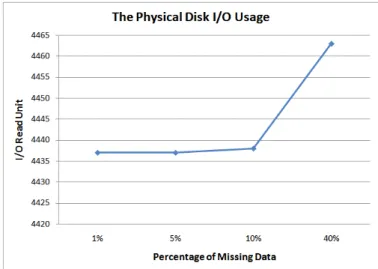
The Figure 6 shows the result of the physical disk I/O. It can be seen that the I/O read will be only slightly influ-enced by the percentage of missing records. When the per-centage of missing records is increased from 1% to 5%, the usage of I/O read almost does not change at all. However, when the percentage of missing records grows to 10% and 40%, the usage of I/O read is slightly increased , Figure 6.
6
Conclusion
Despite advances in RFID technology wide usage is re-stricted due to the unreliable nature of the passive tags. The biggest problem are caused by missed readings and meth-ods to rectify these problems have been proposed in litera-ture.
Figure 6. The Physical Disk I/O Usage for 300,000 Records
In this paper, we proposed algorithms to identify missing RFID data. Proposed algorithm is based on as-sociation rules, it can efficiently indicate which RFID data is possible missing. In order to provide evidence that our algorithm is efficient and accurate, we performed experi-mental evaluation. We tested our method on different num-ber of rows as well as on different percentage of missing data. Based on results, we concluded that our method can be used to efficiently identify missing RFID readings.
Accuracy of the method depends on percentage of missing data and we identified that the cost is increas-ing linearly with the increase of number of records, which proves that our method relies on scan once principle and therefore scales well with the increased number of rows and can be used for large volume of saptio-temporal RFID data.
As of future work, it would be interesting to investi-gate would the usage of different itemset counters for As-sociation Rules, such as 3 or 4-itemset counter sets, be ben-eficial with respect to the accuracy and cost of the method. Also, it would be interesting to investigate would the mul-tiple tree structure influence the accuracy and cost of the algorithm to find possible missing records in RFID read-ings.
Acknowledgements
This research is partly supported by ARC (Australian Re-search Council) grant no DP0557303.
References
[1] A.B.M. Shawkat Ali and S.A. Wasimi. Data Mining: Methods and Techniques.Thomson, Melbourne, AU., 2007.
[2] M.L. Brown and J.F. Kros. Data Mining and the impact of missing data. Emerald Research: Indus-trial Management and Data System, 103(8):611–621, 2003.
[3] T. Calders, B. Goethals, and M. Mampaey. Mining Itemsets in the Presence of Missing Values.ACM’07, pages 404–408, 2007.
[4] R. Das. RFID Market Forecasts 2009-2019. IDtechEX.com, 2009.
[5] R. Das and P. Harrop. RFID Forecasts, Players and Opportunities 2009-2019. IDtechEX.com, 2009. [6] R. Derakhshan, M.E. Orlowska, and X. Li. RFID
Data Management: Challenges and Opportunities. IEEE International Conference, pages 175–182, 2007.
[7] Bobby D. Gerardo, Jaewan Lee, Jungsik Lee, Mingi Park, and Malrey Lee. The association Rule Algo-rithm with Missing Data in Data Mining. ICCSA’04, Springer, 3043:97–105, 2004.
[8] H. Gonzalez, J. Han, D. Klabjan, and X. Li. Ware-housing and Analysing Massive RFID Data Sets. ICDE’06, Atlanta, Georgia, 2006.
[9] D. Lin, H.G. Elmongui, E. Bertino, and B.C. Ooi. Data Management in RFID Applications. DEXA, 4653:434–444, 2007.
[10] P. Liu, S. Liu, and F. Wang. A Temporal RFID Data Model for Querying Physical Objects. TimeCenter Technique Report, 2007.
[11] J.I. Maletic, A. Marcus, and K.I. Lin. Ordinal Associ-ation Rules for Error IdentificAssoci-ation in Data Sets.ACM CIKM, 2001.
[12] J.R. Nayak and D.J. Cook. Approximate Association Rule Mining. Proceedings of the Fourteenth Interna-tional Florida Artificial Intelligence Research Society Conference, pages 259–263, 2001.
[13] F. Wang and N. Helian. Mining Global Associa-tion Rules on an Oracle Grid by Scanning Once Dis-tributed Databases. Springer - Verlag Berlin Heidel-berg, 3648:370–378, 2005.
[14] W. Wei, M. Zhang, B. Zhang, and X. Tang. A Data Cleaning Method Based on Association Rules. ISKE-2007 Proceedings, 2007.
[15] C.H. Wu, C.H. Wun, and H.J. Chou. Using associ-ation rules for completing missing data. Hybrid In-telligent Systems,IEEE Computer Society, pages 236– 241, 2004.