Procedia Computer Science 57 ( 2015 ) 727 – 737
1877-0509 © 2015 The Authors. Published by Elsevier B.V. This is an open access article under the CC BY-NC-ND license (http://creativecommons.org/licenses/by-nc-nd/4.0/).
Peer-review under responsibility of organizing committee of the 3rd International Conference on Recent Trends in Computing 2015 (ICRTC-2015) doi: 10.1016/j.procs.2015.07.463
ScienceDirect
Third International Conference on Recent Trends in Computing (ICRTC’2015)
Classification of Microarray Data using Functional Link Neural
Network
Mukesh Kumar*
a,, Sandeep Singh
b, Santanu Kumar Rath
caDepartment of Computer Science and Engineering, National Institute of Technology, Rourkela, 769008, India bDepartment of Computer Science and Engineering, National Institute of Technology, Rourkela, 769008, India cDepartment of Computer Science and Engineering, National Institute of Technology, Rourkela, 769008, India
Abstract
Microarray dataset often contains a huge number of insignificant and irrelevant features that might lead to loss of useful information. The classes with both high relevance and having high significance feature sets are generally preferred for selecting the features, which determines the sample classification into their respective classes. This property has gained a lot of significance among the researchers and practitioners in DNA micro array classification. In this paper, Functional link neural network (FLNN) with
four different basis functions named as Power series polynomial, Trigonometric, Chebyshev polynomial and Legendre polynomial
functions have been considered to classify microarray data sets usingt-test as a feature selection method. Further, this paper
presents a comparative analysis on the obtained classification accuracy by coupling FLNN with different basis function and other
existing models available in the literature. Performance parameters available in literature such as precision, recall, specificity, F-Measure, ROC curve and accuracy are applied in this comparative analysis to analyze the behavior of the classifiers. From the proposed approach, it is apparent that FLNN using Legendre polynomial is the suitable classification model among FLNN using
different basis functions and other classifiers.
c
2015 The Authors. Published by Elsevier B.V.
Peer-review under responsibility of organizing committee of Third International Conference on Recent Trends in Computing (ICRTC’2015).
Keywords: Classification, Functional Link Neural Network, Gene selection, Microarray, t-test.
1. Introduction
Diagnosis of any disease in particularcancer, is vital for successful application of any specific therapy. Even though the classification of cells into cancerous and non-cancerous categories in relation to cancer diagnosis has improved quite significantly over the last decade, still the research is being carried out and there is a scope for improvement in proper diagnosis. This objective can be achieved with the application of less subjective models. Recent development in diagnosis indicates that DNA microarray provides an insight to cancer classification at gene level. This is due to their capability in measuring abundant messenger ribonucleic acid (mRNA) transcripts for numerous genes concurrently.
∗Corresponding author. Tel.:+91-8984142557
E-mail address:[email protected], [email protected] and [email protected]
© 2015 The Authors. Published by Elsevier B.V. This is an open access article under the CC BY-NC-ND license (http://creativecommons.org/licenses/by-nc-nd/4.0/).
Peer-review under responsibility of organizing committee of the 3rd International Conference on Recent Trends in Computing 2015 (ICRTC-2015)
Microarray based gene expression profiling has emerged as an efficient technique for cancer classification as well as for diagnosis, prognosis, and treatment purposes1. In recent years, Deoxyribonucleic acid (DNA) microarray
technique has shown a great impact in determining theinformative genesthat cause cancer2,3. The major drawback
that exists in microarray data is the curse of dimensionality problem, i.e., the number of genesN by far exceeds the number of samples M i.e., N >> M. This problem hinders the useful information of data set and leads to computational instability. Therefore, selecting relevant genes is a challenging task in microarray data analysis4.
Feature (gene) selection has inspired many scientists to explore in the area of functional genomics. As a result, numerous algorithms as well as models have been developed to achieve a better diagnosis5,6,7. The main objective of
the feature selection (FS) is to (a) avoid over-fitting and improve model (classifier) performance. (b) provide faster and more cost effective models and (c) gain a deeper insight into the underlying processes that generate the data.
In this paper,t-statistic (filter approach) is used to select high relevant genes. Thet-statistic assumes indepen-dence among genes while determining the rankings, and also is computationally efficient8,9. Functional link neural network (FLNN) is a classifier that can be applied on the problem of DNA classification. It comes under the class of higher order neural networks (HONs) and has been used in many applications such as system identification, channel equalization, short-term electric load forecasting, and some of the tasks of data mining10. These networks are
specif-ically designed for handling linearly non-separable problems using appropriate input representation. Thus, suitable enhanced representation of the input data needs to be found out. This can be achieved by increasing the dimension of the input space. The input data which is expanded is used for training instead of the actual input data. In this case, higher order input terms are chosen so that they are linearly independent of the original pattern components.
Along with the feature selection usingt-statistic model, FLNN with different basis functions have been designed and used as classifiers by applying 10-fold cross validation technique. The result obtained for the experimental work carried out on three different datasets, reveals that the proposed approach of FLNN using Legendre polynomial out-performs the result obtained with FLNN using other basis functions and other classifiers available in the literature.
The rest of the paper is organized as follows: Section 2 highlights on the related work in the field of microarray classification. Section 3 presents the proposed work for classifying the microarray data using FLNN with different basis function. Section 4 presents the implementation details for the proposed approach. Section 5 highlights on the results obtained, interpretation drawn from it, and also presents a comparative analysis for gene classification of microarray data with existing classifiers available in literature. Section 6 concludes the paper and considers the scope for future work.
2. Related Work
This section gives a brief overview of the feature selection methods and classifiers used by various researchers. The accuracy rate achieved by different authors for gene classification are listed in Table 1.
3. Proposed work
The presence of a huge number of insignificant and irrelevant features degrades the quality of analysis of the disease like ‘cancer’. To enhance the quality, it is very much essential to analyze the dataset in proper perspective. This section presents the proposed approach for classification of microarray data, consisting of two phases:
1) Preprocessing the input data using methods such as missing data imputation, normalization, and feature selec-tion usingt-statistic.
2) Applying FLNN with different basis functions as a classifier.
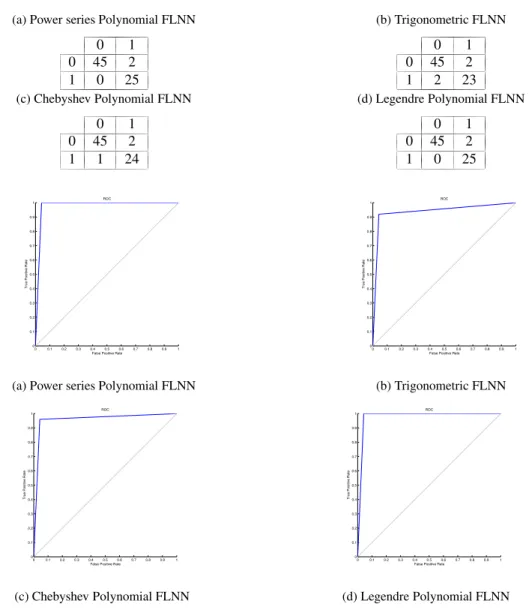
Fig. 1 shows the block diagram of the proposed approach and the brief description of the proposed approach is discussed below:
1. Data collection: The data set for classification analysis, which is the requisite input to the models is obtained from Kent Ridge Bio-medical Data Set Repository1.
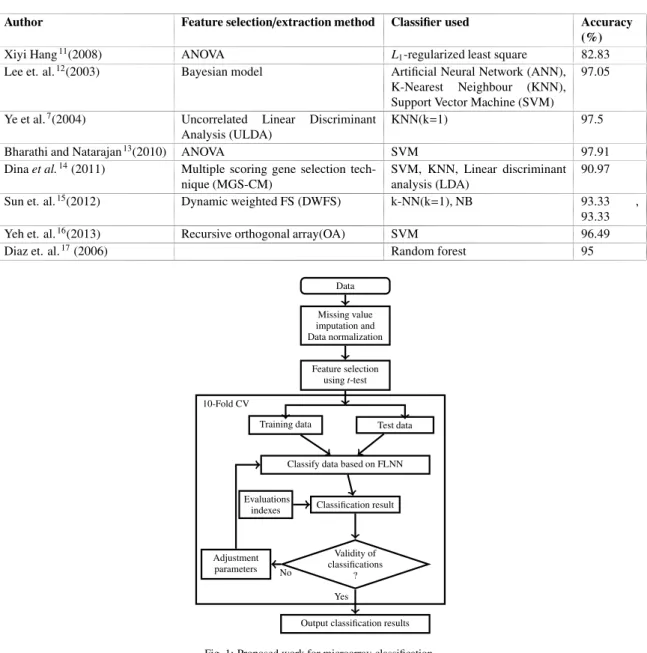
Table 1: Results obtained by various researchers and practitioners for classification using microarray (leukemia) data set. The Table gives the feature selection and classification methodologies adopted and their corresponding accuracies.
Author Feature selection/extraction method Classifier used Accuracy
(%)
Xiyi Hang11(2008) ANOVA L1-regularized least square 82.83
Lee et. al.12(2003) Bayesian model Artificial Neural Network (ANN),
K-Nearest Neighbour (KNN),
Support Vector Machine (SVM)
97.05
Ye et al.7(2004) Uncorrelated Linear Discriminant
Analysis (ULDA)
KNN(k=1) 97.5
Bharathi and Natarajan13(2010) ANOVA SVM 97.91
Dinaet al.14(2011) Multiple scoring gene selection tech-nique (MGS-CM)
SVM, KNN, Linear discriminant analysis (LDA)
90.97
Sun et. al.15(2012) Dynamic weighted FS (DWFS) k-NN(k=1), NB 93.33 ,
93.33
Yeh et. al.16(2013) Recursive orthogonal array(OA) SVM 96.49
Diaz et. al.17(2006) Random forest 95
Data Missing value imputation and Data normalization Feature selection usingt-test
Training data Test data
Classify data based on FLNN
Adjustment parameters Classification result Evaluations indexes Validity of classifications ?
Output classification results 10-Fold CV
Yes No
Fig. 1: Proposed work for microarray classification.
2. Missing data imputation and normalization of dataset:
Missing data of a feature (gene) of microarray data are imputed by using themeanvalue of the respective feature. Input feature values are normalized over the range [0,1] using Min-Max normalization technique18. LetXibe theithfeature of the datasetX, andxis an element of theXi. The normalization ofxcan be formulated as:
Normalized(x)= x−min(Xi)
max(Xi)−min(Xi)
(1) where, min(Xi) and max(Xi) represent the minimum and maximum value for the datasetXirespectively. If in case, max(Xi) is equal to min(Xi), thenNormalized(x) is set to 0.5.
3. Division of Dataset:The data set is divided into two categories such as: training set and testing set. 4. Feature selection from dataset:
t-test statistics has been applied to select the features having high relevance value and hence the curse of dimen-sionality issue has been reduced.
5. Application of a classifier:
FLNN with different basis function have been built to classify the microarray dataset. 6. Testing:
Models are tested using the testing data set and then the performance of the classifier has been compared with various performance measuring criteria such as precision, recall, specificity, F-Measure, ROC curve and accuracy using “10-fold cross validation” technique19.
4. Implementation
4.1. Feature selection using t-test
To overcome ‘curse of dimensionality’ problem for a given dataset, feature selection approaches can be considered. In this papert-statistic filter approach is used to overcome this problem. This helps in achieving better classification rate as it selects a small set of important features. Relevance score (TS) ofithfeature is computed using Equation 2.
T S(i)= X¯i1−X¯i2 sX1X2 1 n1 + 1 n2 (2) s2X1X2= (n1−1)s2Xi1+(n2−1)s2Xi2 n1+n2−2 (3) wheresX1X2is an estimator of the common standard deviation of the two samples and calculated using Equation 3, ¯Xik
represents themeanof featureiof classk∈ {1,2}andsrepresents the standard deviation.
Univariate criterion, which is widely used in a filter method, is applied separately on each feature to show that there is no interaction between the features. A two-class problem for the test of null hypothesis indicates that the
meanof two populations are equal. This implies that there exists no significant difference between theirmeans, and both features are almost the same. Therefore, it is necessary to reject ‘null hypothesis’ (H0) and accept the ‘alternate
hypothesis’ (H1). Hence, one can infer that these features do not contribute much in classification. Hence the features
may be discarded; and those features having significant difference between theirmeansmay be accepted. In other words, alternate hypothesis may be accepted. Here,t-test on each feature has been applied. The effectiveness of separating the groups, is measured by the corresponding p-value of each feature.
The most informative features in the sorted list are identified by sorting the respective features based on their p-values, which provides the probability value of features (i.e.,p<0.05). The number of features for classification can be determined by prior knowledge or it is dictated in advance based on specific constraints.
To overcome this problem, forward feature selection method has been considered, in which top ranked features corresponding to their descending p-value are identified for selecting the genes.
4.2. FLNN Classifier
In this paper four different techniques of FLNN are discussed. These techniques are varied based on their usage of basis function for enhancement of input patterns20,10.
a) Power series polynomial FLNN:
In this architecture, power series polynomial function is used as a basis function. Here the input pattern of a FLNN is a generalized vector representation. For instance, an enhanced pattern of x = (x1,x2,x3) can be generated as
Letf denote the output node’s activation function ,Θbe a bias in f, which is defined as follows:
f(s)= 1
1+exp(−s) (4)
wheresis equal to (wxt-Θ) such that ˆy = f(s). Here,wxtis the inner product ofwwith xt. The square error denoted by E can be measured as:
E=1 2 n i=1 (yi−yˆi)2 (5)
whereyiand ˆyiare the actual and estimated output of theithinput training pattern respectively, and n is the number of training pattern. The training phase is continued to regularly updatewusing Eq. 6, tillEreaches below pre-specified value.
wn+1=wn+ηx∂
E
∂w (6)
b) Trigonometric FLNN:
The basic principle of this model is same as discussed in above model, but the basis function is a trigonometric basis function. Let sayX=[X1,X2, ...,Xn]T is the input pattern vector; therefore the enhanced pattern is obtained by using
the trigonometric function asX∗=[X1,sin(πX1),cos(πX1),sin(2πX1),cos(2πX1)...]
c) Chebyshev Polynomial FLNN:
The basic principle remains same as used in previous models the only difference is basis function here used is Cheby-shev orthogonal polynomial.
The first few Chebyshev polynomials are given as:
Ch0(x)=1,Ch1(x)=x,Ch2(x)=2x2−1,Ch3(x)=4x3−3(x),Ch4(x)=8x3−8x2+1,Ch5(x)=16x4−20x3+5x.
Lets considerX = [x1,x2,x3] as input pattern vector, the expanded pattern obtained by using the Chebyshev
poly-nomial function is given by: X∗ = [1,Ch1(x1),Ch2(x1), ...,1,Ch1(x2),Ch2(x2), ...,1,Ch1(x3),Ch2(x3), ...,], where
Chi(xj) is a Chebyshev polynomial,ithe order of the polynomials chosen and j=1, 2, 3. d) Legendre Polynomial FLNN:
The structure of Legendre neural network is similar to all the previous model. The only difference is that Legendre neural network uses Legendre polynomial function as basis function.
The first few Legendre polynomials are given byL0(x)=1,L1(x)=x,L2(x)=1/2(3x2−1),L3(x)=1/2(5x3−3x)...
and so on. Polynomials are generated by using the following mathematical expression:
Ln+1(x)=
1
n+1[(2n+1)xLn(x)−nLn−1(x)]. (7) Let, the input patternX=[x1x2]T, enhanced by Legendre polynomial function is given as
X∗=[1,L1(x1),L2(x1),L3(x1),L1(x2),L2(x2),L3(x2)].
5. Results and interpretation
In this section, the obtained results are discussed for the proposed work. Three case studies viz., leukemia1,
ovarian cancer21and breast cancer22microarray datasets are considered to find the classification accuracy. “10 fold
cross validation (CV)” is applied to assess the performance of the classifier, as it provides more realistic assessment of classifiers, which generalizes significantly to unseen data.
Since the data set contains a very huge number of features with irrelevant information, feature selection (FS) method has been applied. This helps in selecting the features (genes) which have high relevance score. The genes with low relevance score are stripped off. Thet-test statistic method has been used to choose genes with high relevance score.
After performing feature selection usingt-test, the proposed classification algorithm “FLNN” has been applied to classify the reduced dataset.
When the samples are sequentially selected, the model designed may be over-trained or under-trained. This is because of the samples selected for training may contain either cancerous or non-cancerous data. To avoid this, every
Nth(N =10) sample is selected for testing, and the rest of the samples are chosen as training set. Further, FLNN is trained using ‘10-fold CV’ technique19.
After performing “10-fold CV”, the predicted values of test data are collected in each of the fold and the classifi-cation matrix is designed with their respective feature set using FLNN classifiers. This analysis has been carried out on three different microarray datasets by considering varying number of feature sets. The feature sets are varied in the multiple of five i.e., 5, 10, 15, 20, .... In this studyα= 0.1,η=0.6, andE poch=2000 has been considered. The obtained results using top features have been presented and discussed below.
5.1. Case study: Leukemia cancer dataset
The leukemia dataset consists of 7129 features (genes), and is categorized into two classes viz., Acute Lymphoblas-tic Leukemia (ALL) and Acute Myeloid Leukemia (AML). These two in combination have 72 samples1. Out of 72,
the dataset contains 25 AML and 47 ALL samples. Table 2 shows the classification matrix before the application of the classification algorithm.
Table 2: Before applying classification algorithm
ALL(0) AML(1)
ALL(0) 47 0
AML(1) 25 0
After applying the 10-fold cross validation technique on various feature sets i.e., 5, 10, 15, 20, 25, 30. When feature set with top five features have been selected, the highest classification accuracy is achieved. Fig.2 shows the Mean Square Error vs. Epoch curve on top five features for all the basis functions in FLNN Classifier using Leukemia dataset. Table 3a, Table 3b, Table 3c, and Table 3d show the classification matrix for leukemia data set using FLNN models. These tables show the total number of labeled samples that are correctly classified and misclassified into their respective classes. The rest of the performance parameters are tabulated in Table 4. The ROC curve has been plotted for all the classifiers as shown in Fig.3.
0 200 400 600 800 1000 1200 1400 1600 1800 2000 0 0.01 0.02 0.03 0.04 0.05 0.06 0.07 Epoch
Mean Square Error
Power series Trigonometric Chebyshev Legendre
Fig. 2: Mean Square Error vs. Epoch curve
5.2. Case study: Ovarian cancer
The ovarian cancer dataset consists of 15154 features (genes), categorized as cancer and normal classes, having 253 samples. Out of 253 samples, the dataset contains 162 cancer and 91 normal samples21. Table 5 shows the
Table 3: Classification matrix for FLNN models using Leukemia dataset.
(a) Power series Polynomial FLNN
0 1 0 45 2 1 0 25 (b) Trigonometric FLNN 0 1 0 45 2 1 2 23 (c) Chebyshev Polynomial FLNN 0 1 0 45 2 1 1 24 (d) Legendre Polynomial FLNN 0 1 0 45 2 1 0 25 0 0.1 0.2 0.3 0.4 0.5 0.6 0.7 0.8 0.9 1 0 0.1 0.2 0.3 0.4 0.5 0.6 0.7 0.8 0.9 1
False Positive Rate
True Positive Rate
ROC
(a) Power series Polynomial FLNN
0 0.1 0.2 0.3 0.4 0.5 0.6 0.7 0.8 0.9 1 0 0.1 0.2 0.3 0.4 0.5 0.6 0.7 0.8 0.9 1
False Positive Rate
True Positive Rate
ROC (b) Trigonometric FLNN 0 0.1 0.2 0.3 0.4 0.5 0.6 0.7 0.8 0.9 1 0 0.1 0.2 0.3 0.4 0.5 0.6 0.7 0.8 0.9 1
False Positive Rate
True Positive Rate
ROC (c) Chebyshev Polynomial FLNN 0 0.1 0.2 0.3 0.4 0.5 0.6 0.7 0.8 0.9 1 0 0.1 0.2 0.3 0.4 0.5 0.6 0.7 0.8 0.9 1
False Positive Rate
True Positive Rate
ROC
(d) Legendre Polynomial FLNN
Fig. 3: ROC curve for different classifier using Leukemia dataset. Table 4: Performance analysis of FLNN classifiers using Leukemia dataset.
Classifier Accuracy Precision Recall Specificity F-measure Power series Polynomial FLNN 0.9722 0.9259 1.0000 0.9574 0.9615
Trigonometric FLNN 0.9444 0.9200 0.9200 0.9574 0.9200
Chebyshev Polynomial FLNN 0.9583 0.9231 0.9600 0.9574 0.9412 Legendre Polynomial FLNN 0.9722 0.9259 1.000 0.9574 0.9615
Table 5: Before applying classification algorithm cancer(0) normal(1)
cancer(0) 162 0
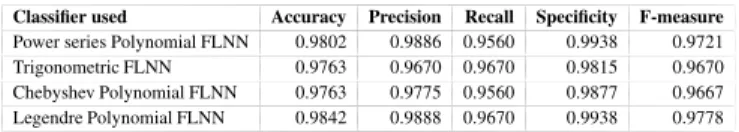
After applying the 10-fold cross validation technique on various feature sets i.e., 5, 10, 15, 20, 25, 30. When feature set with top five features have been selected, the highest classification accuracy is achieved. Fig.4 shows the Mean Square Error vs. Epoch curve on top five features for all the basis functions in FLNN Classifier using Ovarian dataset. Table 6a, Table 6b, Table 6c, and Table 6d show the classification matrix for ovarian data set using FLNN models. The rest of the performance parameters are tabulated in Table 7. The ROC curve has been plotted for different FLNN classifiers in Fig.5. 0 200 400 600 800 1000 1200 1400 1600 1800 2000 2 4 6 8 10 12 14 16x 10−3 Epoch
Mean Square Error
Power series Trigonometric Chebyshev Legendre
Fig. 4: Mean Square Error vs. Epoch curve
Table 6: Classification matrix for FLNN models using Ovarian cancer dataset.
(a) Power series Polynomial FLNN
0 1 0 161 1 1 4 87 (b) Trigonometric FLNN 0 1 0 159 3 1 3 88 (c) Chebyshev Polynomial FLNN 0 1 0 160 2 1 4 87 (d) Legendre Polynomial FLNN 0 1 0 161 1 1 3 88
Table 7: Performance analysis of FLNN classifiers using Ovarian cancer dataset.
Classifier used Accuracy Precision Recall Specificity F-measure Power series Polynomial FLNN 0.9802 0.9886 0.9560 0.9938 0.9721
Trigonometric FLNN 0.9763 0.9670 0.9670 0.9815 0.9670
Chebyshev Polynomial FLNN 0.9763 0.9775 0.9560 0.9877 0.9667 Legendre Polynomial FLNN 0.9842 0.9888 0.9670 0.9938 0.9778
5.3. Case study: Breast cancer
The breast cancer dataset consists of 24481 features (genes), categorized as ‘relapse’ and ‘non-relapse’ classes, having 97 samples22. Out of 97 samples, the dataset contains 46 relapse and 51 no-relapse samples. Table 8 shows the classification matrix before the application of the classification algorithm.
Table 8: Before applying classification algorithm relapse(0) non-relapse(1)
relapse(0) 46 0
non-relapse(1) 51 0
After applying the 10-fold cross validation technique on various feature sets i.e., 5, 10, 15, 20, 25, 30. When feature set with top ten features have been selected, the highest classification accuracy is achieved. Fig.6 shows the
0 0.1 0.2 0.3 0.4 0.5 0.6 0.7 0.8 0.9 1 0 0.1 0.2 0.3 0.4 0.5 0.6 0.7 0.8 0.9 1
False Positive Rate
True Positive Rate
ROC
(a) Power series Polynomial FLNN
0 0.1 0.2 0.3 0.4 0.5 0.6 0.7 0.8 0.9 1 0 0.1 0.2 0.3 0.4 0.5 0.6 0.7 0.8 0.9 1
False Positive Rate
True Positive Rate
ROC (b) Trigonometric FLNN 0 0.1 0.2 0.3 0.4 0.5 0.6 0.7 0.8 0.9 1 0 0.1 0.2 0.3 0.4 0.5 0.6 0.7 0.8 0.9 1
False Positive Rate
True Positive Rate
ROC (c) Chebyshev Polynomial FLNN 0 0.1 0.2 0.3 0.4 0.5 0.6 0.7 0.8 0.9 1 0 0.1 0.2 0.3 0.4 0.5 0.6 0.7 0.8 0.9 1
False Positive Rate
True Positive Rate
ROC
(d) Legendre Polynomial FLNN
Fig. 5: ROC curve for different classifier using ovarian cancer dataset.
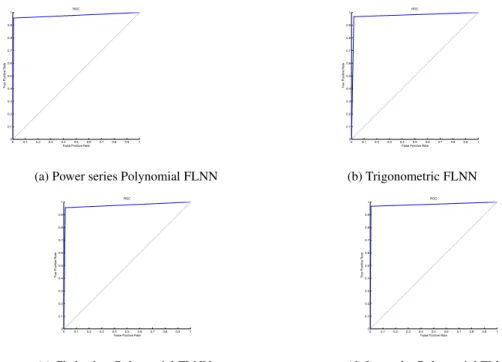
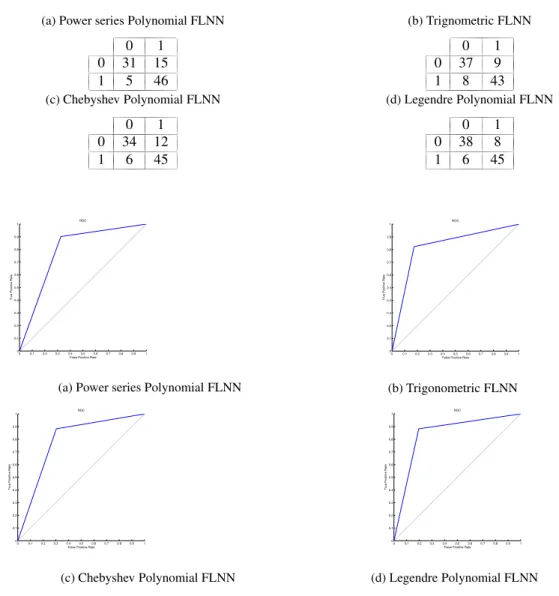
Mean Square Error vs. Epoch curve on top ten features for all the basis functions in FLNN Classifier using Breast dataset. Table 9a, Table 9b, Table 9c, and Table 9d show the classification matrix for Breast data set using FLNN models. These tables show the total number of labeled samples that are correctly classified and misclassified into their respective classes. The rest of the performance parameters are tabulated in Table 10. The ROC curve has been plotted for both the classifiers as shown in Fig.7.
0 200 400 600 800 1000 1200 1400 1600 1800 2000 0.03 0.035 0.04 0.045 0.05 0.055 0.06 Epoch
Mean Square Error
Power series Trigonometric Chebyshev Legendre
Fig. 6: Mean Square Error vs. Epoch curve
5.4. Comparative analysis
From the above analysis, it can be noticed that there is variation in classification rate. The interpretation drawn from the above results are as follows:
• In case of leukemia data set FLNN classifier using Power series Polynomial and Legendre Polynomial function shows better accuracy value over the remaining two.
• In case of ovarian and breast cancer data set, FLNN classifier using Legendre Polynomial function shows better accuracy over the remaining three.
Table 9: Classification matrix for FLNN models using Breast dataset.
(a) Power series Polynomial FLNN
0 1 0 31 15 1 5 46 (b) Trignometric FLNN 0 1 0 37 9 1 8 43 (c) Chebyshev Polynomial FLNN 0 1 0 34 12 1 6 45 (d) Legendre Polynomial FLNN 0 1 0 38 8 1 6 45 0 0.1 0.2 0.3 0.4 0.5 0.6 0.7 0.8 0.9 1 0 0.1 0.2 0.3 0.4 0.5 0.6 0.7 0.8 0.9 1
False Positive Rate
True Positive Rate
ROC
(a) Power series Polynomial FLNN
0 0.1 0.2 0.3 0.4 0.5 0.6 0.7 0.8 0.9 1 0 0.1 0.2 0.3 0.4 0.5 0.6 0.7 0.8 0.9 1
False Positive Rate
True Positive Rate
ROC (b) Trigonometric FLNN 0 0.1 0.2 0.3 0.4 0.5 0.6 0.7 0.8 0.9 1 0 0.1 0.2 0.3 0.4 0.5 0.6 0.7 0.8 0.9 1
False Positive Rate
True Positive Rate
ROC (c) Chebyshev Polynomial FLNN 0 0.1 0.2 0.3 0.4 0.5 0.6 0.7 0.8 0.9 1 0 0.1 0.2 0.3 0.4 0.5 0.6 0.7 0.8 0.9 1
False Positive Rate
True Positive Rate
ROC
(d) Legendre Polynomial FLNN
Fig. 7: ROC curve for different classifier using Breast dataset.
Table 10: Performance analysis of FLNN classifiers using Breast dataset.
Classifier Accuracy Precision Recall Specificity F-measure Power series Polynomial FLNN 0.7938 0.7541 0.9020 0.6739 0.8214
Trigonometric FLNN 0.8247 0.8269 0.8431 0.8043 0.8350
Chebyshev Polynomial FLNN 0.8144 0.7895 0.8824 0.7391 0.8333 Legendre Polynomial FLNN 0.8557 0.8491 0.8824 0.8261 0.8654
• From Table 4, Table 7, and Table 10 respectively, it can be inferred that FLNN using Legendre Polynomial function is a more intelligent learning algorithm in comparison to other FLNN classifiers.
Hence, from the obtained results, it can be concluded that feature selection plays a significant role in the classifi-cation of microarray data, into cancerous and non-cancerous ones.
6. Conclusion
In this paper, an attempt has been made to design classification models for classifying the samples of microarray data into their respective classes. Hence, a classification framework was designed using FLNN classifiers. Feature selection was carried out usingt-test. 10-fold CV technique was applied to enhance the performance of the classifiers. The performance of the classifiers for all three data sets were evaluated using performance parameters. From the computed result, it is observed that Legendre Polynomial FLNN classifier yields better results when compared with FLNN using remaining functions and the existing classifiers available in literature.
Further, the applicability of machine learning techniques such as Genetic Algorithm in combination with FLNN can be studied to obtain better classification of microarray data set. This hybridization may help in reducing the complexity of the classification model.
References
1. T. R. Golub, D. K. Slonim, P. Tamayo, C. Huard, M. Gaasenbeek, J. P. Mesirov, H. Coller, M. L. Loh, J. R. Downing, M. A. Caligiuriet al., “Molecular classification of cancer: class discovery and class prediction by gene expression monitoring,”science, vol. 286, no. 5439, pp. 531–537, October 1999.
2. Y. F. Leung and D. Cavalieri, “Fundamentals of cdna microarray data analysis,”TRENDS in Genetics, vol. 19, no. 11, pp. 649–659, November 2003.
3. M. Flores, T. Hsiao, Y. Chiu, E. Chuang, Y. Huang, and Y. Chen, “Gene regulation, modulation, and their applications in gene expression data analysis.”Advances in Bioinformatics, vol. 2013, no. Article ID 360678, p. 11 pages, January 2013.
4. G. Lee, C. Rodriguez, and A. Madabhushi, “Investigating the efficacy of nonlinear dimensionality reduction schemes in classifying gene and protein expression studies,”Computational Biology and Bioinformatics, IEEE/ACM Transactions on, vol. 5, no. 3, pp. 368–384, July– September 2008.
5. C.-P. Lee and Y. Leu, “A novel hybrid feature selection method for microarray data analysis,”Applied Soft Computing, vol. 11, no. 1, pp. 208–213, January 2011.
6. Y. Peng, W. Li, and Y. Liu, “A hybrid approach for biomarker discovery from microarray gene expression data for cancer classification,” Cancer informatics, vol. 2, p. 301, February 2006.
7. J. Ye, T. Li, T. Xiong, and R. Janardan, “Using uncorrelated discriminant analysis for tissue classification with gene expression data,” IEEE/ACM Transactions on Computational Biology and Bioinformatics (TCBB), vol. 1, no. 4, pp. 181–190, October 2004.
8. L. Wang, F. Chu, and W. Xie, “Accurate cancer classification using expressions of very few genes,”IEEE/ACM Transactions on Computa-tional Biology and Bioinformatics (TCBB), vol. 4, no. 1, pp. 40–53, Jan–Mar 2007.
9. P. A. Mundra and J. C. Rajapakse, “Gene and sample selection for cancer classification with support vectors basedt-statistic,” Neurocomput-ing, vol. 73, no. 13, pp. 2353–2362, May 2010.
10. S. Dehuri and S.-B. Cho, “A comprehensive survey on functional link neural networks and an adaptive pso–bp learning for cflnn,”Neural Computing and Applications, vol. 19, no. 2, pp. 187–205, 2010.
11. X. Hang, “Cancer classification by sparse representation using microarray gene expression data,” inBioinformatics and Biomeidcine Work-shops, 2008. BIBMW 2008. IEEE International Conference on. IEEE, November 2008, pp. 174–177.
12. K. E. Lee, N. Sha, E. R. Dougherty, M. Vannucci, and B. K. Mallick, “Gene selection: a bayesian variable selection approach,”Bioinformatics, vol. 19, no. 1, pp. 90–97, June 2003.
13. A. Bharathi and A. Natarajan, “Cancer classification of bioinformatics data using anova,”International Journal of Computer Theory and Engineering, vol. 2, no. 3, pp. 369–373, June 2010.
14. D. A. Salem, A. Seoud, R. Ahmed, and H. A. Ali, “Mgs-cm: A multiple scoring gene selection technique for cancer classification using microarrays,”International Journal of Computer Applications, vol. 36, no. 6, December 2011.
15. X. Sun, Y. Liu, M. Xu, H. Chen, J. Han, and K. Wang, “Feature selection using dynamic weights for classification,”Knowledge-Based Systems, January 2012.
16. W.-C. Yeh, Y.-M. Yeh, C.-W. Chiu, and Y. Y. Chung, “A wrapper-based combined recursive orthogonal array and support vector machine for classification and feature selection,”Modern Applied Science, vol. 8, no. 1, p. p11, December 2013.
17. R. D´ıaz-Uriarte and S. A. De Andres, “Gene selection and classification of microarray data using random forest,”BMC bioinformatics, vol. 7, no. 1, p. 3, June 2006.
18. Y. K. Jain and S. K. Bhandare, “Min max normalization based data perturbation method for privacy protection,”International Journal of Computer&Communication Technology (IJCCT), vol. 2, no. 8, pp. 45–50, October 2011.
19. M. Kumar and S. Kumar Rath, “Classification of microarray data using kernel fuzzy inference system,”International Scholarly Research Notices, vol. 2014, no. Article ID 769159, p. 18 pages, August 2014.
20. S. K. Nanda and D. P. Tripathy, “Application of functional link artificial neural network for prediction of machinery noise in opencast mines,” Advances in Fuzzy Systems, vol. 2011, p. 4, 2011.
21. E. F. Petricoin III, A. M. Ardekani, B. A. Hitt, P. J. Levine, V. A. Fusaro, S. M. Steinberg, G. B. Mills, C. Simone, D. A. Fishman, E. C. Kohn et al., “Use of proteomic patterns in serum to identify ovarian cancer,”The lancet, vol. 359, no. 9306, pp. 572–577, February 2002. 22. L. J. van’t Veer, H. Dai, M. J. Van De Vijver, Y. D. He, A. A. Hart, M. Mao, H. L. Peterse, K. van der Kooy, M. J. Marton, A. T. Witteveen