Multiple Reflection Ultrasonic Sensor System for
Morpholog-ical Plant Parameters
Multireflex Ultraschall Sensorsystem zur Messung
morpho-logischer Pflanzencharakteristiken
Khalid Makeen1, Simon Kerssen2, Daniel Mentrup2, Bengt Oelmann1, Arno Ruckelshausen3
1 The Department of Information Technology and Media (ITM), Mid Sweden University,
Holmgatan 10, 85170 Sundsvall, Sweden
2 iotec GmbH, Sedanstraße 26, 49076 Osnabrück, Germany
3 University of Applied Sciences Osnabrück / Competence Center of Applied Agricultural
Engi-neering – COALA, Albrechtstr.30, 49076 Osnabrück, Germany Email: [email protected]
Zusammenfassung: Ein Standard-Industrie-Ultraschallsensor wird verwendet, um die Möglichkeit der Erfassung von Pflanzenabständen und Blattetagen zu messen. Für ers-te Messungen im Labor wurde der Sensor über einem Förderband befestigt. Während der Messung passierten künstliche Pflanzen das Sichtfeld des Sensors, dieser emp-fängt Mehrfachreflexionen von den verschiedenen Pflanzenebenen. Diese aufgenom-menen Echos werden in Distanzinformationen umgerechnet. In Kombination mit der Positionsinformation des Drehgebers, welcher am Förderband befestigt ist, wird ein Echogramm der Pflanze erstellt. Aus dem Echogramm lassen sich Parameter, wie die Abmessungen, Höhe und Blattverteilung der Pflanze bestimmen.
Deskriptoren: Ultraschallsensor, morphologische Pflanzenparameter, künstliche Pflan-zen
Abstract: A standard industrial ultrasonic sensor is used to give advantage of multiple reflection echoes to test plant dimensions and leaf levels. First measurements in labora-tory were done by mounting the sensor above a conveyor belt. During the measure-ment, artificial plants pass though the sensors field of view and multiple echoes from different levels of the artificial plant leafs are measured. These echoes are translated into distance information. In combination with the position information provided by the conveyor belt, it is possible to generate an echogram for each plant that can be used to determine the plant dimensions, height and leaf distribution.
17. und 18. Workshop Computer-Bildanalyse in der Landwirtschaft 111
1 Introduction
Measurement of plants is considered as one of the major keys to increase the crop pro-duction to compensate possible shortage in crop supply in the future (BUSEMEYERet al. 2010). Recently, auto-machinery based on smart sensors (WEISS & BIBER 2009) was
implemented and describe the crop status (RUCKELSHAUSEN et al. 2009, EDAN et al.
2009). So far ultrasonic sensors have not yet been used for plant phenotyping, howev-er, they are of interest in agricultural applications with respect to low costs and high ro-bustness due to natural environments factors in the field such as illuminations, water, snow and dust. However, recently a feasibility study of an ultrasonic measurement sys-tem based on multiple reflections show good and largely linear relationships between ultrasonic reading and above ground matter sampled (REUSCH 2009). As a conse-quence multiple reflection ultrasonic sensors have the potential for biomass detection as well as for plant phenotyping applications, which is the focus of this paper.
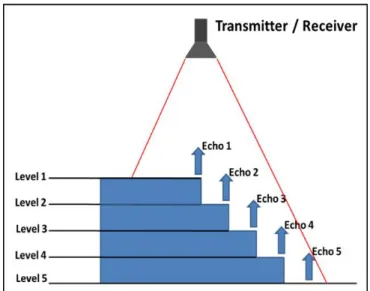
Ultrasonic wave frequencies start above the human hearing at greater than 20 kHz. When an ultrasonic wave collides with object, it is (partially) reflected back. Using the time of flight of the echo it is possible to calculate the distance to the reflection object. The theory of multi reflection ultrasonic echoes describes the possibility to multiple ech-oes from different levels of an object depend on object shape. For example, if we posi-tion the sensor above the object shown in (figure 1), an object that is divided into five vertical levels, then by sending one pulse we expect to receive five echoes. These ech-oes are stored in one echo-slot (timeslot). Therefor the echo slot (ES) contains the echo values that were measured from one pulse.
2 Material and Methods
Ultrasonic Sensors:
The ultrasonic sensor (wms-340/RT) from Microsonic is used. This sensor operates with a frequency of 120 kHz and can be used to measure distances ranging from 350 mm to 3400 mm. This sensor is connected to a microcontroller system that triggers short ultra-sonic pulse in the sensor and subsequently receives all reflected echo signals that are converted to a digital signal in the sensor. The controller measures the time of-flight of the individual echoes and transmits them by a serial port connection to a computer. That connection also allows the user to change measurement parameters such as pulse duration and maximum measurement time.
Additionally the system has the possibility to measure the air temperature that is needed for the calculation of the sonic speed which is used for the distance calculation.
Figure 1: Multi reflection method
Experimental Procedure:
The artificial plant is passed through the ultrasonic sensor field when the conveying belt is moving (figure 2). The received echoes from the plant are recorded as distance val-ues between sensor and plant leaf. The threshold applying to determine the ground lev-el in this experiment is the distance between sensor and conveying blev-elt (1272mm).
Figure 2: Schematic experimental setup
Echoes Analysis:
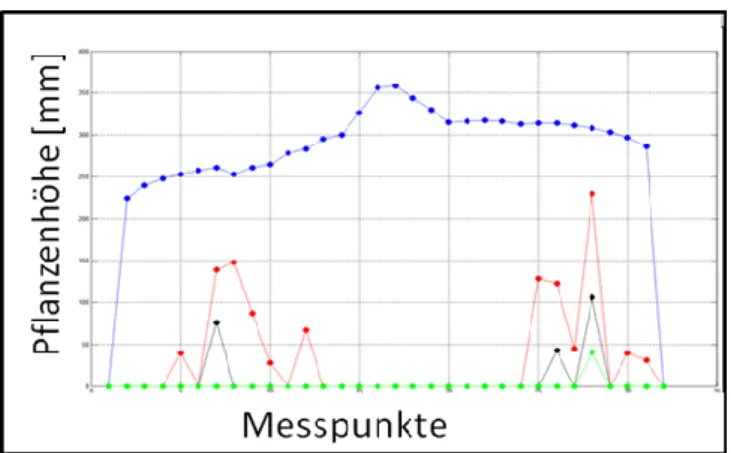
The combination of echo slot (ES) number and echo distance information is used to draw an echogram. The X-axis represents the echo slot number and the Y-axis repre-sents the single echo values that were measured in one measurement.
17. und 18. Workshop Computer-Bildanalyse in der Landwirtschaft 113
Figure 3: Histogram explaining echoes points
With the given sensor setting it is possible to calculate the time need to record one echo slot (EST) = 0.070196 sec by using equation (1)
( ) ( ) ( ) (1)
Where MT is the measurement time, MI is the measurement interval and PD is the pulse duration. Using the First and Last Echo Slot (ES) to calculate the Echoes Slots Numbers (ESN) = 26 ES achieved by artificial plant by using equation (2)
∑ ( ) (2)
(3)
Where ESN is Echo slots Number and ES is the Echo slot. The total time need to measure this artificial plant was 1.8250 sec. The echoes achieved during the total time (figure 3) are transferred in a matrix. The dimension of this matrix depends on number of reflected echoes. Each row in this matrix contains one echo slot; columns contain echo information in terms of distance.
Plant dimensions:
The height of a plant is measured by finding the maximum value in the before created echo matrix. The speed during measurement (24.6 cm/sec) is calculated by using the
through the field of view of the sensor cause an error in width detection by the size of the field of view. This is because the field of view can be seen as a coil and not as a size les beam. Any object entering the field of view will start to cause an echo as it en-ters the field of view. Until the object has completely passed the field of view it will con-tinue to cause an echo leading to the error in width calculation.
3 Results and Discussion
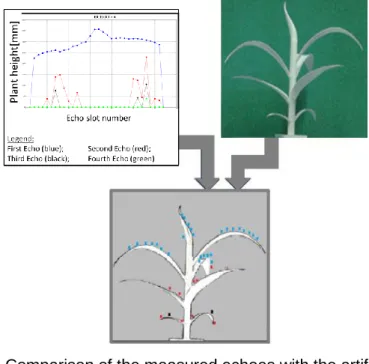
When comparing the previous echogram with the artificial plant, morphologic characters from the plant could calculate.
Figure 4: Comparison of the measured echoes with the artificial plant
By analyzing the rate of distribution of echoes on the vertical levels of the plant it is ob-vious that the maximum rate of distribution for echoes belongs to the first echo (blue color) that represents the top level of the plant at between 360 mm – 250 mm. Followed by the second echo (red color) in some of echo slots and represents the mid-level of the plant at between 250 mm – 150 mm. The third echo (black color) is only present in a few numbers of echo slots and represents the bottom level of the plant at between 150 mm – 0 mm.
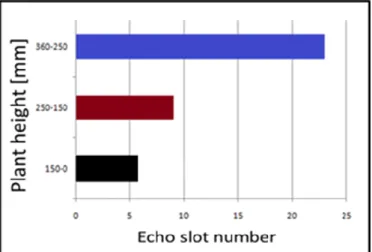
The histogram (figure 5) is showing the distribution of echoes with respect to plant height. The distribution is divided into three height levels.
17. und 18. Workshop Computer-Bildanalyse in der Landwirtschaft 115
Figure 5: Ultrasonic echo distribution for plant heights
There are two causes to miss echoes during measurement:
- It is not possible to detect two echoes caused by two separate objects in the field of view at the same distance.
- It is not possible to detect two separate echoes at nearly the same distance. There has to be a minimum difference in distance of about 83 mm to be able to detect two separate echoes. Otherwise the two echoes will overlap into one long echo.
4 Conclusions
A standard industrial sensor like the wms-340/RT from Microsonic was used to study the morphology and plant characteristics based on multiple reflection.
Ultrasonic echo occurred from vertical levels of the plant during dynamic measurement. Laboratory experiments and implemented algorithms show the possibility to transform single echo information from one dimension, which was containing only the distance information between the sensor and plant leaf, to be represent as two dimensions by using the echo slot number.
The developed algorithms are able to calculate the height of the plant and determine the distance between plants leafs. They also give the possibility to estimate a value for the plant diameter. In addition the main gain from this experiment is to show the possibility visualizing the plant.
References
BUSEMEYER L., KLOSE R., LINZ A., THIEL M., WUNDER E., TILENAC M., RUCKELSHAUSEN A. (2010): Agro-sensor systems for outdoor plant phenotyping platforms in low and high densi-tiy crop field plots; Proceedings 68th International Conference Agricultural Engineering 2010, pp.213 - 218
EDAN Y., HAN S., KONDO N. (2009): “Automation in agriculture,” in Handbook of Automation
Springer, 2009, pp. 1095–1128
REUSCH S. (2009): “Use of ultrasonic transducers for online biomass estimation in winter
wheat”, Yara International, Research Centre Hanninghof, 48249 Dülmen, Germany pro-ceedings of the 7th European conference on Precision agriculture 2009
RUCKELSHAUSEN A.,BIBER P.,DORNA M.,GREMMES H.,KLOSE R.,LINZ A.,RAHE F., RESCH R., THIEL M.,TRAUTZ D.,WEISS U. (2009): “Bonirob - an autonomous field robot platform for
in-dividual plant phenotyping,” in Proceedings of Joint International Agricultural Conference, 2009, p. 464pp
WEISS U.,BIBER P. (2009): “Plant detection and mapping for agricultural robots using a 3d-lidar
sensor,” in Proceedings of the 4th European Conference on Mobile Robots, 2009, pp. 205– 210