Intelligent Paid Subscription Renewal Prediction
System Using Data Mining Techniques
Mohamed Al Ashraf ALI*, Harun Uğuz
Computer Engineering, Konya Technical University
DOI: 10.29322/IJSRP.9.11.2019.p9569
http://dx.doi.org/10.29322/IJSRP.9.11.2019.p9569
Abstract- According to Virgo Capital, Typically, good services businesses have renewal rates of more than 80%, while more sticky software renewal rates hit 90% or more. Paid subscription trading websites collect huge amounts of customer’s data which, unfortunately, are not “mined” to discover hidden information for effective decision making. Hidden patterns discovery and relationships often go unexploited. This situation can be solved by using advanced data mining techniques. This research has developed a prototype Intelligent Paid Subscription Renewal Prediction System (IPSRPS) using data mining techniques, namely, Decision Trees, Naïve Bayes, and Neural Network. Each technique has its unique strength in realizing the objectives of the defined mining goals, which is shown in results. IPSRPS can answer complex “what if” queries which traditional decision support systems cannot. Using customer profiles such as the number of deals, sealed and un-sealed deals, profile interactions and the total sold amount it can predict the likelihood of customers renewing their subscription or not. It enables significant knowledge, e.g. patterns, relationships between service factors related to customer satisfaction, to be established. IPSRPS is Web-based, user-friendly, scalable, reliable and expandable. It is implemented on the .NET platform.
I. MOTIVATION
ate of customer renewal is one of the key value questions for any software or services business. Higher renewal rates usually indicate better products and stickier customers, and they directly translate to more predictable revenue and lower selling costs, whether it is measured in dollars, customers, subscriptions, maintenance agreements, or some other metric. Quality service implies getting big deals and administering customer satisfaction effectively. Poor marketing decisions can lead to financial disastrous consequences which are therefore unacceptable. E-marketers must also minimize the average customer’s loss rate. These results can be achieved by employing appropriate computer-based information and/or decision support systems. Most e-marketing companies today employ some sort of customer information systems salesmen to manage their business and customer’s data [10]. Huge amounts of data are generated by these systems which take the form of numbers, text, charts and images. Unfortunately, these data are rarely used to support sales decision making.
There is a hidden treasure of information in these data that is largely untapped. So, the important question that raises is: “How can we turn data into useful information that can enable trading
experts to make intelligent marketing decisions?” This is the main motivation for this research.
I. Problem statement
“It takes months to find customers, and seconds to lose one”. Many online marketing systems are designed to measure customer satisfaction level, customer’s revenue/loss management and generation of simple statistics. Some E-marketing websites use decision support systems, but they are largely limited. They can answer simple queries like “What is the average revenue/loss that the customer is achieving comparing to last year?”, “How many renewals had done in the last 30 days?”, “Identify the count of customers who did not renew their subscriptions, and what is the average retention rate.” However, they cannot answer complex queries like “Identify the important preoperative predictors that decrease/increase customers selling”, “Given customer trading records, should we offer the renewal with original price, or with a discount?”, and “Given customer records, predict the probability of customers renewing their subscriptions.”
Customer’s loyalty measurements are often made based on salesmen’s experience with the customer behaviors rather than on the knowledge-rich data hidden in the database. This practice leads to unwanted biases, errors and excessive financial costs which affects the quality of service provided to customers. Integration of e-marketing decision support with computer-based customer records could reduce customer’s loss ratio, enhance customer satisfaction and improve customer’s outcome. Data mining, have the potential to generate a knowledge-rich environment which can help to significantly improve the quality of marketing decisions.
II. RESEARCH OBJECTS
The core objective of this research is to develop a prototype Intelligent Paid Subscription Renewal Prediction System (IPSRPS) using three data mining modeling techniques, namely, Decision Trees, Naïve Bayes and Neural Network. IPSRPS can discover and extract hidden knowledge (patterns and relationships) associated with customer subscriptions from a historical customer’s database. It can answer complex queries for finding customers with no intention to renew and thus assist the company salesmen to make intelligent marketing decisions which traditional decision support systems cannot. By providing better offers, it also helps to reduce customer’s loss ratio. It displays the results both in tabular and graphical forms to enhance visualization and ease of interpretation.
III. DATA MINING REVIEW
Although the term “data mining” saw the light for more than two decades now, but the potential of it is only being realized now. Statistical analysis, machine learning and database technology are combined by data mining to extract hidden patterns and relationships from large databases [12]. Fayyad defines data mining as “a process of nontrivial extraction of implicit, previously unknown and potentially useful information from the data stored in a database” [3]. Giudici defines it as “a process of selection, exploration and modelling of large quantities of data to discover regularities or relations that are at first unknown with the aim of obtaining clear and useful results for the owner of database” [4].
There are two data mining strategies: supervised and unsupervised learning. In supervised learning, a training set is used to learn model parameters whereas in unsupervised learning no training set is used (k-means clustering is unsupervised) [10]. Depending on the modelling objective, each data mining technique serves a different purpose. Classification and prediction are the two most common modelling objectives. Categorical labels (discrete, unordered) predicted by classification models while continuous-valued functions predicted by prediction models predict [5]. Decision Trees and Neural Networks use classification algorithms while Regression, Association Rules and Clustering use prediction algorithms [3].
Decision Tree algorithms include CART (Classification and Regression Tree), ID3 (Iterative Dichotomized 3) and C4.5. These algorithms differ in selection of splits, when to stop a node from splitting, and assignment of class to a non-split node [6]. CART uses Gini index to measure the impurity of a partition or set of training tuples [5]. It can handle high dimensional categorical data. Decision Trees can also handle continuous data (as in regression) but they must be converted to categorical data.
Naive Bayes or Bayes’ Rule is the basis for many machine-learning and data mining methods [11]. The rule (algorithm) is used to create models with predictive capabilities. It provides new ways of exploring and understanding data. It learns from the “evidence” by calculating the correlation between the target (i.e., dependent) and other (i.e., independent) variables.
Neural Networks consists of three layers: input, hidden and output units (variables). Connection between input units and hidden and output units are based on relevance of the assigned value (weight) of that particular input unit. The higher the weight the more important it is. Neural Network algorithms use Linear and Sigmoid transfer functions. Neural Networks are suitable for training large amounts of data with few inputs. It is used when
other techniques are unsatisfactory.
IV. METHODOLOGY
CRISP-DM methodology is the methodology we used to build IPSRPS mining models. It has six major phases: business understanding, data understanding, data preparation, modeling, evaluation, and deployment. Business understanding phase focuses on understanding the objectives and requirements from a business perspective, converting this knowledge into a data mining problem definition, and designing a preliminary plan to achieve the objectives. Data understanding phase uses the raw the
data and proceeds to understand the data, identify its quality, gain preliminary insights, and detect interesting subsets to form hypotheses for hidden information. Data preparation phase constructs the final dataset that will be fed into the modeling tools. This includes table, record, and attribute selection as well as data cleaning and transformation. The modeling phase selects and applies various techniques, and calibrates their parameters to optimal values. The evaluation phase evaluates the model to ensure that it achieves the business objectives. The deployment phase specifies the tasks that are needed to use the models [2]. Data Mining Extension (DMX), a SQL-style query language for data mining, is used for building and accessing the models’ contents. Tabular and graphical visualizations are incorporated to enhance analysis and interpretation of results.
V. DATA SOURCE
A total of 910 records with 13 trading attributes (factors) were obtained from the Turkish Exporter dataset [1]. Figure 1 lists the attributes. The records were split equally into two datasets: training dataset (455 records) and testing dataset (455 records). The records for each set were selected randomly to avoid bias. For the sake of consistency, only categorical attributes were used for all the three models. All the non-categorical trading attributes were transformed to categorical data. The attribute “Renewal Result” was identified as the predictable attribute with value “1” for customers with previous renew records and value “0” for customers with no renew records (New Customers). The attribute “Customer Id” was used as the key; the rest are input attributes. It is assumed that problems such as missing data, inconsistent data, and duplicate data have all been resolved.
Predictable Attribute:
Renewal Result (Value 0: - no intention to renew subscription; Value 1: willing to renew subscription).
Key Attribute:
Customer Id – Customer’s identification number.
Input Attributes:
1. Previous Renewals Count (PRC) (Value = 0: New Subscriber; Value >0: Has Subscription history).
2. Contact Messages Last Year (CMLY) (Value > 50: Good Interaction; Value < 50: Bad Interaction).
3. Contact Messages This Year (CMTY) (Value > 50: Good Interaction; Value < 50: Bad Interaction).
4. Trade Value Last Year (Value, If PRC > 0: This Year Trade Value - Trade Value Average; If PRC = 0: Trade Value – Subscription fees).
5. Trade Value This Year.
6. Retention Rate: (Activity (System Login) in the last period - in the prior period).
7. Total Deals: (Value, If PRC > 0: This Year Deals - Deals Average; If PRC = 0: Deals Count).
8. Closed Leads: (Value, If PRC > 0: Closed Deals Average LY – This Year; If PRC = 0: Closed Deals Count). 9. Sales Per Customer: (Revenue / Number of deals). 10. Satisfied: (Value 0: Not Recommended; Value 1: Not
11. Profile Rating: (Value 1-5 stars).
Figure 1. Description of attributes
VI. MINING MODELS
For model creation, Data Mining Extension (DMX) query language was used, model training, model prediction and model content access. Default setting were set to all parameters except for parameters “Minimum Support = 1” for Decision Tree and “Minimum Dependency Probability = 0.005” for Naïve Bayes [8]. The trained models were evaluated against the test datasets for accuracy and effectiveness before they were deployed in FBMPS. Lift Chart and Classification Matrix were used to validate the models.
VII. VALIDATING MODEL EFFECTIVENESS
Two models were used for testing and validation the effectiveness of models: Lift Chart and Classification Matrix. The purpose was to determine which model gave the highest percentage of correct predictions for customer’s subscriptions renewal.
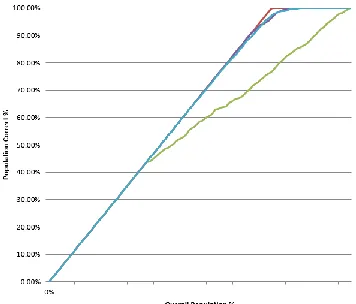
Lift Chart with predictable value. Columns in the trained model were mapped to columns in the test dataset, to determine if there was sufficient information to learn patterns in response to the predictable attribute. The model, predictable column to chart against, and the state of the column to predict renewal possibilities (predict value = 0) were also selected. Figure 2 shows the Lift Chart output. The percentage of the test dataset used to compare predictions showed on the X-axis, while the percentage of values predicted to the specified state showed on Y-axis. The results for random-guess and ideal model showed on the blue and red lines respectively. Results of Neural Network, Naïve Bayes and Decision Tree models showed on the purple, light-blue and green lines respectively. The top red line shows the ideal model; it captured 100% of the target population for trading values using 22% of the test dataset. The bottom blue line shows the random line which is always a 45-degree line across the chart. 50% of the target population would be captured using 50% of the test dataset if we randomly guess the result for each case. Our three model lines (purple, light-blue and green) fall between the random guess and ideal model lines, which tells us that that all three have sufficient information to learn patterns in response to the predictable state.
Figure 2. Result of Lift Chart with predictable value
Lift Chart with no predictable value. To produce Lift Chart with no predictable value we use similar steps to the above, except that the state of the predictable column is left blank. No line for the random-guess model included. Figure 3 shows the Lift Chart output. The percentage of test dataset used to compare predictions showed on X-axis, while the percentage of predictions that are correct showed on Y-axis. The ideal, Neural Network, Naïve Bayes and Decision Trees models showed on the red, purple, blue and green lines respectively. The performance of the models across all possible states showed in this chart. The red line which represents the model ideal line, is at 45-degree angle, showing that if 30% of the test dataset is processed, 45% of test dataset is predicted correctly.
Figure 3. Result of Lift Chart with no predictable value
Neural Network gives the highest percentage of correct predictions (79.23%) followed by Naïve Bayes (70.33%) and Decision Trees (69.85%), if 50% of the population is processed. Naïve Bayes model gives the highest number of correct predictions (86.12%) and appears to perform better than the other two as it followed by Neural Network (85.68%) and Decision Trees (80.4%), If the entire population is processed.
[image:3.612.356.534.400.552.2]and Naïve Bayes appear to perform better than Decision Trees as they give high percentage of correct predictions when more than 50% of population is processed. The reason is that Lift line for Decision Trees is always below that of Neural Network and Naïve Bayes. Neural Network appears to fare better than Naïve Bayes and vice-versa for some population range.
[image:4.612.94.242.276.395.2]Classification Matrix. Used to display the frequency of correct and incorrect predictions. Classification Matrix compares the actual values in the test dataset with the predicted values in the trained model. In this example, the test dataset contained 108 customers who have renewed before and 124 customers who have no renewal records. The results of the Classification Matrix for all the three models showed in Figure 4. The rows represent predicted values while the columns represent actual values (1 for customers who will renew, ‘0’ for customers who will not renew). Values predicted by the models showed on the left-most columns. Correct predictions showed on the diagonal values.
Figure 4. Results of Classification Matrix for all the three models
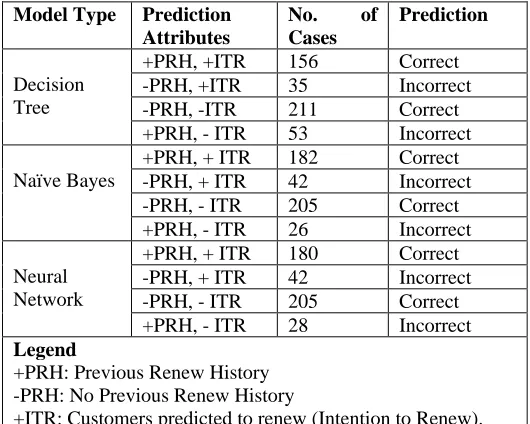
Figure 5 summarizes the results of all three models. The most effective model appears to be Naïve Bayes as it has the highest percentage of correct predictions (85.05%) for renewal counts, followed by Neural Network (with a difference of less than 1%) and Decision Trees. Decision Trees, however, appears to be most effective for predicting customers who have no intention to renew their subscription (89%) compared to the other two models.
Model Type Prediction Attributes
No. of Cases
Prediction
Decision Tree
+PRH, +ITR 156 Correct -PRH, +ITR 35 Incorrect -PRH, -ITR 211 Correct +PRH, - ITR 53 Incorrect
Naïve Bayes
+PRH, + ITR 182 Correct -PRH, + ITR 42 Incorrect -PRH, - ITR 205 Correct +PRH, - ITR 26 Incorrect
Neural Network
+PRH, + ITR 180 Correct -PRH, + ITR 42 Incorrect -PRH, - ITR 205 Correct +PRH, - ITR 28 Incorrect Legend
+PRH: Previous Renew History -PRH: No Previous Renew History
+ITR: Customers predicted to renew (Intention to Renew).
[image:4.612.35.300.519.731.2]-ITR: Customers predicted not to renew.
Figure 5. Model results
VIII. EVALUATION OF MINING GOALS
Based on exploration of customers profile dataset and objectives of this research, five mining goals were defined. They were evaluated against the trained models. According to results, all three models had achieved the stated goals, suggesting that they could be used to provide decision support to e-marketers for better customer gain and keep, which will definitely increase the company’s profits. The goals are as follows:
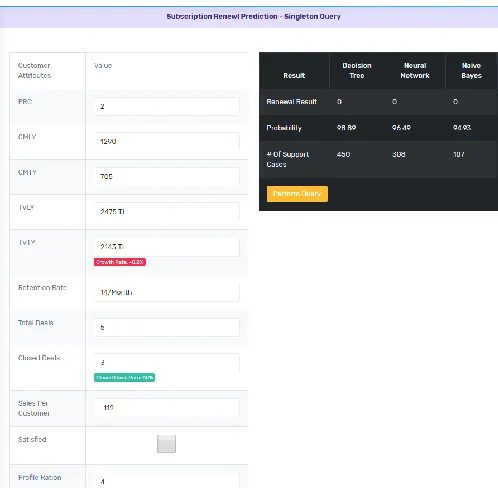
Goal 1: Given customers profiles, predict those who are willing to renew their subscription or not. Using singleton query and batch or prediction join query all three models were able to answer this question. The two queries could predict on single and multiple input cases respectively. IPSRPS supports prediction using “what if” scenarios. Users enter values of customer and trading attributes to figure whether the customer will renew his subscription or not. For example, entering values PRC = 2, Retention = 14, Total Deals = 5, Total Closed Deals = 3, Satisfied = 0, Total Trading Value Last Year = 2475 and Total Trading Values This year = 2143 into the models, would produce the output in Figure 6. All three models showed that this customer will likely not to renew his subscription. Decision Trees gives the highest probability (99%) with 450 supporting cases, followed closely by Neural Network (96.49%) with 308 supporting cases and Naïve Bayes (94.93%) with 107 supporting cases. As these values are high, customer-relationship employees could recommend that the customer should be contacted and offered a discount for next subscription for example. Thus performing “what if” scenarios can help prevent a potential customers loss.
Goal 2: Identify the significant influences and relationships in the e-marketing inputs associated with the predictable state – subscription renewal. The Dependency viewer in Decision Trees and Naïve Bayes models shows the results from the most significant to the least significant (weakest) marketing predictors. When there are many predictable attributes, the viewer is especially useful. Figure 7 show that in decision trees model, the most significant factor influencing subscription renewal is “Total Trading Value Past Year vs Paid Subscription Fees (2500)”. Other significant factors include Number of Contact Messages, Sealed Deals Count and Previous Renewals Count. Decision Trees model shows ‘Retention Rate” as the weakest factor while Naïve Bayes model shows ‘Trade Value Growth Rate’ as the weakest factor. Naïve Bayes shows the significance of all categorical input attributes so it appears to fare better than Decision Trees. Customer-relationship employees can use this information to further analyze the strengths and weaknesses of the provided customer trading attributes associated with subscription renewal.
(99.61%) that customers who will renew the subscription are found in the relationship between the attributes (nodes): “Total Closed Deals > 2 and PRC > 0 and Trading Value Growth Rate >= 0% and Satisfied = 1” Customer-relationship employee can use this information to perform customer profile screening on these four attributes instead of on all attributes on customers who are likely to renew their subscription or not. This will reduce customers loss ratio, enhance customer satisfaction and improve customers outcome. Information on least impact (5.88%) is found in the relationship between the attributes: “Total Closed Deals < 2 and PRC = 0”. Also given is the relationship between attributes for customers who will not renew the subscription. Results show that the relationship between the attributes: “Closed Deals Perc < 40%, Satisfied = 0 and PRC= 0” has the highest impact (92.58%). The least impact (0.2%) is found in the attributes: “Closed Deals Perc > 40% and PRC > 0 and Trading Value Growth Rate >= 0% and Satisfied = 1”. Additional information such as identifying customers’ trading profiles based selected nodes can also be obtained by using the drill through function. CRM can use the Decision Tree viewer to perform further analysis.
[image:5.612.40.289.296.540.2]Figure 6. Output for singleton query module
Figure 7. Decision Trees dependency network
Goal 4: Identify characteristics of customers who intend to renew their subscription. Only Naïve Bayes model identifies the characteristics of customers willingness to renew subscription. Naïve Bayes shows the probability of each input attribute for the predictable state. Figure 8 shows that 89.46% of the customers who will renew subscription have renewed two times before (PRC > 0) of which 43% are achieving sales equally or more than last year. Other significant characteristics are: high profile interactive represented by contact messages count, total deals, closed deals, etc. These results can be further analyzed.
Figure 8. Naïve Bayes Attribute Characteristics Viewer in descending order for Customers to Renew Subscription
[image:5.612.311.575.412.547.2]the attributes “Satisfied = 0” with 195 (73.86%) customers, “PRC = 0” with 198 (73.06%) customers, “Total Closed Deals < 40% total deals” with 206 (67.98%), etc. favor predictable state for customers with no intention to renew subscription.
Figure 9. A Tornado Chart for Attribute Discrimination Viewer in descending order for Naïve Bayes
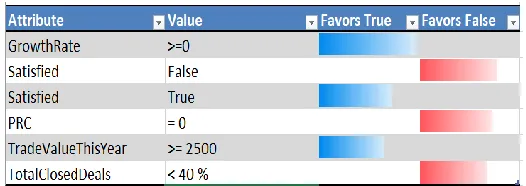
[image:6.612.35.298.367.460.2]Neural Network model (Figure 10) shows that the most important attribute value that favors customer who intend to renew their subscription is “Growth Rate >= 0” (98%). Other attributes that favor renew subscription include “Deals >= 12”, “PRC = 0”, “PRC >= 1”, etc. Attributes like “Trade Vale This Year <= Trade Value Last Year or < Paid Subscription Fees”, “Satisfied = 0” etc. also favor the predictable state for customers with no intention to renew their subscription.
Figure 10. Attribute Discrimination Viewer in descending order for Neural Network
IX. BENEFITS AND LIMITATIONS
IPSRPS can provide decision support to assist CRM to make better marketing decisions or at least provide a “second opinion.”
The current version of IPSRPS is based on the 15 attributes listed in Figure 1. This list may need to be expanded to provide a more comprehensive predicting system. Another limitation is that it only uses categorical data. For some cases, the use of continuous data may be necessary. Another limitation is that it only uses three data mining techniques. Additional data mining techniques can be incorporated to provide better results. The size of the dataset used in this research is still quite small. A large dataset would definitely give better results. It is also necessary to test the system extensively with input from users, especially customer relationship employees, before it can be deployed in companies.
X. CONCLUSION
A prototype customer subscription renewal prediction system is developed using three data mining classification modeling techniques. The system extracts hidden knowledge from a historical customer database. To build and access the models DMX query language and functions are used. A test dataset was used to train and validate the models. Model evaluation and effectiveness measuring done by Lift Chart and Classification Matrix methods. In response to the predictable state, all three models are able to extract patterns. The most effective model to predict customers willingness to renew subscription appears to be Naïve Bayes followed by Neural Network and Decision Trees. Based on business intelligence and data exploration, five mining goals are defined. The goals are evaluated against the trained models. Complex queries can be answered by these three models, each with its own strength with respect to ease of model interpretation, access to detailed information and accuracy. Four out of the five goals answered by Naïve Bayes; Three by Decision Trees; and Two by Neural Network. Although Decision Trees is not the most effective model, but the results are easier to read and interpret. The drill through feature to access detailed customer’ profiles is only available in Decision Trees. Naïve Bayes fared better than Decision Trees as it could identify all the significant trading predictors. The attributes relationship produced by Neural Network is more difficult to understand.
IPSRPS can be further enhanced and expanded. For example, it can incorporate other marketing attributes besides the 15 listed in Figure 1. It can also incorporate other data mining techniques, e.g., Time Series, Clustering and Association Rules. Continuous data can also be used instead of just categorical data. Another area is to use Text Mining to mine the vast amount of unstructured data available in customer databases. Another challenge would be to integrate data mining and text mining [13].
REFERENCES
[1] Turkish Exporter.: “Customers Databases”, https:// turkishexporter.com.tr/en/companies/, 2019.
[2] Charly, K: “Data Mining for the Enterprise”, 31st Annual Hawaii Int. Conf. on System Sciences, IEEE Computer, 7, 295-304, 1998.
[3] Fayyad, U: “Data Mining and Knowledge Discovery in Databases: Implications fro scientific databases”, Proc. of the 9th Int. Conf. on Scientific and Statistical Database Management, Olympia, Washington, USA, 2-11, 1997.
[4] Giudici, P.: “Applied Data Mining: Statistical Methods for Business and Industry”, New York: John Wiley, 2003.
[5] Kamber, M., Han, J.: “Data Mining Concepts and Techniques”, Morgan Kaufmann Publishers, 2006.
[6] Ho, T. J.: “Data Mining and Data Warehousing”, Prentice Hall, 2005. [7] Mehmed, K.: “Data mining: Concepts, Models, Methods and Algorithms”,
New Jersey: John Wiley, 2003.
[8] Esra K., Kumru U., Mustafa H.: “A Data Mining Based Approach to a Firm’s Marketing Channel”, 22nd International Economic Conference. 2(1), 7-9, 2015.
[9] Microsoft Developer Network (MSDN). http://msdn2.microsoft.com/en-us/virtuallabs/aa740409.aspx, 2007.
[10] E.W.T. Nagi, Li Xiu, D.C.K. Chau: “Application of data mining techniques in customer relationship management: A literature review and classification”, 2008.
[12] Thuraisingham, B.: “A Primer for Understanding and Applying Data Mining”, IT Professional, 28-31, 2000.
[13] Zhongju, Z., L., Rich, S.Weiguo, F., Wallace: “Tapping the Power of Text Mining”, Communication of the ACM. 49(9), 77-82, 2006.
AUTHORS
First Author – Mohamed Alashraf ALI, B.A. Computer Science, M.S. Faculty of Computer Engineering, Konya Technical Üniversity, [email protected]