Universidade de São Paulo
2015-07
An experimental analysis on time series
transductive classification on graphs
International Joint Conference on Neural Network, 2015, Killarney.
http://www.producao.usp.br/handle/BDPI/49426
Downloaded from: Biblioteca Digital da Produção Intelectual - BDPI, Universidade de São Paulo
Biblioteca Digital da Produção Intelectual - BDPI
An experimental analysis on time series
transductive classification on graphs
Celso A. R. de Sousa, Vinfcius M. A. Souza, Gustavo E. A. P. A. Batista
Instituto de Ciencias Matematicas e de Computac;:ilo Universidade de Silo Paulo, Silo Carlos, Brazil email:
{
sousa.vsouza.gbatista}
@icmc.usp.brAbstract-Graph-based semi-supervised learning (SSL) algo rithms perform well when the data lie on a low-dimensional manifold. Although these methods achieved satisfactory perfor mance on a variety of domains, they have not been effectively evaluated on time series classification. In this paper, we pro vide a comprehensive empirical comparison of state-of-the-art graph-based SSL algorithms combined with a variety of graph construction methods in order to evaluate them on time series transductive classification tasks. Through a detailed experimental analysis using recently proposed empirical evaluation models, we show strong and weak points of these classifiers concerning both performance and stability with respect to graph construction and parameter selection. Our results show that some hypotheses raised on previous work do not hold in the time series domain while others may only hold under mild conditions.
I. INTRODUCTION
Digital devices are collecting huge amounts of (usually unlabeled) time series data at increasing rates. Semi-supervised learning (SSL) algorithms can naturally deal with both labeled and unlabeled examples, being effective in this scenario. One of the most prominent approaches for SSL are the graph based classifiers. Although these methods achieved satisfactory performance on a variety of domains [1], [2], they have not been effectively evaluated in time series classification. Since similarity-based methods (using e.g. the Dynamic Time War ping (DTW) distance) are effective on time series classification
[3], [4], the use of graph-based methods can also be effective in this domain because the weighted graph encodes similarities between neigh bored examples.
In this paper, we provide a comprehensive empirical com parison of state-of-the-art graph-based SSL algorithms with respect to graph construction and parameter selection in order to evaluate them on time series transductive classification tasks. Specifically, we evaluate the graph-based SSL algorithms combined with a variety of graph construction methods using the empirical evaluation models recently proposed in [1].
Our experimental analysis focus on graph-based transduc tive classification, i.e., the graph-based SSL algorithms are evaluated based on their performance on the unlabeled ex amples without the necessity to provide generalization for the entire sample space. Since the weighted graph may approxima te the low-dimensional manifold in which the data should lie, graph-based SSL algorithms perform well in general classifi cation tasks when the manifold assumption holds. As opposed to the authors in [5], we apply graph-based SSL algorithms on
978-1-4799-1959-8/15/$31.00 @2015
IEEEtime series transductive classification tasks and show that they are competitive with the widely used I-nearest neighbor ( INN) classifier with DTW in many settings of graph construction method and data set.
From our results, we see that graph-based SSL algorithms can be effective on time series transductive classification tasks. In practice, these methods performed well in many data sets. However, we found problems on the stability' of these methods with respect to graph construction and parameter selection, which may hinder the effective use of SSL algorithms on some real applications of time series classification. Therefore, these methods should be used in the time series domain with a careful parameter selection.
A. Preliminaries
Suppose we have a sample2
X
:={xdi=l
C]Rd
containingboth labeled and unlabeled examples. Without loss of genera lity, we consider that the first I examples are labeled while the remainder are unlabeled. Let
Na
: ={i E
N* 11
:s;i
:s;a},
\fa
E
N*.
We consider that an exampleXi, i
:s; I, has labelYi E
Ne
where cE
N*
is the number of classes in the data set.Let
YE
Iffinxe
be a label matrix in whichYij
=1
if and onlyif
Xi
has labelYi
= j. LetNi
CX
be the set of neighbors ofXi
andXik
the k-th nearest neighbor ofXi'
B. Hypotheses
The authors in [1] provided a comprehensive empirical comparison of state-of-the-art graph-based SSL algorithms on benchmark data sets from a variety of domains. Based on their results, the authors have hypothesized some interesting properties, which may not hold in the time series domain. In this paper, we analyze the validity of these hypotheses in the time series domain through a comprehensive experimental study on time series transductive classification. For clarity, we highly the hypotheses raised on [1] in the following.
Hypothesis 1: The graphs generated by the mutual k nearest neighbors (mutKNN) graph show high instability for relatively small values of k.
1 The term stability is used in this paper in an empirical sense; we consider that an SSL algorithm is stable for a given graph construction method if there is no abrupt changes in its performance with respect to parameter selection.
2In this paper, we consider that Xi E IH:d is a time series of length d. For notation simplicity, we consider that all time series in the data set have the same length.
Hypothesis 2: The graphs generated by mutKNN tend to achieve better results than the graphs generated by other adjacency graph construction methods on unbalanced3 data sets.
Hypothesis 3: The Robust Multi-class Graph Transduction
(RMGT) [6] algorithm is not effective on unbalanced data sets.
Hypothesis 4: When using the Laplacian Regularized Least Squares (LapRLS) [7] algorithm, the graphs constructed from mutKNN generate smoother error surfaces than those generated by the graphs constructed from other adjacency graph construction methods.
C. Our findings
The graphs generated by mutKNN showed high instability for relatively small values of k only in a few data sets. Therefore, Hypothesis 1 may not hold in the time series domain. In addition, we found many cases in which all graph construction methods showed high instability for relatively small values of k. Probably, this behavior depends more on the data distribution than the graph construction method applied. However, such an instability is more probable to occur when we use graphs generated by mutKNN because they have less edges than the other graphs for the same value of k.
The graphs generated by mutKNN outperformed the other graphs in most settings for all weighted matrix generation methods, even on unbalanced data sets. Therefore, Hypothesis 2 holds in the time series domain and may not be restricted to unbalanced data sets.
The RMGT algorithm showed competitive results to the other classifiers in most settings. In addition, this method achieved the best overall performance in many data sets, even on those that we considered unbalanced. However, for the data sets with high unbalanced ratio, the RMGT algorithm showed poor performance for all graph construction methods. Therefore, at least in the time series domain, Hypothesis 3 may only hold on data sets with high unbalanced ratio. Additional results on graph-based transductive learning in the time series domain restricted to unbalanced data sets can be found in [8]. By analyzing the error surfaces generated by the LapRLS algorithm with respect to its regularization parameters, we observed a lot of patterns. However, we found no situation in which Hypothesis 4 holds. Although the authors in [1] showed that Hypothesis 4 may hold for digit recognition tasks, this hypothesis does not hold in the time series domain.
D. Outline
The remainder of this paper is organized as follows. Section
11 describes our experimental setup. Section III analyzes our results. Finally, Section IV provides our conclusions and open questions for future research.
11. EXPERIMENTAL SETUP
In this section, we provide a detailed description of our experimental setup. We used a slight variation of the empirical
31n this paper, we assume that a data set is unbalanced if the majority class has at least two times more examples than the minority class.
protocol described in [1]. In order to evaluate the validity of Hypotheses 1, 2, 3, and 4 in the time series domain, we performed experiments using 45 data sets available in the VCR repository4, which are widely used in the time series literature. We used the train/test splits suggested in the VCR repository. Since we provide experiments on transductive classification, training (Iabeled) and test (unlabeled) data are used together during the classification process. Due to reasons concerning reproducibility, all source codes, data sets, and results are freely available5.
A. Adjacency graph construction
Given a training sample
X
CJRd
and a distance functionrf/
:JRd
xJRd
f-7JR,
we generate a sparse graph 9 :=(X, £)
(or adjacency matrix
A
EIffinxn)
where£
cX
xX
is theset of edges. In this paper, we generate
A
from the k-nearest neighbors (kNN) graph, i.e., we setAij
=1
if and only ifXj
is one of the k-nearest neighbors of
Xi.
For all data sets, we setrf/(-,
.) as the DTW distance due to its exceptional performance on time series classification tasks [3]. Since many graph-based SSL algorithms provide regularization onry
on undirected graphs, we generated an adjacency matrixA
E{O,
1, 2}nxn
from the kNN graph using the following post-processing methods: (1) symmetric kNN (symKNN); (2) mutual kNN (mutKNN); and (3) symmetry favored kNN (symFKNN) [6]. Since the mutKNN graph may contain isolated vertices, we created an undirected edge between each isolated vertex and its nearest neighbor, as suggested in [1]. The parameter k was chosen in the set
{4,
6,
8,... ,40}.
B. Weighted matrix generation
Given an adjacency matrix
A
and a distance functionrf/(-,
.)
, we have to generate a sparse, non negative, sYlmnetric, weighted matrixW
EJRnxn
whereWij
represents the similarity betweenXi
andX j.
In order to generateW
fromA
usingrf/(-,
.) and a similarity functionK
:JRd
xJRd
f-7JR,
we used the following weighted matrix generation methods: RBF kernel; Hein & Maier's (HM) similarity function [9]; and Locally Linear Embedding (LLE) [10]. The RBF ker nel measures the similarity between examples
Xi
andXj
byKa(Xi,Xj)
=exp (-rf/2(Xi,Xj)j (
2
0-2
))
where 0- EJR't-
isthe kernel's parameter. As discussed in [1], the HM method can be viewed as an RBF kernel with a local adaptive kernel size for each ordered pair of neighbors
(Xi, X j).
For the HM method, we compute the local adaptive kernel sizes o-t
as o-t
=l' max{rf/(xi,Xik)' rf/(Xj,Xjk)}'
When there is a very restricted number of labeled examples, it is not straightforward to find an adequate value for 0-.
In addition, the value of 0- may have high influence in the
SSL algorithms' performance [11]. In this paper, we estimate the value of 0- by 0- =
L�=l rf/ (Xi,Xik) j(3n),
as suggestedin [11]. The RBF kernel and the HM method generate the weighted matrix
W
asWij
=AijK(Xi,Xj),
Vi,j ENn.
On the other hand, the LLE method generates
W
by minimizing the local reconstruction error on each example4http://www.cs.ucr.edu/�eamonn/time_series_datal Shttp://sites.labic.icmc.usp.brlsousaltime_series/.
x;:
�(Xi
)
=II
Xi
-LXjENi
WijXj
ll:
,
subject to W 2:0
andWIn = In. The symbol 11·112 represents the L2-norm and
In is the n-dimensional I-entry vector. In order to efficiently compute the LLE method, we used the Local Anchor Embed ding (LAE) method [12]6. As discussed in [1], LLE can be viewed as a special case of LAE when we use a bipartite graph whose "anchor" points are exactly the training examples. Since the LLE method can not guarantee that W is symmetric, we applied the symmetrization process described in [1].
C. Graph Laplacian generation
Given a weighted matrix W, we have to generate a graph Laplacian 7. The most conunonly used Laplacians in the SSL
literature are the combinatorial and normalized Laplacians [14], which are respectively defined as a := D - Wand
L := In - D-1/2WD-1/2 where D := diag(WIn) and
In is the n-by-n identity matrix. These graph Laplacians are important tools for graph-based SSL because they are
positive semi-definite matrices (if we assume that W 2:
0
and W = WT), i.e., synunetric matrices with nonnegative
eigenvalues. Therefore, the cost function of most graph-based SSL algorithms become convex; hence, we can get a closed form solution of these algorithms.
In an attempt to avoid numerical instabilities while exe cuting the SSL algorithms, we generated the combinatorial Laplacian as a := 1] D - Wand. the normalized Laplaci�n
as L := 1]In - D-1/2WD-1/2 WIth 1] >
1,
as descnbed In[1]. In our experiments, we set 1] =
1.01.
Although this simpleprocedure performed well, avoiding numerical instabilities in a variety of data sets, we observed some numerical instabilities while running RMGT on some data sets. Even increasing the value of 1], these numerical instabilities were observed.
D. SSL algorithms
Given a graph Laplacian, we are able to perform convex regularization on the weighted graph using the SSL algorithms. A variety of graph-based SSL algorithms solve a convex optimization problem (possibly subject to some fitting and/or normalization constraints) using a Laplacian regularizer term as smoothness functional. Formally, this term is a smoothness penalty term that tries to reflect the intrinsic geometric struc ture of the data marginal distribution.
In this paper, we provide experiments on graph trans duction using the following graph-based SSL algorithms:
Gaussian Fields and Harmonic Functions (GFHF)8 [16];
Local and Global Consistency (LGC) [17]; LapRLS [7]; and RMGT [6]. The ambient and intrinsic regularization parameters 1'A and 1'1 of LapRLS were chosen in the set
{l0-6, 10-4, 10-
2, 10-1, 1, 10, lOO},
as suggested in [18]. We generated the kernel matrix K E IRnxn for LapRLS using the RBF kernel with the same parameter estimation in [11]. The regularization parameter JL in the LGC algorithm was chosen in the set{0.01, 0.05, 0.1, 0.5,1,2,5,10,50, lOO}.
6http://www.ee.columbia.edu/ln/dvmmldownloads/ WeiGraphConstructCode/dlform.htm.
7See [13] for a general formulation of graph Laplacians. For simplicity, we only used in this paper the matrix formulations of these operators.
8See [15] for a review on the GFHF algorithm.
For RMGT, we assumed a uniform class distribution, as suggested in [6]. Since the normalized Laplacian achieves better results than the combinatorial Laplacian in general SSL tasks [19], we used the normalized Laplacian during optimiza tion when applicable. Specifically, we used the combinatorial Laplacian for RMGT and the normalized Laplacian for the other SSL algorithms, as suggested in [1].
E. Evaluation
The graph-based SSL algorithms are evaluated based on their error rates on test data with respect to graph construction and parameter selection. A variety of (naive and biased) empirical comparisons of graph-based SSL algorithms based only on their best error rates (or other measure) have been done in the literature. However, as discussed in [1], this empirical analysis alone may lead to tendentious conclusions related to the classifiers' performance with respect to graph construction and parameter selection.
For a comprehensive experimental analysis, we used the empirical evaluation models described in [1], which are: (1)
best case analysis, in which we compare each combination of SSL algorithm and graph construction method using their best error rates on each data set; (2) evaluation of classifier stability,
in which we evaluate how the SSL algorithms' performance is affected with respect to k for each graph construction method; (3) evaluation of graph stability, in which we evaluate how the performance of a given SSL algorithm is affected with respect to k using a variety of graph construction methods; and (4) evaluation of regularization parameters, in which we evaluate the SSL algorithms' performance with respect to their regularization parameters on a fixed graph, whose parameter k is the one that achieved the best result in the best case analysis. We also report the performances for the INN classifier using DTW with best warping window as baseline.
Ill. ANALYSIS OF OUR RESULTS
In this section, we provide a comprehensive experimen tal analysis of our results. We used in our experimental analysis the following weighted graphs: symKNN-RBF (G 1); mutKNN-RBF (G2); symFKNN-RBF (G3); symKNN-HM (G4); mutKNN-HM (G5); symFKNN-HM (G6); symKNN LLE (G7); mutKNN-LLE (G8); and symFKNN-LLE (G9).
A. Best case analysis
We now evaluate the SSL algorithms' performance for each graph construction method based on their best error rates with respect to parameter selection. Due to lack of space, we sununarize the results for the best case analysis only based on average rankings of the SSL algorithms/graph construction methods over all data sets using nonparametric statistical tests. Table I shows the average rankings for the SSL algorithms with respect to graph construction while Table 11
shows the average rankings of the graph construction methods for each SSL algorithm. The best average ranking for each graph construction method/SSL algorithm is in bold. In both tables, the results that were statistically9 outperformed by the best ranked method have a grey background.
9We used the Friedman's test with the Nemenyi's post test using a significance level of 0.05; see [20] for a review on statistical tests for machine learning.
0.3,----�--- --____. ... 0.25 0.2 0.4,---, O.35·� 0.3 \ ., 0.25
\.
0.2 .� -· .. � •. 4 .... 1:*" . ..1
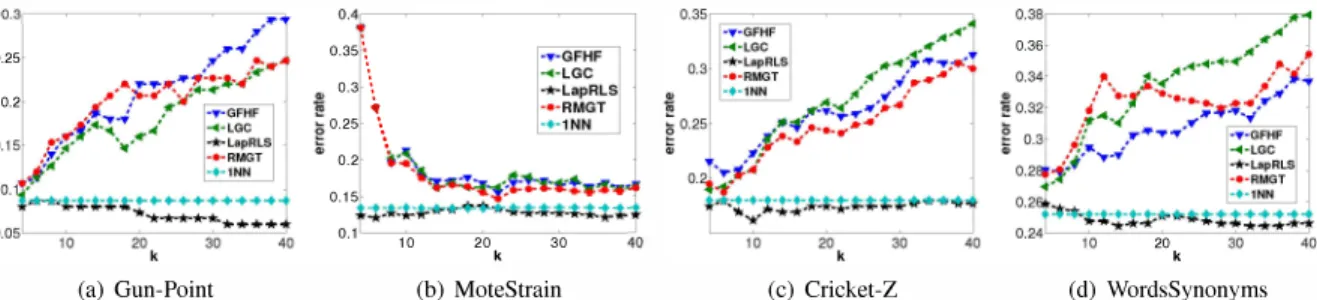
015 - �-�.:r:"" .... � 0.38,---_ 0.36 . :t:4=t; ... *4'4"4"4".t.; �1-0.11 10 20 k 30 410 20 k(a) Gun-Point (b) MoteStrain (c) Cricket-Z (d) WordsSynonyms
Fig. l. Average error rates of the SSL algorithms with respect to k on the Gun-Point (using the symKNN-HM graph). MoteStrain (using the mutKNN-LLE graph), Cricket-Z (using the symFKNN-LLE graph), and WordsSynonyms (using the symFKNN-LLE graph) data sets.
TABLE I. AVERAGE RANKINGS FOR THE SSL ALGORITHMS WITH RESPECT TO GRAPH CONSTRUCTION.
GI G2 G3 G4 GFHF 2.535 2.407
I
2.465I
2.872 LGC 2.291 I 2.523 2.244 2.733 J LapRLS 1.686 1.686 1.791 1.802 RMGT 3.488 3.384 3.5 2.5931TABLE n. AVERAGE RANKINGS FOR THE GRAPH CONSTRUCTION METHODS FOR EACH SSL ALGORITHM.
GFHF LGC LapRLS RMGT mean symKNN-RBF 4.628 4.663 4.279 I 6.314 4.971 mUIKNN-RBF 3.779 3.977 3.849 4.814 4.105 symFKNN-RBF 3.965 4.151 4.291 5.756 4.541 symKNN-HM 6.488 6.465 6.674 1 5.546 6.293 mUIKNN-HM 4.884 4.779 4.849 4.465 4.744 symFKNN-HM 5.547 5.349 5.547 4.291 5.183 symKNN-LLE 5.860 5.895 5.907 1 5.186 5.712 mUIKNN-LLE 4.802 4.802 4.395 4.221 4.555 symFKNN-LLE 5.046 4.919 5.209 4.407 4.895
We see in Table I that the LapRLS algorithm achieved the best average ranking for all graph construction methods. Therefore, for the best case analysis, LapRLS is the most effective SSL algorithm. In addition, the LapRLS algorithm statistically outperformed the competing classifiers for most graph construction methods, which is a surprising result. We also see in Table I that the RMGT algorithm achieved the worst average ranking for the graphs generated by the RBF kernel while achieving the second best average ranking for the graphs generated by the HM and LLE methods. Therefore, in terms of average ranking, the graphs generated by the RBF kernel may not be adequate for the RMGT algorithm. However, this classifier achieved competitive results to the other SSL algorithms in many data sets using the symKNN RBF, mutKNN-RBF, and symFKNN-RBF graphs.
We see in Table IT that the mutKNN-RBF graph achieved the best overall average ranking. Therefore, for the best case analysis, mutKNN-RBF is the best graph for general tasks of time series transductive classification. We also see in Table
11 that the graphs generated by mutKNN achieved better average rankings than the graphs generated by symKNN and symFKNN for most weighted matrix generation methods and SSL algorithms. The graphs generated by the RBF kernel achieved competitive results in the overall average rankings. The symKNN-RBF and symFKNN-RBF graphs achieved the second and third best average rankings, respectively, for the GFHF, LGC, and LapRLS algorithms. However, for the RMGT algorithm, these graphs achieved the worst average rankings, possibly not being the most appropriate graphs for this classi fier. G5 G6 G7 G8 G9 mean 2.953 2.895 2.837 2.919 2.884 2.752 2.570 2.616 I 2.709 2.721 2.698 2.567 1.965 2.01 1.849 1.872 1.895 1.839 2.512 2.477 r 2.6051 2.488 2.523 2.841
We observed some numerical instabilities when applying the RMGT algorithm on some data sets. For instance, this clas sifier found no solution for the Fish and DiatomSizeReduction data sets using the graphs generated by the RBF kernel for all
values of k. Probably, a global kernel size may not be adequate for these data sets when using the RMGT algorithm.
B. Evaluation of classifier stability
Fig. 1 shows the results for the SSL algorithms on the Gun Point, MoteStrain, Cricket-Z, and WordsSynonyms data sets. We see that the INN classifier showed similar performance to the LapRLS algorithm and these two methods outperformed the GFHF, LGC, and RMGT algorithms by a large margin on dense graphs. Also, the LapRLS algorithm showed exceptional stability in these settings. Probably, the effectiveness of the LapRLS algorithm over the other SSL algorithms in these data sets may be explained because the kernel matrix K revealed intrinsic geometric properties of the data.
0.8==�---� 10 20 k 30 (a) OSULeaf 40 0.2==�---� 0.0 10 20 30 40 k (b) Sony AIBORobotSurfaceII Fig. 2. Average error rates of the SSL algorithms with respect to k on the OSULeaf and SonyAIBORobotSurfaceII data sets using the symKNN-RBF graph.
Although Fig. 1 shows that the LapRLS algorithm may be an effective classifier, we found many situations in which this method showed high instability. For instance, we see in Fig. 2(a) that the LapRLS algorithm showed high instability even for small variations of k, while the competing methods showed good stability. This situation is undesired on real applications. In Fig. 2(b), we see that the LapRLS algorithm showed high instability with smooth variation. Also, this method achieved competitive results to the other classifiers only when k �
10.
(a) FaceFour '0 20 k 0.5,---�---, 0.4 � ... . '0 (b) Sony AIBORobotSurface (c) CinC-ECG-torso
Fig. 3. Average error rates of the SSL algorithms with respect to k on the FaceFour (using the symKNN-HM graph), SonyAIBORobotSurface (using the symFKNN-LLE graph), and CinC-ECG-torso (using the symKNN-HM graph) data sets.
Fig. 3 shows the results for the SSL algorithms on the FaceFour, Sony AIBORobotSurface, and CinC-ECG-torso data sets, which we considered unbalanced. We see that the RMGT algorithm showed exceptional performance and stability on these data sets, beating the INN classifier by a large margin on the SonyAIBORobotSurface data set. The RMGT algorithm outperformed the other SSL algorithms by a large margin on dense graphs. Therefore, Hypothesis 3 may not hold in the time series domain. Probably, the effectiveness of the RMGT algorithm over the other SSL algorithms in these data sets may be explained by the use of normalization constraints that incorporate class prior knowledge during optimization.
0.3,---�---, 0.25
O.05'----c,:c-0 ---c2Oc O ---c30e0 ---!40
k (a) ECG200 .!! � 0.4,---�---, 0.35 /"._"'�' ... .... � ... -.-.-.. �, ... g 0.3 (b) MedicalImages 0.4,---, 0.3 . �
�
0.2 .• or· .... ·•·•·•· .... ••• .. ·•·•·•· (c) Wafer 30 40Fig. 4. Average error rates of the SSL algorithms with respect to k on the ECG200 (using the symFKNN-HM graph), MedicaUmages (using the symFKNN-LLE graph), and Wafer (using the symKNN-LLE graph) data sets.
Fig. 4 shows the results for the SSL algorithms on the ECG200, MedicalImages, and Wafer data sets. We see that the RMGT algorithm showed poor results for virtually the entire range of k values while the other SSL algorithms showed competitive performance in these data sets, which have a high
unbalanced ratio. Therefore, Hypothesis 3 may only hold for data sets with high unbalanced ratio.
r
···· ... .' ... .! A 0.5 0.4 ... .r� 0.3 �i
J.,;'..,-"..�T ... �-.,.. ...�
0.3 .�-<t(' l-..,. . .,.·.-...�
0.2 ./ • .,..J¥i.�""-.'.-"' .i
" . ..}., .• : ... : ... * ... :: 0.2 l .""; ... �:J;4J� 0.1 :..:;;. -'",... � o. ....:.-.-.-... .,..;::t.-t ... ,:�.-... .. "'11:;:;1 ... .., .. .. '0 20 k 30 40 o '0 20 30 40 (a) Trace (b) FaceFour• .-",.f/{' !'
:i
�
0.1 .i i 0.08 .<t( ••• <t( 0.0 -+-+-•.•.• -.-;1-... ++++ .... . 0.04.i
..
...
., ... ... ,.' : ... ...:t ... : •. -...... .. 0.0 10 20 30 40 k (c) SymbolsFig. 5. Average error rates of the SSL algorithms with respect to k on the Trace (using the symKNN-LLE graph), FaceFour (using the symFKNN-RBF graph), and Symbols (using the symFKNN-LLE graph) data sets.
Fig. 5 shows the results for the SSL algorithms on the Trace, FaceFour, and Symbols data sets. Although the SSL algorithms achieved similar results in the best case analysis in these data sets, we see that the LGC algorithm showed high instability in these data sets while the other methods showed similar performances for the entire range of k values. Unfortunately, we found no theoretical or empirical evidence that could explain this behavior. From these results, we see that the LGC algorithm should be used with a careful parameter selection depending on the data set. However, we note that this anomaly occurred only in a few settings of graph construction in certain ranges of k values.
C. Evaluation of graph stability
We now evaluate how the performance of the SSL al gorithms is affected with respect to k using different graph construction methods. Specifically, in each evaluation, we fix an SSL algorithm and its corresponding regularization parameters and report the error rates of this method on each data set using the graph construction methods .
Fig. 6 shows the results for the graph construc tion methods on the SonyAIBORobotSurface, FacesUCR, uWaveGestureLibrary-X, and SonyAIBORobotSurfaceII data sets for given SSL algorithms. We see that the graphs generated by mutKNN achieved the best performances when k ;:::
16.
However, Fig. 6(b) and 6(d) show that these graphs achieved high instability for relatively small values of k. Since such an instability was only evidenced in a few data sets, Hypothesis
10 (a) SonyAIBORobotSurface ·.·symKNN-RBF ·.·mutKNN-RBF ·.·symFKNN-RBF • ... ·symKNN-HM ·+·mutKNN-HM ·.,.·symFKNN-HM 20 30 k (b) FacesUCR 40 (c) uWaveGestureLibrary-X (d) SonyAIBORobotSurfacell
Fig. 6. Average error rates for the graph construction methods on the SonyAIBORobotSurface (using the LapRLS algorithm), FacesUCR (using the RMGT algorithm), uWaveGestureLibrary-X (using the GFHF algorithm), and SonyAIBORobotSurfacell (using the LGC algorithm) data sets.
0.55,---�---,
(a) 50words (b) MedicalImages
0.2'----c,:;;-0--O:;20;----;03�0 -----:40
k
(c) WordsSynonyms
Fig. 7. Average error rates for the graph construction methods with respect to k on the 50words (using the GFHF algorithm), MedicalImages (using the RMGT algorithm), and WordsSynonyms (using the GFHF algorithm) data sets.
Fig. 7 shows the results for the graph construction methods on the 50words, MedicaLImages, and WordsSynonyms data sets for given SSL algorithms. We see that the graphs ge nerated by the RBF kernel achieved better performance and stability than the other graphs for virtually the entire range of k values. In addition, we note that the symKNN-HM and symFKNN-HM graphs showed no competitive results to the other graphs for relatively large values of k (dense graphs) on the MedicaLImages data set.
Fig. 8 shows the results for the graph construction methods on the CinC-ECG-torso, ECGFiveDays, and FaceFour data sets for given SSL algorithms. We see that the symKNN-HM and symFKNN-HM graphs showed no competitive results to the other graphs when k
� 14.
We also observed in Fig. 8(a) and 8(b) that the graphs generated by mutKNN showed poor performance when k =4.
Probably, the graphs generatedin this setting are disconnected, having components with no labeled examples. In addition, we note that the mutKNN-HM graph showed no competitive results to the graphs generated by the RBF kernel and the LLE method for large values of k on the ECGFiveDays data set while achieving satisfactory results in the other data sets.
(a) CinC-ECG-torso (b) ECGFiveDays
(c) FaceFour
Fig. 8. Average error rates for the graph construction methods with respect to k on the CinC-ECG-torso (using the LGC algorithm), ECGFiveDays (using the LGC algorithm), and FaceFour (using the LapRLS algorithm) data sets.
Fig. 9 shows the results for the graph construc tion methods on the ChlorineConcentration, Gun-Point, and NonInvasiveFetaLECG-Thorax 1 data sets for given SSL algo rithms. We see that the graphs generated by the LLE method achieved better performance and stability than the other graphs for almost the entire range of k values. In addition, we note that the graphs generated by the HM method and the RBF kernel showed high instability and similar behaviors with respect to k on these data sets.
D. Evaluation of regularization parameters
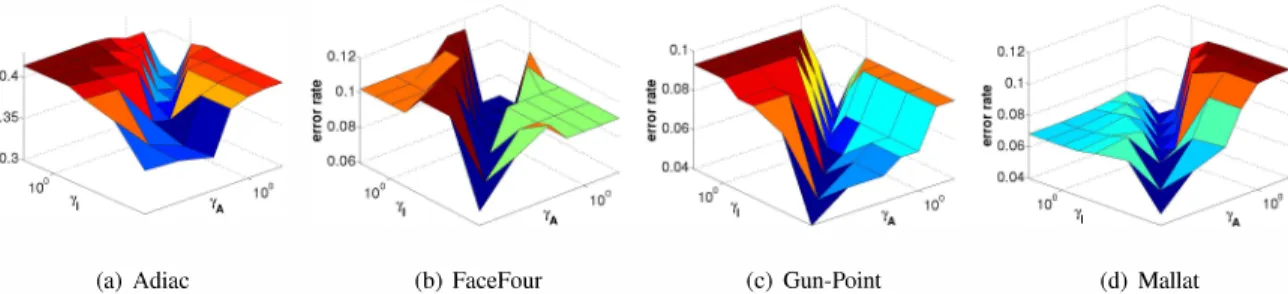
Fig. 10 shows the error surfaces for the LapRLS algorithm on the FaceFour, Gun-Point, and Mallat data sets for given graph construction methods. We see that the optimal results only occurred when lA = If. A similar pattern was reported
in [1] on a benchmark data set of text classification.
Fig. 11 shows the error surfaces for the LapRLS algorithm on the Symbols, CinC-ECG-torso, and Wafer data sets. For these data sets, we see that the optimal results only occurred when I A
i=
If, which is an opposite pattern to that reported in Fig. 10. Although this pattern only occurred in a few settings, it may extremely hinder the process of parameter selection for the LapRLS algorithm with respect to I A and If.(a) Adiac (b) FaceFour (c) Gun-Point (d) Mallat
Fig. 10. Error surfaces for the LapRLS algorithm with respect to 'YA and 'Y1 on the FaceFour (using the mutKNN-LLE graph), Gun-Point (using the symKNN-RBF graph), and Mallat (using the symFKNN-HM graph) data sets.
(a) ChlorineConcentration (b) Gun-Point
O. 08"---c,co- O ---=c20�-�30��40
k
(c) NonlnvasiveFetalECG-Thorax I
Fig. 9. Average error rates for the graph construction methods with respect to k on the ChlorineConcentration (using the GFHF algorithm), Gun-Point (using the RMGT algorithm), and NonlnvasiveFetalECG-Thoraxl (using the RMGT algorithm) data sets.
Fig. 12 shows the error surfaces for the LapRLS algorithm on the MoteStrain, uWaveGestureLibrary-X, InlineSkate, and NonInvasiveFetalECG-Thoraxl data sets. We see that these error surfaces showed high stability for almost the entire parameter space, which is a desirable property for real appli cations. In other words, Fig. 12 shows situations in which the LapRLS algorithm is weakly dependent of parameter selection with respect to lA and "/f. Therefore, the process of parameter selection for the LapRLS algorithm may not be necessary in these situations. Although this pattern was only evidenced in a few settings, it might be interesting investigating for which data distributions it tends to occur.
We observed high variability in the error surfaces for the LapRLS algorithm with respect to "/A and "/f for each graph construction method, which may hinder the process of parameter selection for this method and its effective use on real applications. From our results, we see that, in general, the LapRLS algorithm is strongly dependent of parameter selection with respect to "/ A and "/f. On the other hand, this method can significantly outperform the other SSL algorithms. Therefore, this method should be used in the time series domain with a careful parameter selection.
(a) Symbols (b) CinC-ECG-torso
(c) Wafer
Fig. 11. Error surfaces for the LapRLS algorithm with respect to 'Y A and 'Y I
on the Symbols (using the mutKNN-HM graph), CinC-ECG-torso (using the mutKNN-RBF graph), and Wafer (using the symFKNN-HM graph) data sets.
IV. CONCLUSION AND FUTURE RESEARCH
In this paper, we provided a comprehensive experimental analysis on time series transductive classification on graphs with respect to graph construction and parameter selection. From our results, we observed the following:
• the graphs generated by mutKNN showed high ins
tability on some data sets for small values of k. However, these graphs showed good performance and stability on a variety of data sets, even in this setting. Therefore, Hypothesis 1 may not generally hold;
• the graphs generated by mutKNN outperformed those
generated by symKNN and symFKNN in most situa tions for all weighted matrix generation methods, even on balanced data sets. Therefore, Hypothesis 2 holds in the time series domain and may not be restricted to unbalanced data sets;
• although the RMGT algorithm showed competitive re
sults to the other classifiers in most situations, even on unbalanced data sets, this method showed poor results on data sets with high unbalanced ratio. Therefore, at least in the time series domain, Hypothesis 3 may only hold for data sets with high unbalanced ratio;
(a) MoteStrain (b) uWaveGestureLibrary-X (c) InlineSkate (d) NonlnvasiveFetalECG-Thorax1 Fig. 12. Error surfaces for the LapRLS algorithm with respect to lA and If on the MoteStrain (using the mutKNN-RBF graph), uWaveGestureLibrary-X (using the symKNN-RBF graph), InlineSkate (using the symKNN-LLE graph), and NonlnvasiveFetalECG-Thorax1 (using the symFKNN-LLE graph) data sets.
•
•
although Hypothesis 4 may hold for digit recogni tion tasks [1], we found no situations in which the graphs constructed from mutKNN generated smoother error surfaces than those generated by the graphs constructed from symKNN and symFKNN. Therefore, Hypothesis 4 does not hold in the time series domain; the LGC and LapRLS algorithms should carefully be used in the time series domain due to the following observations: (1) the LGC algorithm achieved high instability on some data sets; and (2) although the LapRLS algorithm achieved the best overall avera ge rankings with respect to graph construction, this method showed strong dependency of parameter se lection with respect to lA and If on most data sets. After a comprehensive experimental analysis, we found questions that could not be answered in this paper due to lack of empirical and/or theoretical evidence. These questions are discussed in the following.
Question 1: Why the RMGT algorithm is not effective on data sets with high unbalanced ratio? Is there any pre or post processing method that could turn it effective in this scenario?
It is unclear why the RMGT algorithm showed no com petitive results to the other classifiers on data sets with high unbalanced ratio. Probably, by using class prior knowledge combined with some class mass normalization procedure (e.g. [16]), this classifier might achieve better results in this sce nario.
Question 2: For which data distributions the LapRLS algorithm can be considered weakly dependent of parameter selection with respect to I A and If?
Supposing we have an (approximate) answer to this ques tion (some distribution P), is it possible to create a prepro cessing method that transform the original data into a data set with a distribution near to P, approximating the geometric properties of the original data? Applying this preprocessing method, the process of parameter selection for the LapRLS algorithm will not be necessary, which is useful for real applications.
ACKNOW LEDGMENTS
This research was supported by the Brazilian agencies CAPES, FAPESP under grant 2012/50714-7, and CNPq under grant 446330/2014-0.
REFERENCES
[1] C. A. R. de Sousa, S. O. Rezende, and G. E. A. P. A. Batista, "Influence of graph construction on semi-supervised learning," in ECMUPKDD, 2013, pp. 160-175.
[2] c. A. R. de Sousa and G. E. A. P. A. Batista, "Robust multi-class graph transduction with higher order regularization," in IJCNN, 2015. [3] H. Ding, G. Trajcevski, P. Scheuermann, X. Wang, and E. Keogh,
"Querying and mining of time series data: experimental comparison of representations and distance measures;' PVLDB, vol. 1, no. 2, pp. 1542-1552, 2008.
[4] X. Wang, A. Mueen, H. Ding, G. Trajcevski, P. Scheuermann, and E. Keogh, "Experimental comparison of representation methods and distance measures for time series data," DMKD, voJ. 26, no. 2, pp. 275-309, 2013.
[5] L. Wei and E. Keogh, "Semi-supervised time series classification," in KDD, 2006, pp. 748-753.
[6] W. Liu and S.-F. Chang, "Robust multi-class transductive learning with graphs," in CVPR, 2009, pp. 381-388.
[7] M. BeIkin, P. Niyogi, and Y. Sindhwani, "Manifold regularization: a ge ometric framework for learning from labeled and unlabeled examples." JMLR, voJ. 7, pp. 2399-2434, 2006.
[8] C. A. R. de Sousa, Y. M. A. Souza, and G. E. A. P. A. Batista, "Time series transductive classification on imbalanced data sets: an experimental study," in ICPR, 2014, pp. 3780-3785.
[9] M. Hein and M. Maier, "Manifold denoising," in NIPS 19, 2007, pp. 561-568.
[10] S. Roweis and L. Saul, "Non linear dimensionality reduction by locally linear embedding," Science, vol. 290, no. 5500, pp. 2323-2326, 2000. [11] T. lebara, 1. Wang, and S.-F. Chang, "Graph construction and b matching for semi-supervised learning," in 1CML, 2009, pp. 441-448. [12] w. Liu, 1. He, and S.-F. Chang, "Large graph construction for scalable
semi-supervised learning," in ICML, 2010, pp. 679-686.
[13] M. Hein, 1.-Y. Audibert, and U. von Luxburg, "Graph laplacians and their convergence on random neighborhood graphs," JMLR, voJ. 8, pp. 1325-1368, 2007.
[14] X. Zhu, "Semi-supervised learning literature survey," Computer Sci ences, University of Wisconsin-Madison, Tech. Rep. 1530, 2005. [15] c. A. R. de Sousa, "An overview on the gaussian fields and harmonic
functions method for semi-supervised learning," in IJCNN, 2015. [16] X. Zhu, Z. Ghahramani, and 1. Lafferty, "Semi-supervised learning
using gaussian fields and harmonic functions;' in ICML, 2003, pp. 912-919.
[17] D. Zhou, O. Bousquet, T. N. Lal, 1. Weston, and B. Scholkopf, "Learning with local and global consistency," in NIPS 16, 2004, pp. 321-328.
[18] S. Melacci and M. Belkin, "Laplacian support vector machines trained in the primal," JMLR, vol. 12, pp. 1149-1184, 2011.
[19] R. 10hnson and T. Zhang, "On the effectiveness of laplacian normaliza tion for graph semi-supervised learning," JMLR, vol. 8, pp. 1489-1517, 2007.
[20] 1. Demsar, "Statistical comparisons of classifiers over multiple data sets," JMLR, vol. 7, pp. 1-30, 2006.