Czech Technical University in Prague Faculty of Electrical Engineering
Department of Cybernetics
DIPLOMA THESIS ASSIGNMENT
Student: Bc. Marek M o d r ý Study programme: Open Informatics Specialisation: Artificial Intelligence
Title of Diploma Thesis: Learning to Rank Algorithms
Guidelines:
Design and test an algorithm for ranking URLs by relevance given a user search query. Feature vector data sets with manually assigned ranked results for training and testing will be provided.
1. Analyze the most important learning to rank algorithms adequate for the task. 2. Analyze and describe applicable precision measures for this task.
3. Analyze the training data and the feature vector signals, estimate signals discriminative power.
4. Implement the chosen algorithm.
5. Test and evaluate the designed algorithm. Bibliography/Sources:
[1] William W. Cohen , Robert E. Schapire , Yoram Singer: Learning to order things. Journal of Artificial Intelligence Research, v.10 n.1, p.243-270, January 1999.
[2] Jun Xu , Hang Li, AdaRank: a boosting algorithm for information retrieval, Proceedings of the 30th annual international ACM SIGIR conference on Research and development in information retrieval, July 23-27, 2007, Amsterdam, The Netherlands.
[3] Chris Burges, Tal Shaked, Erin Renshaw, Ari Lazier, Matt Deeds, Nicole Hamilton, Greg Hullender: Learning to rank using gradient descent. Proceedings of the 22nd international conference on Machine learning, p.89-96, August 07-11, 2005, Bonn, Germany.
[4] Olivier Chapelle , Donald Metlzer , Ya Zhang , Pierre Grinspan: Expected reciprocal rank for graded relevance. Proceeding of the 18th ACM conference on Information and knowledge management, November 02-06, 2009, Hong Kong, China.
[5] Kalervo Järvelin and Jaana Kekäläinen: Cumulated Gain-based Evaluation of IR Techniques. ACM Transactions on Information Systems, 20:422-446, 2002.
[6] L. Page, S. Brin, R. Motwani, T. Winograd - Page, Lawrence, et al.: The PageRank citation ranking: bringing order to the web. (1999).
Diploma Thesis Supervisor: Ing. Jan Šedivý, CSc.
Valid until: the end of the winter semester of academic year 2014/2015
L.S.
prof. Ing. Vladimír Mařík, DrSc. Head of Department
prof. Ing. Pavel Ripka, CSc. Dean
České vysoké učení technické v Praze Fakulta elektrotechnická
Katedra kybernetiky
ZADÁNÍ DIPLOMOVÉ PRÁCE
Student: Bc. Marek M o d r ý
Studijní program: Otevřená informatika (magisterský) Obor: Umělá inteligence
Název tématu: Algoritmy pro učení se řadit
Pokyny pro vypracování:
Navrhněte a otestujte algoritmus pro učení se řadit URL podle důležitosti na základě
uživatelského dotazu. Trénovací data s ručně označenými výsledky pro trénink a testování budou poskytnuta.
1. Analyzujte nejdůležitější algoritmy pro učení se řadit, které jsou vhodné pro zadanou úlohu. 2. Analyzujte a popište vhodné metriky pro zadanou úlohu.
3. Analyzujte trénovací data a signály učícího vektoru, odhadněte diskriminativní sílu signálů. 4. Implementujte vybraný algoritmus.
5. Otestujte implementovaný algoritmus. Seznam odborné literatury:
[1] William W. Cohen , Robert E. Schapire , Yoram Singer: Learning to order things. Journal of Artificial Intelligence Research, v.10 n.1, p.243-270, January 1999.
[2] Jun Xu , Hang Li, AdaRank: a boosting algorithm for information retrieval, Proceedings of the 30th annual international ACM SIGIR conference on Research and development in information retrieval, July 23-27, 2007, Amsterdam, The Netherlands.
[3] Chris Burges, Tal Shaked, Erin Renshaw, Ari Lazier, Matt Deeds, Nicole Hamilton, Greg Hullender: Learning to rank using gradient descent. Proceedings of the 22nd international conference on Machine learning, p.89-96, August 07-11, 2005, Bonn, Germany.
[4] Olivier Chapelle , Donald Metlzer , Ya Zhang , Pierre Grinspan: Expected reciprocal rank for graded relevance. Proceeding of the 18th ACM conference on Information and knowledge management, November 02-06, 2009, Hong Kong, China.
[5] Kalervo Järvelin and Jaana Kekäläinen: Cumulated Gain-based Evaluation of IR Techniques. ACM Transactions on Information Systems, 20:422-446, 2002.
[6] L. Page, S. Brin, R. Motwani, T. Winograd - Page, Lawrence, et al.: The PageRank citation ranking: bringing order to the web. (1999).
Vedoucí diplomové práce: Ing. Jan Šedivý, CSc.
Platnost zadání: do konce zimního semestru 2014/2015
L.S.
prof. Ing. Vladimír Mařík, DrSc. vedoucí katedry
prof. Ing. Pavel Ripka, CSc. děkan
Czech Technical University in Prague Faculty of Electrical Engineering
Department of Cybernetics
Master's Thesis
Learning to Rank Algorithms
Bc. Marek Modrý
Supervisor: Ing. Jan edivý, CSc.
Study Programme: Open Informatics Field of Study: Articial Intelligence
vii
Aknowledgements
Above all, I am truly grateful to my supervisor, Ing. Jan edivý, CSc., whose encouragement, guidance and support from the initial to the nal part enabled me to fully examine the subject and write this thesis. Furthermore, I thank Seznam.cz for their cooperation and support. And lastly, I am thankful for the support from my family and especially from Mat¥j Eliá².
ix
Prohlá²ení
Prohla²uji, ºe jsem p°edloºenou práci vypracoval samostatn¥ a ºe jsem uvedl ve²keré pouºité informa£ní zdroje v souladu s Metodickým pokynem o dodrºování etických princip· p°i p°íprav¥ vysoko²kolských záv¥re£ných prací.
Abstract
In the recent decades and especially in the last few years, we have experienced a rapid growth of information. In the following years, the amount of data is supposed to multiply by hundreds. With growing amount of data, the need for high-quality Information Retrieval and for correct ranking of the retrieved results is rapidly increasing. Learning to Rank, as supervised machine learning methods, can help solving the issue which is present in many applications, such as web search engines, recommendation systems or misspelling corrections. This thesis provides an exhaustive listing and analysis of current state-of-the-art algorithms and it describes the necessary background for this work. Besides, it focuses on applicable performance measures and available datasets. All the hypothesis and knowledge are utilized in a thorough set of experiments. As LambdaMART was evaluated as the potentially best LTR algorithm, our own implementation of the algorithm is introduced and compared to an existing implementation. On the one hand, this thesis can server as a guide to any researcher interested in this topic and on the other it opens many new questions and issues.
Abstrakt
V nedávných desetiletích a zvlá²t¥ pak v posledních letech zaznamenáváme velký nár·st informací a dat. Studie p°edpokládají, ºe v následujících n¥kolika letech se mnoºství dat zvý²í násobky sta. Vzr·stající mnoºství dat zp·sobuje stále stoupající pot°ebu po kvalitním získávání informací a také po správném °azení dostupných získaných výsledk·. Learning to Rank je metoda strojového u£ení s u£itelem, která m·ºe nabídnout °e²ení t¥chto problém·, které se objevují v mnoha aplikacích jako internetové vyhledáva£e, doporu£ovací systémy nebo opravování p°eklep·. Tato diplomová práce p°edkládá vy£erpávající re²er²i sou£asných algoritm· a také v²e dopl¬uje popisem základních znalostí. Mimojiné se práce zam¥°uje i na vhodné metody m¥°ení kvality modelu a dostupné datové sady pro LTR. Nabyté v¥domosti a p°edpoklady jsou zuºitkovány v mnoºství experiment·. Jelikoº byl LambdaMART vy-hodnocen jako potenciáln¥ nejlep²í algoritmus, zam¥°ili jsme se na n¥j v na²í implementaci. Tato práce na²i implementace nejd°íve popí²e a poté zhodnotí v porovnání s jiº existujícími implementacemi metod pro LTR. Tato práce jednak m·ºe slouºit jako pr·vodce aktuálního stavu v oblasti LTR, tak i otevírá mnoho nových otázek a poukazuje na n¥kolik nových zajímavých problém·.
Contents
1 Introduction 1 2 Background 5 2.1 Information Retrieval . . . 5 2.2 Learning to Rank . . . 7 2.3 Search Engines . . . 7 2.4 Seznam.cz . . . 9 3 Learning to Rank 11 3.1 General Framework . . . 11 3.1.1 Problem description . . . 11 3.2 Data . . . 13 3.2.1 Data le format . . . 13 3.2.1.1 Labels . . . 14 3.2.1.2 Feature vector . . . 14 3.2.1.3 File . . . 14 3.2.2 Features . . . 15 3.2.3 Available datasets . . . 15 3.2.3.1 LETOR . . . 163.2.3.2 Microsoft Learning to Rank datasets . . . 16
3.2.3.3 Yahoo! Learning to Rank Challenge Datasets . . . 16
3.2.3.4 Yandex Internet Mathematics 2009 contest . . . 16
3.2.3.5 WCL2R . . . 17
3.2.3.6 Seznam.cz dataset . . . 17
3.2.4 Dataset statistics . . . 17
3.3 Performance Evaluation . . . 19
3.3.1 Introduction to Performance Measures . . . 19
3.3.2 Performance Measures . . . 20
3.3.2.1 Basic User Interaction Models . . . 20
3.3.2.2 Winner Takes All (WTA) . . . 21
3.3.2.3 Precision . . . 21
3.3.2.4 Mean Average Precision (MAP) . . . 21
3.3.2.5 Normalized Discounted Cumulative Gain (NDCG) . . . 22
3.3.2.6 Rank Biased Precision (RBP) . . . 22
3.3.2.7 Expected Reciprocal Rank (ERR) . . . 22 xiii
xiv CONTENTS
3.3.2.8 Probability of User Satisfaction (p-found) . . . 23
3.3.2.9 Seznam Rank (Seznam.cz) . . . 23
3.3.2.10 Top K documents (@k) . . . 24
3.3.3 Measures Analysis . . . 24
3.3.4 Summary . . . 28
3.4 Algorithms . . . 29
3.4.1 Direct Optimization Issue . . . 29
3.4.2 Categorization of algorithms . . . 30
3.4.3 Loss functions . . . 31
3.4.3.1 Loss functions for point-wise methods . . . 31
3.4.3.2 Loss functions for pair-wise methods . . . 31
3.4.3.3 Loss functions for list-wise methods . . . 32
3.4.4 Point-wise approach . . . 32 3.4.4.1 PRank . . . 33 3.4.4.2 McRank . . . 33 3.4.4.3 Random Forest . . . 33 3.4.4.4 MART . . . 33 3.4.4.5 RC-Rank . . . 34 3.4.5 Pair-wise approach . . . 34 3.4.5.1 RankNet . . . 34 3.4.5.2 RankBoost . . . 35 3.4.5.3 RankSVM . . . 35 3.4.6 List-wise approach . . . 36 3.4.6.1 AdaRank . . . 36 3.4.6.2 Coordinate Ascent . . . 38 3.4.6.3 PermuRank . . . 38 3.4.6.4 SV Mmap . . . 39 3.4.6.5 ListMLE . . . 39 3.4.6.6 ListNet . . . 40 3.4.6.7 RankCosine . . . 41 3.4.6.8 LambdaRank . . . 41 3.4.6.9 LambdaMART . . . 42 3.4.7 Combining rankers . . . 43 3.5 Public Contests . . . 44
3.5.1 Expedia Hotel Searches . . . 44
3.5.2 Summary . . . 46
4 Implementation 47 4.1 Own implementation of LambdaMART algorithm . . . 47
4.1.1 Python and NumPy . . . 48
4.1.2 RankPy . . . 48
5 Experiments 53 5.1 General setting . . . 53
5.1.1 Implementation of LTR algorithms . . . 53
CONTENTS xv
5.2 Comparison of the algorithms . . . 54
5.2.1 Experiment setting . . . 54
5.2.2 Experiments' details and results . . . 55
5.2.2.1 Comparison using MSLR10k dataset . . . 55
5.2.2.2 Comparison using Seznam.cz dataset . . . 56
5.2.2.3 Comparison using LETOR 4.0 dataset . . . 57
5.2.2.4 Comparison using WCL2R dataset . . . 58
5.2.3 Summary . . . 59
5.3 Time eciency of the algorithms . . . 59
5.3.1 Experiment setting . . . 60
5.3.2 Experiment results . . . 60
5.4 Overtting analysis of LambdaMART algorithm . . . 61
5.4.1 Experiment setting . . . 61
5.4.2 Experiment results . . . 62
5.5 Dataset size analysis . . . 63
5.5.1 Analysis using dierent datasets . . . 63
5.5.1.1 Experiment setting . . . 63
5.5.1.2 Experiment results . . . 64
5.5.2 Analysis using dierent algorithms . . . 65
5.5.2.1 Experiment setting . . . 65
5.5.2.2 Experiment results . . . 65
5.6 Relevance label noise sensitivity . . . 66
5.6.1 Experiment setting . . . 67
5.6.1.1 Experiment results . . . 67
5.7 LambdaMART - parameter search . . . 68
5.7.1 Experiment setting . . . 68
5.7.1.1 Experiment results . . . 69
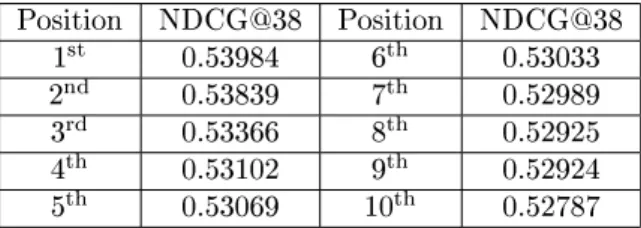
5.8 LambdaMART - ERR@k cut-o position analysis . . . 70
5.8.1 Experiment setting . . . 70
5.8.1.1 Experiment results . . . 70
6 Conclusions 73 A List of Abbreviations 79 B Contents of CD and Instructions 81 B.1 Setup of the environment . . . 81
B.2 Contents of CD . . . 81
List of Figures
2.1 Search engine system schemes . . . 8
3.1 Scheme of Learning to Rank problem . . . 12
3.2 Scheme of the general data structure . . . 13
3.3 Learning curves of LambdaMART for 3 dierent tree depths . . . 26
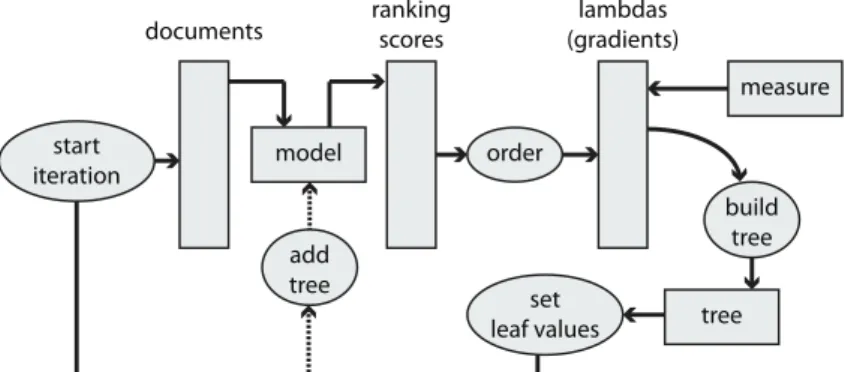
3.4 LambdaMART algorithm scheme . . . 43
4.1 Relevance labels of documents evolving in time . . . 50
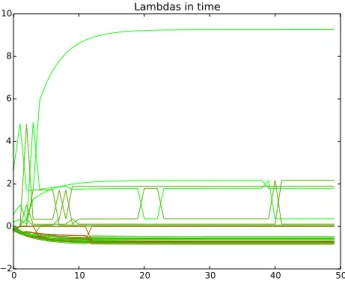
4.2 Lambdas of documents evolving in time . . . 50
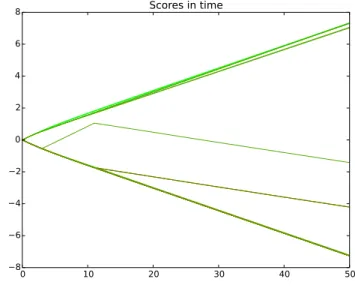
4.3 Ranking scores labels of documents evolving in time . . . 51
5.1 Overtting curves - example . . . 61
5.2 Learning curves of LambdaMART for 3 dierent tree depths . . . 62
5.3 Performance of LambdaMART algorithm based on trainset size . . . 64
5.4 Performance of LambdaMART algorithm based on the size of the training set. Comparison of various algorithms. . . 65
5.5 Comparison of LambdaMART and MART models based on the amount of noise in relevance labels . . . 66
5.6 Performance loss based on noise in relevance labels . . . 66
5.7 LambdaMART - Parameter search - overall . . . 68 5.8 LambdaMART - Parameter search - detail of learning rate and number of leaves 69
List of Tables
3.1 Dataset statistics . . . 18
3.2 Measure scores for lists consisting of multi-level relevance labels. . . 25
3.3 Measure scores for lists consisting of binary relevance labels. . . 25
3.4 Correlation matrices of performance measures . . . 26
3.5 Comparison of performance scores of NDCG, ERR and SR . . . 27
3.6 Final leaderboard of Expedia Hotel Searches challenge . . . 45
5.1 Performance of RankLib algorithms and RC-Rank on MSLR10k dataset . . . 56
5.2 Performance of RankLib algorithms and RC-Rank on Seznam.cz's dataset . . 57
5.3 Performance of RankLib algorithms and RC-Rank on LETOR 4.0 . . . 58
5.4 Performance of RankLib algorithms and RC-Rank on WCL2R dataset . . . . 59
5.5 Execution time of training . . . 60
5.6 Execution time of testing . . . 61
5.7 Performance based on cut-o position . . . 71
Chapter 1
Introduction
In the recent decades and especially in the last few years, we have experienced a rapid growth of information and knowledge and a consequent growth of the need for an ecient retrieval
of relevant information. According to a study prepared by IDC1 [22], only in 15 years, from
2005 to 2020, the digital universe will grow by a factor of 300 - from 130 exabytes to 40,000
exabytes2 of which 33% will contain potentially valuable information.
It may not be fully obvious but ranking (sometimes called sorting or ordering) is tightly related to Information Retrieval. Sorting is a very natural process which seems to be simple when the set of objects to be sorted is not too large and, this is the main point, when you know how to sort it. Back in the ages, it was possible to manually determine the order of a set of objects. As the amount of information grew, several years ago, it would not be possible to do it manually, but it would be sucient to nd an easy key or dependency among the objects and determine what key will be used for the sorting. And nally, in the recent years, the amount of information and data is so vast, that even the dependencies and the sorting key are sometimes unknown. The only thing that left is the ability to recognize what we nd being good (relevant) and what we consider being bad (irrelevant).
Issues emerge when the both aforementioned, ranking and information retrieval, is com-bined. When a relevant information is to be retrieved from a big amount of data and no dependencies, sorting keys nor ranking models are known. A typical example of wide-known Information Retrieval problem is search engine results retrieval and ranking in the Internet. Besides search engines, there are many other examples, such as recommendation systems, on-line advertising, misspelling correction, collaborative ltering etc., that involves ranking in a core of their solution.
To successfully solve the given problem, machine learning methods have to be applied. Learning to Rank (LTR) is a problem that can be solved by the means of supervised machine learning methods that can be eectively applied to solve the task of creating a ranking model. Given a set of queries, where each of the queries contains a list of documents and a list of relevance labels determining how relevant a document is with respect to a particular query, Learning to Rank methods construct a ranking model. The ranking model can be then used
1International Data Corporation
21 exabyte = 1 billion gigabytes =1018bytes
2 CHAPTER 1. INTRODUCTION to score and rank a new set of documents with unknown relevance labels. The performance of the model is evaluated using a chosen performance measure.
On one hand, there is no doubt that without Learning to Rank methods, the Internet could not work as it works today and also many companies could not exist or their revenue would be much lower - without ecient recommendation systems or relevant search results in their applications. On the other hand, since LTR is a hot rapidly evolving topic, there is still a lot of space for further improvements. Although, many researchers work and publish on this topic, the best known methods are usually partially covered by secrets. The big companies, such as Microsoft, Yahoo, Google or Yandex, who are the leaders of the research do not uncover all the know-how (which is understandable). Moreover, there is a lot of various methods in LTR, but to the best of our knowledge, there is no work thoroughly comparing available means and algorithms. Most papers usually compare new algorithms only with the old ones and therefore a comparative analysis is missing.
The subject of this thesis is Learning to Rank algorithms. The work aims on performing a thorough analysis of Learning to Rank topic. It involves the following points:
• Introduction of general framework for Learning to Rank problem in Information
Re-trieval
• Thorough comparative analysis of available LTR algorithms, their categorization and
explanation of the dierences among the categories
• Analysis of applicable performance measures adequate for the task and a description
of possible approaches to the optimization
• Discovering available datasets and performing their analysis and comparison, providing
also the statistics of the datasets. Also giving an explanation of feature vectors and how it the discriminative power can be determined
• Own implementation of an algorithm
• Experimenting using dierent algorithms, measures and datasets and its evaluation.
• Proposal of potential improvements
Apart from publicly accessible algorithms and datasets, we were also provided by a dataset and an algorithm from Seznam.cz company which allows us to extend our experiments and analysis with the comparison to commercially used means.
The work is structured as follows. Chapter 2.1 describes the background of the task. First, it explains what is Information Retrieval and why it is important and then it provides an abstract description of Learning to Rank. This chapter also involves the best known application of LTR and then a brief description of the company Seznam.cz that co-operated with us by providing a dataset and an algorithm which will be both described in the following chapters.
Chapter 3 focuses on Learning to Rank, especially from the theoretic point of view. Sec. 3.1 introduces a general framework for LTR task, Sec. 3.2 will list and describe available datasets, Sec. 3.3 will compare and examine applicable performance measures and nally, a thorough description of state-of-the-art algorithms for LTR will be provided in Section 3.4.
3 Chapter 4 proposes our own implementation of LambdaMART algorithm that was con-sidered being the potentially best algorithm. The implementation is compared to the existing implementation and the advantages of our implementation are introduced.
The knowledge obtained in the previous chapters will be veried in Chapter 5, where several experiments will be presented with their results that were sometimes as expected and sometimes surprising (e.g. an inuence of a noise on the performance of a ranking model).
Finally, the thesis will be concluded in Chapter 6 where the ndings and the results of the work will be sumarized.
Chapter 2
Background
Information Retrieval(IR) and Learning to Rank(LTR) are two main topics accompanying us throughout this work. In this Chapter, an abstract description of both will be given. In the rst section, you will be provided with the history, the purpose and the basic problem explanation of Information Retrieval, followed by a Section 2.2 clarifying the meaning of Learning to Rank in relation to IR. As will be explained in the following sections, Information Retrieval in this work is presented in relation to search engines. Therefore the subject of Section 2.3 will focus on Search engines and simplied schemes of their processes will be shown. Since this work was created in cooperation with Seznam.cz company, the nal Section 2.4 will introduce Seznam.cz and explain the support of the company.
2.1 Information Retrieval
Information Retrieval (IR) is a process of locating and obtaining information that is needed by a user. Generally said, IR helps satisfying a desire for a relevant information resource from a collection of available information resources. [15] The activity of information retrieval involves many subprocesses - it starts when the user identies his need for information, then it involves searching and locating of an information resource and it ends when the information is retrieved and delivered to the user in a demanded form and the information need of the user is eventually satised.
Expectedly, Information Retrieval as such is a very old problem. The rst notes about IR could be found even in 2000 B.C. when the Sumerians created a literary catalogue to
list all their current literature. The rst book indexes1 appeared in a primitive form in
the 16th century. Later on, in the 18th century, the book indexes became similar to to-day's form. Obviously, the rst Information Retrieval `systems' facilitated the search for information contained in books. IR techniques were applied mainly in libraries (and similar institutions). [18]
With the modern era of the printing (and eventually the era of digital technologies), there is a rapid increase of amount of information and data being stored. In 1944, Fremont Rider calculated that libraries will double its capacity every 16 years. [37] And note that the
1a list of useful phrases in the book
6 CHAPTER 2. BACKGROUND calculation is rather old and that the speed of growth is probably much higher nowadays. The vast amount of information resources, which is still increasing, makes it also really dicult to nd the resource that fully satises your need. Therefore, there was a demand for a solution to the problem of the endless growth of resources. And the solution was Automated Information Retrieval systems.
To point out the growth of the amount of digital data, a few interesting facts are provided.
According to a study prepared by IDC2 [22]:
• From 2005 to 2020, the digital universe will grow by a factor of 300 - from 130 exabytes
to 40,000 exabytes.
• IDC estimates that by 2020, as much as 33% of the digital universe will contain
infor-mation that might be valuable if analyzed (compared with 25% today).
Automated IR systems were originally developed in the 1940s, in order to manage the scientic literature that was produced during the past decades and to reduce what was called `information retrieval'. The systems were mainly utilized by libraries and universities. [39] However, with the rise of computer science automated IR has become its important subeld. Nowadays, the modern IR deals with data storage, analysis and retrieval of documents, algorithms etc. [18]
The modern IR works as follows. An information need of the user is dened by a query which is entered to the system (e.g. a search query in a web search engine). Since the query is not a unique identier of any of the resources, it is likely that the query would match more than only one resource. Moreover, each of the matched resources can show dierent degree of relevancy with respect to the given query. To nd relevant resources and to retrieve them in a convenient order is the purpose of an IR model (or of an IR algorithm). In other words, given a query and a set of documents with dierent levels of relevance, nd the appropriate ranking of the given candidates according to their relatedness. The model that ranks the documents is one of the essential parts of automated IR system and Learning to Rank is one of the elds that provides techniques and algorithms that are capable of computing of such a ranking model.
Generally, IR models can be divided into a few categories. Set-theoretic models, algebraic models, probabilistic models and based retrieval models. The category of feature-based retrieval models is also the case of models learned by Learning to Rank algorithms.
Shortly, most IR systems based on feature-based retrieval models usually evaluate docu-ments (or information resources) with a score specifying a relevancy of the docudocu-ments to a given query. Then the documents are ranked according to the values of the score. The user is then provided only with the top scored documents. The process can be also reiterated, e.g. when the user decides to rene the query.
The interconnection between IR and LTR will be further claried in the following section which focuses on Learning to Rank.
2.2. LEARNING TO RANK 7
2.2 Learning to Rank
At it was noted in the previous section, Learning to Rank (LTR) is one of the methods that can be eectively applied to solve the task of creating a ranking model in Information Retrieval. It helps solving IR problems such as document retrieval, collaborative ltering, sentiment analysis, computational advertising etc. LTR method aims at learning a model that given a query and a set of candidate documents nds the appropriate ranking of docu-ments according to their relevancy.
Nowadays, Learning to Rank (LTR) problem, and Information Retrieval in general, are one of the hottest topics in the elds of Machine Learning and Computer Science. The high interest emerged in the recent years especially because we are experiencing a rapid growth of the usage of digital technologies and the Internet. The amount of available data and information is growing, as well as the desire to eciently use the collected data to create a new product, to increase the satisfaction of users and eventually to utilize data to increase the revenue ([23] predicted 2013 worldwide IT spending to exceed $2.1 trillion).
The problem is to rank any set of items according to its relevance (or any other ranking measure), therefore it can be used to order results of a web search engine, a recommendation system or an online advertising system. Above mentioned is the proof of the importance and the potential of the research in the elds of Learning to Rank and other problems related to Information Retrieval.
Learning to Rank is a supervised machine learning method. Given a training dataset of queries, documents and evaluations of how relevant the documents are, a LTR algorithm constructs a ranking model. The ranking model is then usually used to assign ranking scores to a new set of documents with unknown relevance. The ranking scores are nally used to order the given documents. The evaluation of the model's performance can be accomplished by a chosen performance measure.
Detailed information on the architecture of Learning to rank methods, the problem de-nition, the formal framework and descriptions of data, algorithms and performance measures will be given in a self-standing Chapter 3. In the next section, the position and the usage of ranking models in the real-world problems, such as the web searching, will be pointed out.
2.3 Search Engines
As the web searching is one of the essential Internet activities which is known to all Internet users and it is the case which is used in the research literature most often, we decided to focus on Learning to Rank in the context of Information Retrieval in the web search. We believe that all the results of the analysis and the experiments which were performed (in the following chapters) are also applicable in other elds using Information Retrieval.
In order to point out the purpose and the position of Information Retrieval and especially of Learning to Rank, in search engines, a brief simplied description of a search engine is provided.
A search engine is a complex system composed of many components and processes. [40] One process is the indexing and crawling of Internet resources. Crawlers (sometimes called spiders) search throughout the Internet and analyze and store documents, web pages, pictures
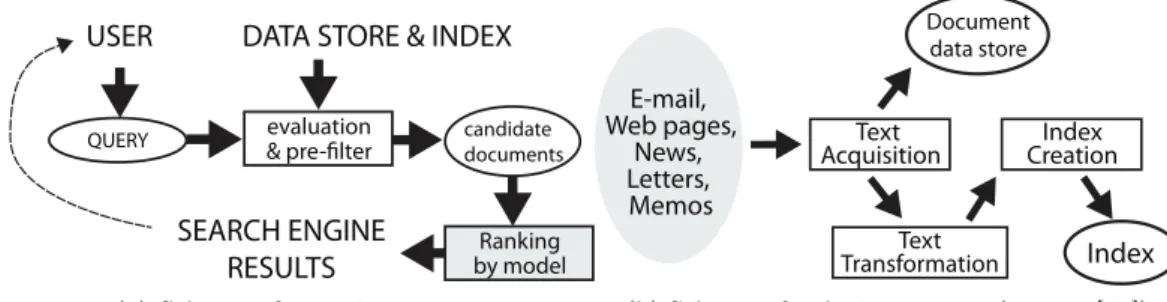
8 CHAPTER 2. BACKGROUND and other medias they come across. When the data, that were gathered by crawlers, are analyzed, stored and indexed, a part of the data (previously annotated with relevance labels) is utilized for the creation of Learning to Rank model. The second important process is an interaction with a user. The user enters a search query which is rst analyzed and evaluated by the system, e.g. misspelling correction is suggested to the user. Then the system retrieves a set of candidate documents relevant to the query. The LTR model evaluates and ranks the candidate documents by relevance scores and then the nal search engine result page (SERP) with the documents order by the relevance is returned. A simplied schemes of both processes are given in Fig. 2.1. While Fig. 2.1a demonstrates the process of user interaction and emphasizes the position of LTR model, Fig. 2.1b presents the indexing process.[40]
QUERY
USER
evaluation
& pre-filter candidatedocuments
DATA STORE & INDEX
Ranking by model SEARCH ENGINE
RESULTS
(a) Scheme of querying process
Text Acquisition Text Transformation Index Creation Document data store Index E-mail, Web pages, News, Letters, Memos
(b) Scheme of indexing process (source: [40])
Figure 2.1: Search engine system schemes
To apply Learning to Rank methods to a web search, is not as simple as it might seem to be. Besides standard machine learning issues as dataset handling, parameter search etc., there are some issues specic for the web search and the users' behavior. Some of the issues will be presented in the following sections. An algorithm's `quality' evaluation is one of the issues. This is the issue of the choice of appropriate performance measure. It is challenging to compare and to evaluate various orderings (permutations) of a list of documents - for example, the decision whether the ranking with an irrelevant document at the third position
is better than the ranking with two irrelevant document at the 9th and the 10th position.
Then it depends on the approach and the particular usage.
Also the user's need and the reason for searching can be very diverse. The user's need can be classied as informational, navigational, and transactional. The rst, informational query, may range from simple factoid questions such as `What is the color of a frog?' to complex ones. The navigational query can help you to nd particular web pages on the web. And nally transactional queries can represent a user's wish to accomplish some action on the web, such as the `Tax Form download'.[3] While dealing with Learning to Rank methods, it is important to keep the aforementioned issues in mind.
The last section of this chapter is dedicated to Seznam.cz company. Section 2.4 con-tains an introduction of the company and also the ways how they supported this work are mentioned.
2.4. SEZNAM.CZ 9
2.4 Seznam.cz
There are several publicly available datasets and there are also benchmark results provided for the datasets. But we can nd a few issues related to the publicly available datasets. There are datasets that are based on real data but the feature vectors were recalculated according to feature sets that are commonly used in the research community, or there are datasets that were created just for the research purposes, or there are datasets that are rather old (i.e. 10 years and more). In all the cases, the datasets are usually far from the current reality.
The other issue is that only the algorithms that are known to the research community are benchmarked and their results published. It is dicult (or almost impossible) to compare the state-of-the-art algorithms (known in the research) to the algorithms that are used in real search engines and nd out how far the research is from the reality.
To overcome the aforementioned issues, we got a support from Seznam.cz company. The main thing is that they provided us with their dataset, their algorithm and the basic expla-nation of how their algorithm works. Thanks to their support, it was possible to compare state-of-the-art algorithms to their RC-Rank algorithm and to analyze the performance of the algorithms on a real-world dataset.
Seznam.cz is a Czech company running a web portal www.seznam.cz. The web portal has over 20 servers of dierent focus - a search engine, community servers, maps, news, on-line TV, on-line catalogues, advertising, games, dating etc. Since the company was founded in 1996, they have provided a full-text search service which is the most interesting part of their business because of the nature of the topic of this work.
Seznam.cz is also one of a few search engines in the world which are adequate regional
competitors for Google Search engine3. There was an analysis performed4 which analyzed
Google Search5 and Seznam.cz search engine. The analysis conrmed the aforementioned.
The usage of both engines is almost equal. Google Search held a slightly bigger share on the market though. Moreover, there was an increasing trend of Google's share. But please note, that both analysis are at least 2 years old and the shares could have changed and that the analysis concerned only Search engines and did not reect any other services.
The next chapter concentrates on Learning to Rank in detail. Many issues related to LTR will be addressed. Chapter 3 includes sections about a general framework for Learning to Rank, LTR algorithms description and also commonly used LTR performance measures and publicly available datasets will be listed.
3According to an older article at [30], besides Seznam.cz, those are Baidu (China), Naver (South Korea), Yahoo Japan (Japan) and Yandex (Russia).
4The analysis was published by Eectix (http://www.eectix.com) at the beginning of 2013.[17] 5http://search.google.com
Chapter 3
Learning to Rank
This chapter provides detailed information on Learning to Rank. First, in Section 3.1, the general framework for LTR will be provided. The next section will oer description of the data format and provide a list of available datasets and the statistics. Section 3.3 examines the ways how models' performance can be compared and measured. The basic performance measures will be named and the main characteristics will be pointed out and analyzed. The last section of this chapter nally categorizes and lists LTR algorithms.
3.1 General Framework
Learning to rank process can be described as follows. A training sample is typically a query-document pair. The necessity for using the query-document pairs as the training samples comes from the fact, that many features are based on the relation between query and document. Such query-related feature could be, for example, whether the document contains the query expression. The training sample consists of feature values and a relevance label. The relevance labels have been manually assessed by expert annotators. Training samples with relevance labels (with respect to a given query), a particular evaluation measure and eventually a validation dataset come as an input to the LTR algorithm. The algorithm uses the training dataset to construct a model which is then used to sort a set of testing samples and the ranking performance of the model is then evaluated by given performance measure. The aim of the learning is generally minimization of a loss function, or eventually maximization of a training performance measure. The formal description of the process is proposed in the following paragraphs and the description of the data is given in Section 3.2.
3.1.1 Problem description
In the training phase of LTR, a set of queries Q = {q1, q2, . . . , qn}, where n denotes the
number of queries, is given. There is a set of documentsdi={di1, d2i, . . . , dim(qi)} associated
with each of the queries qi. Then there is a list of labels yi ={y1i, y2i, . . . , ymi (qi)} provided
together with the documentsdi, wherem(qi)is the number of documents given for the query
qi. yji denotes the label of thejth documentdij of theith queryqi. A feature vector~xij ∈X
12 CHAPTER 3. LEARNING TO RANK
training phase testing phase
model ranking labels
labels + training algorithm testing dataset training performance measure testing performance measure training dataset evaluation
Figure 3.1: Scheme of Learning to Rank problem
is specied for each query-document pair(qi, dij),i= 1,2, . . . , n;j= 1,2, . . . , m(qi). Finally,
we can dene training dataset as a set
Strain ={(qi,di,yi)}ni=1. (3.1)
The objective of the learning process is to construct a model optimizing the given objective function. The objective function can dier, depending on the particular approach. The measures and the approaches will be described in detail in Sec. 3.3 and Sec. 3.4. Typically,
the model is then a function mapping a training sample to a score value, i.e. f : X → R.
When using the model for ranking (e.g. in testing phase) all the query-document pairs
(qi, dij) in the list of documents of queryqi are evaluated and have their score assigned. The
list is then ordered according to the score in the descending order.
A permutation πi(di, f) of integers is created based on a document list di and a model
functionf(~xij)∈R. The permutation represents a ranked list in this case. The notationπi(j)
denotes the position of the documentdij in the ordering based on the specied permutation.
There are three inputs to the testing phase of the LTR problem. Those are a ranking model, a testing dataset and a performance measure. Once the ranking model (i.e. function
f(~xij)∈Rin our case) has been trained, it can be used to rank elements of document lists for
each single query in the testing dataset. Finally, we evaluate the performance of the model using the given measure.
See Fig. 3.1 for the basic scheme of Learning to Rank process. A brief description follows. Using a training set and relevance labels the algorithm is initiated. The algorithm runs through several iterations and optimizes given training performance measure. Once the model is constructed, it can be used for ranking of a new dataset. The labels in the testing phase are necessary only in the case, when the model's performance evaluation is desired. The labels are not necessary for the process of ranking. When the test dataset is ranked, the known relevance labels of the data samples are used, and the performance of the model is evaluated by the means of a chosen testing performance measure. Clearly, this is only a general description of the architecture of training and testing phase of LTR. Deviations can appear.
3.2. DATA 13
dataset
query q query q query q query q query q...
...
1 i-1 i i+1 n document d document d document d document d document d...
...
1 j-1 j j j+1 m(q ) i document dji i i i i i i=
y
qid
feature vector
relevance label query ID feature values definition
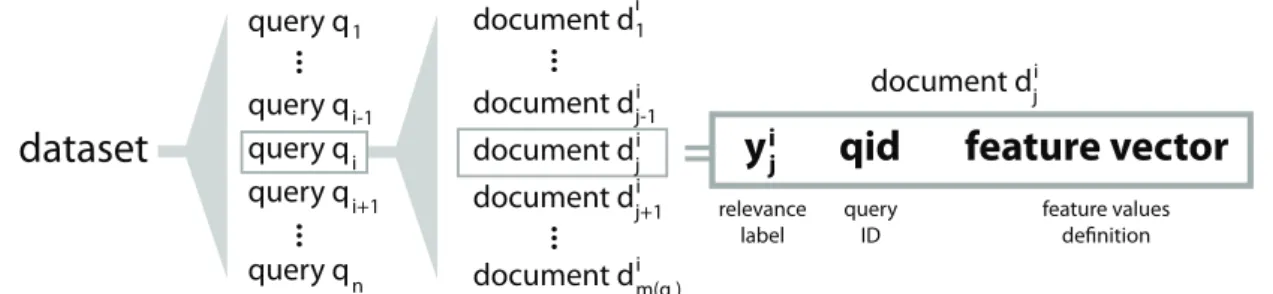
Figure 3.2: Scheme of the general data structure - Description: The dataset contains n
queries. Each of the queries involves m(qi) documents in the list. Each document dij is
dened by a relevance label yij, by a related query qi and by a list of feature values.
3.2 Data
To properly train and test a ranking model, it is necessary to use a dataset of a sucient quality and size. As small dataset can cause a lot of problems, e.g. increase the variance error as proven in [1]. It is quite dicult to get an access to a current and real-world dataset of a proper size, because usually only big companies can provide such datasets and they keep the datasets as their valuable treasures. However, time to time, there is a dataset release initiated by one of the big companies (e.g. Microsoft, Yahoo, Yandex) to support the research community or they provide datasets for various competitions. The available datasets will be listed and their statistics will be provided in Section 3.2.3. Fortunately, there is only one widely used format of datasets for LTR, which makes the work easier. The format will be described in the following paragraphs and is also presented in Fig. 3.2.
Each dataset consists of many query associated document lists. As a matter of fact, it means that the dataset consists of query-document pairs. Each of the document lists is associated with a dierent query and there is usually more than one document belonging to the document list of a particular query.
For more information and experiments analyzing the characteristics of data, see Chapter 5 on page 53.
3.2.1 Data le format
Each row in the data le corresponds to one of the query-document pairs. Each row is composed of three (optionally four) parts. In the given order, it is an integer or oat relevance
labelyij for the query-document pair(qi, dij), followed by a string in the format qid:queryid
specifying query of the pair (qi, dij), where queryid denotes an integer representing the
query (qid is a keyword that remains unchanged), e.g. qid:1382 or qid:913. Then there is a sequence specifying the feature vector. Optionally, the row can be nished by a hash tag and auxiliary information (e.g. document id, various pre-calculated numbers). Although, the format is generally simple, the denition of a feature vector is a tricky part and dierent dataset sources use dierent approaches.
14 CHAPTER 3. LEARNING TO RANK 3.2.1.1 Labels
First, a relevance label yji will be described. Since the methods, this paper is referring to,
are supervised, it is necessary to provide the algorithm with labels associated with particular
query-document pairs (qi, dij). The labels are usually either boolean values (i.e. zeros and
ones), or multi-level graded relevance evaluations (i.e. from zero up to the maximal relevance grade, which is usually number 4). In the most cases, the labels are assessed by professional assessors according to the document relevancy with respect to the given query. In the case of boolean labels, the mapping to a word representation is simple. Zero, resp. one, represents irrelevant, resp. relevant, document. In the case of multi-level relevance assessment, the mapping can dier, but generally the word representation of the labels
yji ∈Y;Y = (0,1,2,3,4)keeps a similar meaning and can be mapped to
G= (useless, slightly relevant, relevant, usef ul, perf ectly relevant).
However, there are also cases when the labels are slightly changed. WLC2R dataset has number 3 as a maximum relevance label, the maximum relevance label of LETOR 4.0 dataset is number 2 and the dataset provided by Seznam.cz contains number 5 as the maximum
relevance grade. When the set of labels is extended to Y = (0,1,2,3,4,5)which is the case
of Seznam.cz dataset then it can be mapped to
G= (unlabeled, of f topic, irrelevant, relevant, usef ul, vital).
3.2.1.2 Feature vector
In the dataset le, a feature vector is specied by feature IDs and values in a given form of fid:value (e.g. 3:0.5621), having all the features separated by a space character. What can be handled in a dierent manner is the handling of undened values. As 0.0 value really means the value, it cannot be used for assigning undened value. Usually, this issue is solved by leaving out the feature. Thus 1:0.5 3:0.5621 means that the feature with id 2 is undened for the particular document.
There are two main approaches to the data denition. First, the feature denition in-cludes all the ids and undened value is substituted by a special value or zero. Therefore, all the feature vectors are of the same length. Second approach is then leaving out undened values and dening feature vectors of dierent lengths.
3.2.1.3 File
Data are typically specied in a text le, formated in a commonly used libSVM (sometimes
referred also as svmlight) format (originating in LIBSVM1[9] and svmlight libraries2). The
denition of a data row follows.
relevance qid:query_id fid:value ... fid:value # auxiliary
To make it clear, there is also one simple example of a few data rows (leaving out undened values) provided:
1http://www.csie.ntu.edu.tw/ cjlin/libsvm/ 2http://svmlight.joachims.org/
3.2. DATA 15 3 qid:19876 1:0.421 2:1.0 3:0.3123 4:11.4 # doc1 1 qid:19876 1:1.312 2:0.01 4:15.0 5:0.0 # doc2 4 qid:19876 1:0.0 2:0.31 4:7.41 # doc3 2 qid:1321 2:0.0 3:0.0 4:10.213 5:0.1 # doc4 0 qid:1321 1:0.023 2:0.413 3:0.792 4:3.45 # doc5 4 qid:1321 1:0.312 2:1.0 3:0.870 4:21.234 # doc6
Since all publicly accessible data are thoroughly anonymised, all the queries, document names and feature names are obviously substituted by ids without particular relation to a real object. Therefore, it is hard (or almost impossible) to search for any interconnection among documents or queries.
3.2.2 Features
As already mentioned, the datasets are usually released by the big companies because there are not many other (and maybe none) subjects who could provide a dataset of a similar size. Although, the datasets are publicly available, all additional information is anonymised. It means that we do not know expressions in queries, we do not know where documents come from or even what the labels of features are. We initially intended to analyze dataset provided by Seznam.cz and perform an analysis of features, their discriminative power and suggest possible improvements, such which other features could be used in the dataset. Finally, it was not possible to perform the analysis because the Seznam.cz dataset was anonymized as well, and the feature labels and their meanings, relations and dependencies were unknown to us. From this point of view, the analysis of features with no labels would not bring any benet.
However, to provide a better insight how could we perform such an analysis, there are two ways how to analyze the signicance of features.
• Analyze one feature after another and measure how the feature can discriminate the
samples in the dataset. Using calculations of expected information gain or the possible reduction in the entropy achieved by learning the state of feature.
• To nd a single well-discriminating feature is not always enough. Since there can be
subsets of features with bigger discriminative power than only one particular feature can provide, it is necessary to use a more sophisticated methods. One of the possibilities is to utilize a decision tree or a whole forest that have been built above the dataset. The decision tree can be then used to analyze the features and the subsets of features and their discriminative power.
3.2.3 Available datasets
Learning to Rank is a hot topic nowadays. Therefore, there is a high demand for big datasets. However, only big corporations are able to create datasets of sucient size. It can be tricky to nd a sucient high-quality dataset because big datasets are not usually publicly released. Usually, the datasets are released by one of the biggest corporations as Google, Microsoft, Yahoo or Yandex to support the research or their public learning to rank contests. Though, due to the security reasons the datasets are anonymised.
16 CHAPTER 3. LEARNING TO RANK In the following sections, a few sources of useful datasets of higher quality will be de-scribed. Statistics, brief descriptions and comments will be provided in Table 3.1 on page 18. 3.2.3.1 LETOR
LETOR3 is a benchmark collection for research on learning to rank for information
re-trieval managed by Microsoft Research group. Besides meta-data, sitemaps, link graphs etc., LETOR contains a set of datasets that can be used for Learning-to-rank task. Baseline algorithms' description, benchmark performances, features descriptions, data partitioning (train, test and validation sets) and evaluation tools are also provided. Basically, LETOR contains 2 main datasets. The rst one LETOR 3.0 was created based on the previous releases composed from .gov data collection and OHSUMED data collection. The set is altogether containing 6 datasets. The second, LETOR 4.0 was composed from Gov2 web page collection and two query sets from Million Query track of TREC 2007 and TREC2008. 3.2.3.2 Microsoft Learning to Rank datasets
Two datasets, MSLR-WEB30K and MSLR-WEB10K4, for research on LTR which were
released by Microsoft. The datasets consists of query-document pairs saved in a usual data format as mentioned above. The relevance evaluations were acquired from a commercial web search engine Microsoft Bing retired labeling. Range of values goes from 0 - irrelevant to 4 - perfectly relevant. The feature vector was created on the basis of a commonly known set of features widely used in the research community.
3.2.3.3 Yahoo! Learning to Rank Challenge Datasets
In 2010, Yahoo! Labs organized a learning to rank contest. For this occasion, they also
released two datasets5. The datasets originates from a web search ranking which was used
to train a ranking function. However, no feature labelings, explanations or descriptions are provided for neither urls, queries nor features. It is due to the fact that Yahoo! was worrying about a reverse engineering. Yahoo! provided two dierent datasets - each corresponding to a search log from a dierent country. Both datasets are related, but also dierent to some extent. This dataset is again provided in partitioned form.
3.2.3.4 Yandex Internet Mathematics 2009 contest
Yandex.ru search engine company released a dataset6 for the purpose of Internet
Mathemat-ics 2009 contest. The datasets contains a tables providing query-document pairs and cor-responding feature vectors and assessed relevance judgements. Documents, original queries and labelings of the features are not known for obvious security reasons. However, Yandex claimed that there are TF*IDF, PageRank or query length features involved. The data are said to be real, as they were used to learn the ranking function in Yandex.
3http://research.microsoft.com/en-us/um/beijing/projects/letor// 4http://research.microsoft.com/en-us/projects/mslr/
5http://webscope.sandbox.yahoo.com/ 6http://imat2009.yandex.ru/en/datasets
3.2. DATA 17 3.2.3.5 WCL2R
WCL2R7 is a benchmark collection for LTR to be used preferably for research with
Click-through Data. Chilean Learning to rank dataset created based on TodoCL search engine. Data were crawled in 2003 and 2004. Dierently from LETOR or Yahoo dataset, WCL2R is mainly based on clickthrough features. The description of all the features is provided -especially of those synthesized from clickthrough data.
3.2.3.6 Seznam.cz dataset
For the purpose of this work, we were provided with a dataset8 created by Seznam.cz
com-pany. The dataset was collected using their commercial web search engine. Seznam's
rele-vance judgements are mapped fromY = (0,1,2,3,4,5)to
G= (unlabeled, of f topic, irrelevant, relevant, usef ul, vital).
Although, it means that there is one more grade dened in comparison to other datasets (i.e.
y= 0 which is mapped tog=unlabeled), there is no document marked asunlabeledin this
particular dataset. There is no undened value in the feature vectors, either. Therefore 0.0
means zero, not undened.
3.2.4 Dataset statistics
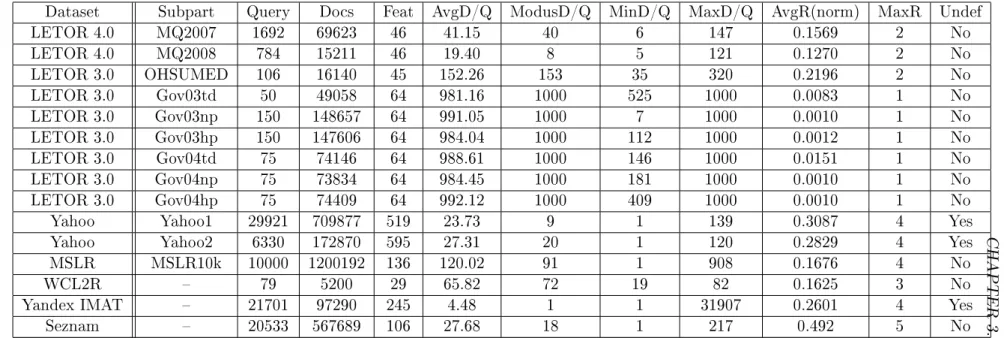
Previously listed datasets were analyzed and compared in our experiments. The statistics are provided in Tab. 3.1 (page 18). The table consists of several columns. The description of the columns follows:
• Dataset Name of the dataset
• Subpart Name of the subpart of the dataset
• Query Number of queries
• Docs Number of query-document pairs • Feat Number of unique features
• AvgD/Q Average number of documents per query
• ModusD/Q Most frequent number of docs per query
• MinD/Q Minimal number of docs per query • MaxD/Q Maximal number of docs per query • AvgR(norm) Mean relevance grade
(nor-malized to<0; 1>range)
• MaxR Maximal relevance grade
• Undef Yes, if the dataset contains unde-ned feature values, otherwise No
7http://www.latin.dcc.ufmg.br/collections/wcl2r/ 8Not publicly accessible
18 CHAPTER 3. LEARNING TO RANK
Dataset Subpart Query Docs Feat AvgD/Q ModusD/Q MinD/Q MaxD/Q AvgR(norm) MaxR Undef
LETOR 4.0 MQ2007 1692 69623 46 41.15 40 6 147 0.1569 2 No LETOR 4.0 MQ2008 784 15211 46 19.40 8 5 121 0.1270 2 No LETOR 3.0 OHSUMED 106 16140 45 152.26 153 35 320 0.2196 2 No LETOR 3.0 Gov03td 50 49058 64 981.16 1000 525 1000 0.0083 1 No LETOR 3.0 Gov03np 150 148657 64 991.05 1000 7 1000 0.0010 1 No LETOR 3.0 Gov03hp 150 147606 64 984.04 1000 112 1000 0.0012 1 No LETOR 3.0 Gov04td 75 74146 64 988.61 1000 146 1000 0.0151 1 No LETOR 3.0 Gov04np 75 73834 64 984.45 1000 181 1000 0.0010 1 No LETOR 3.0 Gov04hp 75 74409 64 992.12 1000 409 1000 0.0010 1 No
Yahoo Yahoo1 29921 709877 519 23.73 9 1 139 0.3087 4 Yes
Yahoo Yahoo2 6330 172870 595 27.31 20 1 120 0.2829 4 Yes
MSLR MSLR10k 10000 1200192 136 120.02 91 1 908 0.1676 4 No
WCL2R 79 5200 29 65.82 72 19 82 0.1625 3 No
Yandex IMAT 21701 97290 245 4.48 1 1 31907 0.2601 4 Yes
Seznam 20533 567689 106 27.68 18 1 217 0.492 5 No
3.3. PERFORMANCE EVALUATION 19
3.3 Performance Evaluation
Similarly to other machine learning problems, it is necessary to decide how the performance of the nal model will be evaluated. In many machine learning methods, the objective function which is being optimized during a learning phase is the same as the nal measure evaluating
the resulting model. For example, MSE9 can be used in both cases, as an objective function
during the training of a regression model and when the performance of the resulting model is being evaluated.
Unfortunately, Learning to Rank is not the same case. Since a LTR performance measure involves sorting and it is non-smooth, it cannot be dierentiated and thus it is very chal-lenging to optimize the measure directly. Only a very few algorithms actually optimize the performance measure directly. Therefore, it is important to distinguish between an objective function and a performance measure in LTR. In the following sections, performance measures will be listed, described and analyzed. While the ways how to deal with the issues concerning `what to optimize' will be further addressed in Section 3.4 and mainly in Section 3.4.3.
3.3.1 Introduction to Performance Measures
It is important to note that the denitions of the measures are based on the data format, i.e. a set of lists of documents where a list of documents is always related to one of the queries. The measures are usually list-wise, therefore you use the measure to evaluate ranked lists one after the other and then the nal performance is obtained as an average of the values returned for each list. For more information about the data format and the general framework of LTR problem, see Section 3.2 and Section 3.1.
A few assumptions, used in the following text, were made. Given a ranked list (a
permu-tation) of documents πi = (d1, d2, d3),d1 is considered being the top ranked, the document
d2 is ranked as the second andd3 is ranked as the last. Moreover, the top ranked (at 1st
po-sition) document is assumed to be the most relevant document, while the bottom ranked (at
3rd position) document is assumed to be the least relevant. Thus, the higher the document
is ranked, the lower its index is. The length of the list πi depends on the particular dataset
and it can be arbitrarily long.
There are also cases in this work, when the list is represented only as a list of relevance
labels (grades) instead of a list of documents. Therefore, πi = (d1, d2, d3) can be also
represented by πi = (y1, y2, y3), where yj denotes a relevance label of document dj. Please
note, that the indexing of lists usually starts from 1 and not from 0. Also the expressions performance measure and evaluation measure can be used interchangeably with no change of the meaning. Actually, there are research papers ([27, 41]) using the term metric which we nd misleading, as the mathematical denition of metric is referring to a function of distance and the reader could be confused.
In the next sections, commonly used performance measures will be rst listed and de-scribed and then analyzed. Finally, a short summary will be provided.
20 CHAPTER 3. LEARNING TO RANK
3.3.2 Performance Measures
In this section, commonly used performance measures will be listed and the basic interac-tion models that are considered by some of the measures will be provided in the following paragraphs (as divided by [11]). Besides other measures, we can name MAP(Mean Average Precision) and NDCG (Normalized Discounted Cumulative Gain) among the most known measures. In the recent years, a new state-of-the-art measure has come up - Expected Re-ciprocal Rank (ERR), as well as p-found which is a measure used by Yandex web search
engine10.
Performance measures can be basically divided into two main categories. The rst cate-gory expect binary relevance labels (grades), i.e. the documents can be labeled only relevant or irrelevant. Measures in the second category can handle multi-level relevance labels (see Sec. 3.2.1.1 for more information on labels). For example, apart from MAP or WTA mea-sures which are the members of the rst category, NDCG and ERR from the second category can be used in the cases when the labels are graded by more relevance levels.
3.3.2.1 Basic User Interaction Models
The measures, that are used by the research community most frequently, are related to one of the following user interaction models. In order to properly evaluate the performance of the model, a few assumptions on a user's behavior has to be made. One of the issues is the approach to the users' perception of the importance of the documents on dierent positions of a ranked list. The questions can be put: `How important is it, having a relevant document as the top ranked element of the list?' and `How will change the performance when the relevant document moves from the top position to the second position?' Those questions try to be answered by the following performance measures and the following approaches.
Position model Position-based model assumes that user interacts (clicks) with the docu-ment (URL) in the list under two conditions: rst, it is relevant and second, it is examined, where the examination probability is dependent only on the position on the document in the ranked list (it is not inuenced by any other document in the list). It means that it is more likely that the rst document in the list will be clicked than the eleventh document
because the probability of examination is much lower at 11th position. The position model
is implemented, for example, by NDCG or MAP measures.
Cascade model The cascade model is an extension of the position model. Apart from
position model, the probability of interaction with the document di also depends on the
documents that have been ranked abovedi and the relevance grades of those documents. It
means that if there is a perfect match on the rst position of a retrieved list of documents, it's not fully important how relevant the document on the further positions are, because the needs of the user would be satised by the top ranked document and the probability of further examination is rapidly decreasing. On the other hand, if there are not really
10Yandex is Russian web search engine. As mentioned in Sec. 2.4, it is one of the regional search engines competing with Google Search.
3.3. PERFORMANCE EVALUATION 21 relevant results at the top of the list then the importance of the ranking on further positions is increasing.
According to recent research papers concerning LTR measures that are used in search engines[11], and information about Yandex's MatrixNet [24, 34, 35] , the quality of the ranking is not given only by an ordering and by a position of a document. The papers conrm the validity of cascade model. Cascade model is utilized, for example, by p-found, ERR and RBP.
3.3.2.2 Winner Takes All (WTA)
Very simple and clear evaluation measure is Winner Takes All (WTA) measure which is dened as follows.
W T A(f;D, Y) =
1 :the top document of the list is relevant
0 :the top document of the list is irrelevant
, where f is the ranking function,D is a set of documents andY is a set of relevance labels
corresponding to the documents in the setD. There are only two possible outcomes of WTA.
Either it is 1 or 0. The value depends only on the document that is ranked as the very rst document in the ranked list. If the rst document is relevant, the value of WTA is 1. It is 0, otherwise.
3.3.2.3 Precision
Precision (P) is another simple measure. It is a fraction of the retrieved documents that are labeled as relevant. This measure is not often used. As in our case, it is usable only in the cut-o version, i.e. P@k (see Sec. 3.3.2.10). Note that this precision diers from precision and accuracy that are dened in statistics.
Average Precision (AP) will be skipped as it is covered by Mean Average Precision (Sec. 3.3.2.4) in our case.
3.3.2.4 Mean Average Precision (MAP)
Mean Average Precision is a next representative of measures determined for only two-level relevance grades - irrelevant and relevant. It is based on Average Precision (AP). The actual
dierence is that MAP is modied for the use in multiple queries problems - M AP =
Pn
i APi/n(APi is Average Precision computed for query qi andnis the number of queries).
MAP can be dened as follows. [29]
M AP(f;D, Y) = 1 nrel X s:y(dπf(s))=1 P i≤sI{y(dπf(i)) = 1} s , (3.2)
where nrel is the number of documents labeled as relevant, I{·} is an indicator function
(returning 1 when the condition is fullled, 0 otherwise),dπf(s)denotes the document ranked
by the ranking functionf ass-th in the ranked list(permutation) πf andy(dj)is the integer
22 CHAPTER 3. LEARNING TO RANK 3.3.2.5 Normalized Discounted Cumulative Gain (NDCG)
Apart from MAP, NDCG measure [26] is based on a multi-graded relevance.
DCG(f;D, Y) =
m
X
i=1
G(y(dπf(i))))disc(i), (3.3)
whereGis a increasing function called the gain function,discis a decreasing function called
the position discount function, and πf is the resulting ranking list.
IDCG(f;D, Y) = max π m X i=1 G(y(dπf(i))))disc(i), (3.4) N DCG(f;D, Y) = DCG(f;D, Y) IDCG(f;D, Y), (3.5)
Mostly, the gain function G is set to G(z) = 2z−1 and discount function disc is set to
disc(z) = log 1
2(1+z) if z≤C, and disc(z) = 0 if z > C (C is a xed integer)..
3.3.2.6 Rank Biased Precision (RBP)
The measures dened above were applying only position model. RBP is a measure applying cascade model. The previous measures were missing one important part which could be very important especially for web search engines, i.e. assumptions on user behavior related to the preceding documents. RBP [33] is reecting the user browsing behavior and their persistence in looking through the ranked list. It means that less persistent user will look only through limited amount of elements in the list while more persistent user will thoroughly explore almost all the list. RBP, similarly to MAP, is also designed only for binary relevance labels. RBP is dened as follows, RBP(f;D, Y) = (1−p)× n X i=1 y(dπf(i))×p i−1, (3.6)
where y(dπf(i)) is a relevance grade of the document ranked at i-th position and p is a
persistence coecient of a user.
3.3.2.7 Expected Reciprocal Rank (ERR)
ERR is a state-of-the-art performance measure proposed by [11]. Similarly to RBP, ERR is also reecting cascade user behavior model which is the extension of position model. First,
we need to deneR as a mapping from relevance grades to probability of relevance. Ris a
subject of choice but in our case we will use the gain function that is usually used for DCG.
R(g) := 2
g−1
3.3. PERFORMANCE EVALUATION 23 ERR:= n X r=1 1 r r−1 Y i=1 (1−Ri)Rr. (3.8)
Unfortunately, a naive way how to compute ERR has the complexity of O(n2), but as
shown in [11] it can be easily adjusted to be computed in O(n).
3.3.2.8 Probability of User Satisfaction (p-found)
pF ound [35] is a measure designed by Yandex company which is similar to ERR measure
proposed by [11]. pF ound= n X r=1 (1−pBreak)r−1pRelr r−1 Y i=1 (1−pReli), (3.9)
where pBreak is a probability of abandonment at each position, pRel is a probability of
user satisfaction at a given position and pF ound meaning is explained as probability of an
answer to be found. This performance measure has not been used in any of the research works which have been examined. However, it is important to compare a measure used in the search engines industry to those being used in the research.
3.3.2.9 Seznam Rank (Seznam.cz)
The performance measure used by Seznam.cz company. From now on, it will be called
Sez-nam Rank and often abbreviated asSRin the following text. The measure takes into account
only the top 20 documents for each query, i.e. it is SR@20 by default. The performance
score for each query is given by following equation:
SR= min 1, 20 X k=1 wpos(k)·wrel(y dπf(k) ) ! , (3.10)
wherewpos(k) is the weight given by the position k (specifying that top document are
more important than bottom documents), ydπf(k)is a relevance grade of the document
ranked at thekth position andwrel(y) is the weight according to the relevance gradey. The
values given by (3.10) are summed over the top 20 documents and the lower value is saved
- either 1 or the result of the summation. The weightswpos andwrel are constants provided
by Seznam.cz in range <0.0; 1.0>.
SeznamRank4 (SR4) Please note, that SeznamRank is originally dened for the
rel-evance labels in the range < 1; 5 >. In contrast to SR, the other measures that allow
multi-level relevance grading also involve 0 relevance label. To facilitate the comparison of
the results and the measures, SeznamRank4 (SR4) measure was derived. It is exactly the same measure, only the mapping of relevance labels is shifted by 1. Therefore, the relevance
24 CHAPTER 3. LEARNING TO RANK 3.3.2.10 Top K documents (@k)
There are measures (e.g. ERR, NDCG) that can be computed based only on topkelements
of the ranked list. This type of setting can be marked by @k at the name of the measure,
specyng that measure will be computed based just on the rst k elements. For example,
ERR@20 would be then
ERR@20 := 20 X r=1 1 r r−1 Y i=1 (1−Ri)Rr. (3.11)
Those cut-o @kmeasures can be used especially in the cases when the model is trained
for a specic use. For example, when only the top three documents will be displayed - it is important to learn such a model that returns relevant documents at the top three positions and the relevance of the documents ranked below does not really matter.
The following section Measures Analysis will cover the analysis of the aforementioned performance measures.
3.3.3 Measures Analysis
In order to analyze the characteristics of listed measures, a few experiments were performed. Two sets of documents are introduced for the purpose of the experiments.
D1={y1, y2, y3, y4}={4,3,2,1},
whereyi denotes a relevance label of a documentdi in a set of documentsD1. And then
D2 ={y1, y2, y3, y4, y4}={1,1,1,0,0},
with same notation as the previous set of documents. All possible permutations of documents
on both sets were generated. The duplicate lists of labels for D2 were removed.
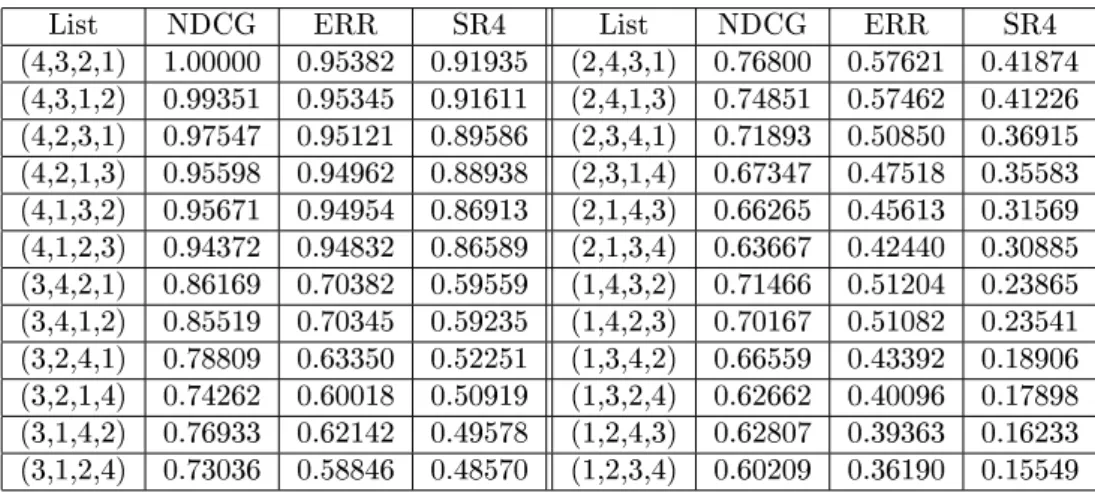
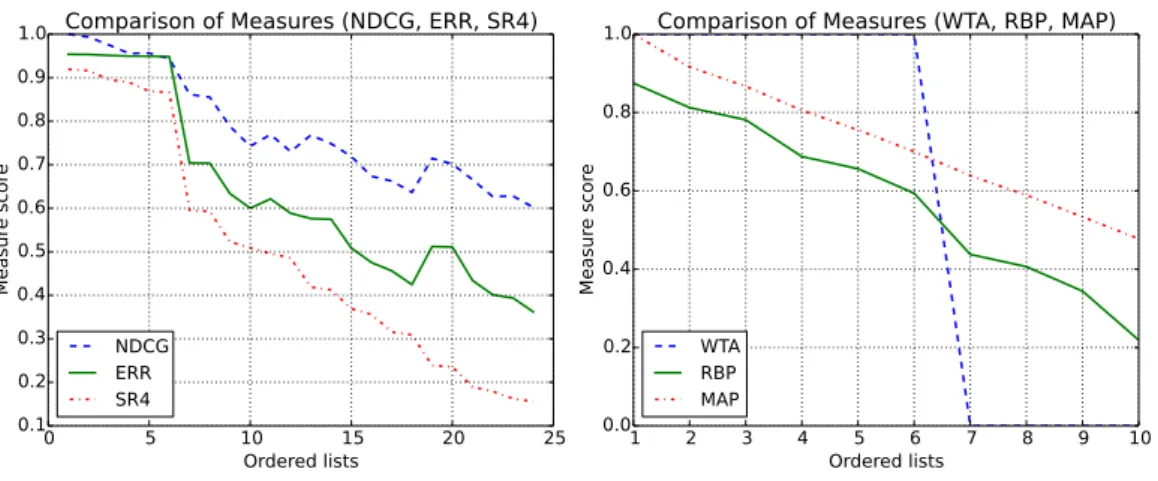
Relevance Scores Comparison All the ranked lists, that had been generated, were
evaluated by appropriate performance measures. D1 includes multi-level relevance grades,
while D2 uses only binary relevance labels. Therefore, NDCG, ERR and SR11 measures
were used to evaluate the permutations of D1 and WTA, RBP and MAP were used forD2
permutations. Results of the evaluation ofD1 permutations can be observed in Tab. 3.2 and
results given by the measures evaluated onD2 permutations are presented in Tab. 3.3.
Measures Correlation The following experiment is focused on the correlation of the measures. The outcomes of the measures for dierent lists were used to calculate correlation coecients. The coecients for both groups of performance measures are provided in Ta-ble 3.4. The taTa-ble on the left presents the correlation coecients computed for WTA, RBP and MAP measures, while the table on the right shows the coecients for NDCG, ERR and SR measures.