A Cough-Based Algorithm for Automatic
Diagnosis of Pertussis
Renard Xaviero Adhi Pramono*, Syed Anas Imtiaz, Esther Rodriguez-Villegas
Department of Electrical and Electronic Engineering, Imperial College London, London, United Kingdom *[email protected]
Abstract
Pertussis is a contagious respiratory disease which mainly affects young children and can be fatal if left untreated. The World Health Organization estimates 16 million pertussis cases annually worldwide resulting in over 200,000 deaths. It is prevalent mainly in develop-ing countries where it is difficult to diagnose due to the lack of healthcare facilities and medi-cal professionals. Hence, a low-cost, quick and easily accessible solution is needed to provide pertussis diagnosis in such areas to contain an outbreak. In this paper we present an algorithm for automated diagnosis of pertussis using audio signals by analyzing cough and whoop sounds. The algorithm consists of three main blocks to perform automatic cough detection, cough classification and whooping sound detection. Each of these extract relevant features from the audio signal and subsequently classify them using a logistic regression model. The output from these blocks is collated to provide a pertussis likelihood diagnosis. The performance of the proposed algorithm is evaluated using audio recordings from 38 patients. The algorithm is able to diagnose all pertussis successfully from all audio recordings without any false diagnosis. It can also automatically detect individual cough sounds with 92% accuracy and PPV of 97%. The low complexity of the proposed algorithm coupled with its high accuracy demonstrates that it can be readily deployed using smart-phones and can be extremely useful for quick identification or early screening of pertussis and for infection outbreaks control.
Introduction
Pertussis, also calledwhooping cough, is a contagious respiratory disease caused byBordetella pertussisbacteria in lungs and airways [1]. Its early symptoms include persistent dry coughs that progress into intense spells of coughing. This is usually, but not always, followed by a whooping sound due to the patient gasping for air. It mainly affects infants and young children and can be fatal if left untreated. The latest World Health Organization official report on the disease (2008) estimated 16 million cases of pertussis annually worldwide resulting in approxi-mately 200,000 deaths [2]. Estimates from Public Health Agency of Canada report an even higher prevalence with up to 40 million cases each year resulting in 400,000 deaths [3]. Further, a11111
OPEN ACCESS
Citation:Pramono RXA, Imtiaz SA, Rodriguez-Villegas E (2016) A Cough-Based Algorithm for Automatic Diagnosis of Pertussis. PLoS ONE 11(9): e0162128. doi:10.1371/journal.pone.0162128
Editor:Daniela Flavia Hozbor, Universidad Nacional de la Plata, ARGENTINA
Received:May 20, 2016
Accepted:August 17, 2016
Published:September 1, 2016
Copyright:© 2016 Pramono et al. This is an open access article distributed under the terms of the
Creative Commons Attribution License, which permits unrestricted use, distribution, and reproduction in any medium, provided the original author and source are credited.
Data Availability Statement:All relevant data sources are listed in the paper.
Funding:The authors received no specific funding for this work.
Competing Interests:The authors have declared that no competing interests exist.
about 95% of the pertussis cases have occured in developing countries where pertussis is con-sidered to be major cause of infant deaths [2].
A trained doctor can confirm pertussis diagnosis, in mostly unvaccinated cases, by listening to the cough sounds and asking about other symptoms. The gold standard, however, is a cul-ture test performed by collecting nasopharyngeal specimens. Alternative to this are the poly-merase chain reaction (PCR) test, and blood analysis with serology. However, all these laboratory tests are expensive, time-consuming and may not be available, particularly in rural areas and developing countries. This can hinder effective and timely treatment of patients and risks worsening their condition as well as further spreading of the infection to others.
A low-cost, quick and easily accessible solution is needed to provide pertussis diagnosis to people in developing nations where its prevalence, and mortality rate due to pertussis, is high-est. Such a system needs to be fully automated, user-friendly, and highly accurate so that there are no barriers to its adoption and deployment. With the smartphone usage steadily rising in developing countries [4], this serves as an ideal platform on which such an automated system can be developed. This paper proposes a complete automatic pertussis diagnosis algorithm based on automatic segmentation and classification of cough and whoop sounds. When imple-mented on an embedded device or a smartphone, it can analyze audio signals obtained from the built-in microphone and provide prompt diagnostic result. This ability to provide pertussis diagnosis by processing audio signals on a smartphone can be extremely helpful to deliver timely and efficient treatment to places and people with limited or no access to healthcare.
In this paper, we propose a pertussis identification algorithm that is able to automatically segment individual cough and whoop sounds and subsequently classify them and present a pertussis diagnosis. The aim is to develop an algorithm using little computational resources to allow the algorithm to be deployed on low–cost smartphones particularly in areas where healthcare services are substandard.
Review of Cough Detection and Classification Algorithms
Cough detection is an active research area in which several researchers have proposed methods for identifying cough sounds from audio recordings. These methods can be divided into three main categories: 1) automatic cough detection and segmentation (without classification), 2) automatic classification of coughs that are already detected, and 3) diagnosis of an illness based on the cough sound and type.
For automatic cough segmentation, Martinek et al. [5] extracted several time, frequency and entropy features and used a decision tree to discriminate between voluntary cough sounds and speech. They used data from 20 subjects, with 46 coughs from each subject, and reported median sensitivity and specificity values of 100% and 95% respectively. However, their method is subject–dependent since the subjects are required to cough at the beginning of each record-ing in order to obtain individual cough signal patterns. Barry et al. [6] used linear predictive coding (LPC) coefficients with a probabilistic neural network (PNN) classifier to create an automatic cough counting tool called Hull Automatic Cough Counter (HACC). This success-fully discriminated between cough and non–cough events from 33 subjects with a sensitivity of 80% and specificity of 96%. Tracey et al. [7] developed an algorithm for cough detection to monitor patient recovery from tuberculosis. They extracted MFCCs from the audio signals of 10 test subjects. These were used to detect coughs with a combination of artificial neural net-work (ANN) and support vector machine (SVM) classifiers achieving an overall sensitivity of 81%. In both these methods the total number of coughs in the dataset were not reported. Swarnkar et al. [8] used other spectral features such as formant frequencies, kurtosis, and B– score together with MFCC features for cough detection. These were fed into a neural network
resulting in a sensitivity of 93% and a specificity of 94% for a test dataset consisting of 342 coughs from 3 subjects only. Amrulloh et al. [9] used ANN classification to develop a cough detector using a non–contact recording system for pediatric wards achieving sensitivity and specificity values of 93% and 98% respectively using over 1400 cough sounds from 14 subjects. Matos et al. [10] extracted thirteen MFCCs which were classified using a Hidden Markov Model (HMM). Their test dataset consisted of 2155 coughs from 9 subjects and their method resulted in 82% sensitivity for cough detection. The total number of false detections was not reported, however, the average false positives per hour was 7 with a high variance between sub-jects. Liu et al. [11] used Gammatone Cepstral Coefficient (GMCC) features with SVM classifi-cation of 903 coughs from 4 subjects resulting in sensitivity and specificity of 91% and 95% respectively. Lucio et al. [12] extracted 79 MFCC and Fast Fourier Transform (FFT) coeffi-cients and used k-Nearest Neighbor (kNN) for classification. From a dataset acquired from 50 individuals, their algorithm achieved sensitivity of 87% in classifying 411 cough sounds with specificity of 84%. Larson et al. [13] presented a method of cough detection using the built-in microphone of a mobile phone for data collection. Their algorithm, which was not imple-mented on the phone, used random forest classification with a maximum for 500 decision trees achieving 92% sensitivity on over 2500 cough sounds from 17 subjects. All of these methods aim to identify cough segments from audio recordings without the ability to classify them into specific cough types.
Classification of cough sounds is helpful in identifying the underlying cause of coughs so that the right treatment can be offered to the patients. Several algorithms for automatic cough classification have been published to identify various cough types but all of them rely on man-ual segmentation of cough sounds before automatic classification can be performed. Chatrzar-rin et al. [14] studied the different phases of dry and wet coughs and found the second phase of dry coughs to have lower energy compared to wet coughs. They also noted that, during this phase, most of the signal power is contained between 0-750 Hz in case of wet coughs and 1500-2250 Hz in case of dry coughs. Using a simple thresholding method, they successfully identified 14 wet and dry coughs with 100% accuracy. Swarnkar et al. [15] used a Logistic Regression Model (LRM) based classifier to discriminate between dry and wet coughs from pediatric patients with different respiratory illnesses. They used several features including B–score, non-gaussianity, formant frequencies, kurtosis, zero crossing rate and MFCCs. For a test database with 117 coughs from 18 subjects, they reported sensitivities of 84% and 76% for detecting wet and dry coughs respectively. Kosasih et al. [16] developed an algorithm for automatic diagnosis of childhood pneumonia by assessing cough sounds and crackles. They used MFCCs, non– gaussianity index and wavelet features with a LRM classifier to differentiate between pneumo-nia and non–pneumonia cough sounds. Their method achieved sensitivity and specificity of 81% and 50% respectively for a total of 375 cough samples from 25 subjects. Specific to pertus-sis coughs, Parker et al. [17] studied the performance of three different classifiers for their clas-sification. They used audio files of pertussis cough sounds available on the internet to create a dataset consisting of 16 non-pertussis cough signals and 31 pertussis cough signals. From this data, the cough sounds were then manually isolated and divided into three parts for which 13 MFCC features and the energy level were extracted. These features were subsequently classified using an ANN, a random forest classifier and a kNN classifier. For each of these classifiers the false positive error was 7%, 12% and 25% respectively while the false negative error was 8%, 0% and 0% respectively.
From the review above, it can be concluded that while there are algorithms for cough detec-tion and specific cough classificadetec-tion, none of them perform fully automatic cough detecdetec-tion andclassification. Further, there has been only one algorithm reported for pertussis cough clas-sification which also relies on manual segmentation of cough sounds prior to clasclas-sification.
Additionally, most of the high-performing cough detectors use complex classifiers making them unsuitable for use resource-constrained devices.
Material and Methods
A typical episode of whooping cough involves intense coughing, usually but not always, fol-lowed by the characteristic whooping sound. Hence, in order to identify a pertussis case, two main sounds are helpful: cough sound and the whooping sound. While whooping sound is quite specific to pertussis, cough sounds have a lot of variance depending on the cause of cough. Hence, it is important to distinguish between the different cough types after a cough sound gets detected.
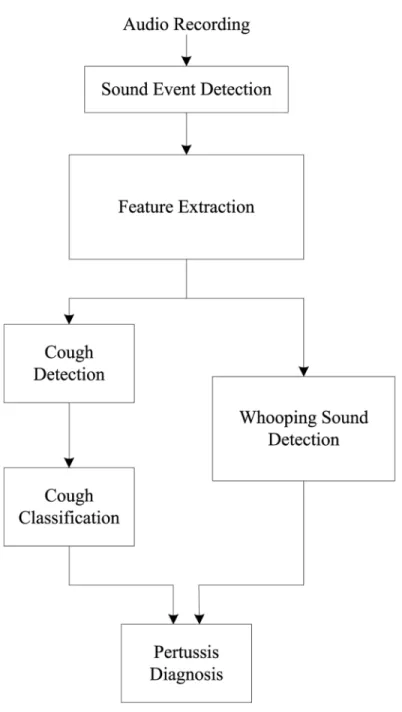
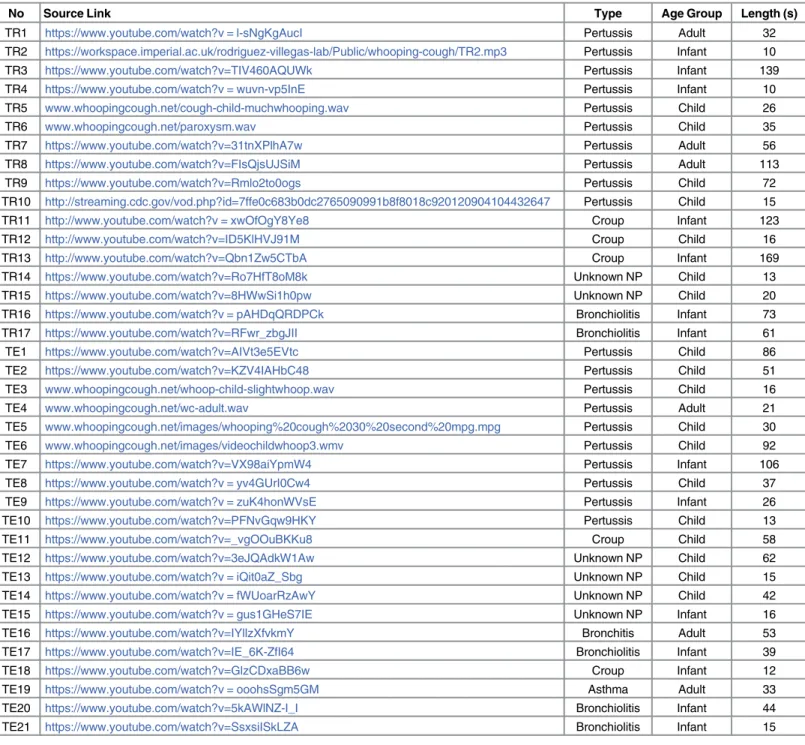
The pertussis diagnosis algorithm proposed in this paper, following the aforementioned approach, is shown inFig 1. For the development of this algorithm, a total of 38 different audio recordings were acquired from publicly available sources with duration between 10–169 sec-onds and an average of 48.7 secsec-onds per recording. (Table 1). These include 20 recordings of patients with pertussis cough, 11 with croup and other types of cough, and 7 of cough contain-ing wheezcontain-ing sounds correspondcontain-ing to other diseases such as bronchiolitis and asthma. Of the 38 recordings, 14 are from infants aged 0-2 years, 18 from children aged 3-18 years and 6 from adults aged of over 19 years in age. Information about the exact laboratory test used to obtain the diagnosis for these recordings is, unfortunately, not available. Prior to any processing, all recordings were resampled to a frequency of 16000 Hz. This is because all the required infor-mation is contained below 8000 Hz, which is half of the new sampling rate. The audio signals were then divided into frames of 320 ms for processing with a 50% overlap between subsequent frames.
The first step for automated pertussis identification involves feature extraction from non-silent parts of an audio recording. Several features are extracted from each frame including time-domain features, frequency-domain features and Mel Frequency Cepstral Coefficients (MFCCs). These are subsequently used for cough detection, cough classification and whooping sound detection. The design and functionality of each block in the proposed algorithm is explained in the following sections.
Sound Event Detection
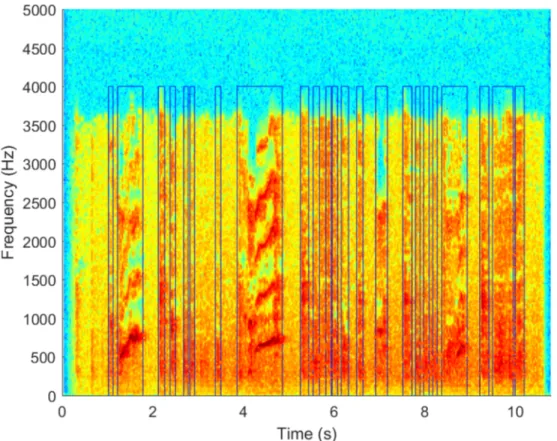
Prior to the detection of any cough and whooping events, a sound detector is used to remove the silent sections of the audio recordings. This ensures that all further audio processing is per-formed only on signals where there is some sound and also helps in reducing the processing load and decreases the algorithm runtime. It is implemented by comparing the standard devia-tion of each frame to the mean of the standard deviadevia-tion in each recording. By setting a thresh-old for the minimum frame standard deviation the silent parts in a recording can be removed. An example of the result this approach achieves can be seen inFig 2where the sound events can be clearly distinguished from the silent parts of the recording.
Feature Extraction
At the initial stages of algorithm development, a large number of features were extracted from the audio signals to study their discriminating abilities. From this initial set of features, that are explained below, the top performing ones were selected based on their usefulness in detecting and classifying cough and whoop sounds separately.
Mel-Frequency Cepstral Coefficient. The complex cepstrum is defined as the Fourier
transformed logarithm of the signal spectrum [18]. The coefficients that represent this trans-formation are called cepstral coefficientsc[n] and can be obtained usingEq (1)for a signal with
power spectrumS(ω).
logðSðoÞÞ ¼ X
1
n¼1
c½nejno ð1Þ A total of 13 MFCCs were extracted for the proposed algorithm, including the zeroth order MFCC, using themelcepstfunction inVOICEBOXspeech processing toolbox [19] for MATLAB[20]. Additionally, the first and second derivative coefficients were also extracted, such
that there were a total of 39 MFCC features.
Fig 1. Block diagram of the automatic pertussis identification algorithm.
Table 1. List of data sources for cough sounds.
No Source Link Type Age Group Length (s)
TR1 https://www.youtube.com/watch?v = l-sNgKgAucI Pertussis Adult 32
TR2 https://workspace.imperial.ac.uk/rodriguez-villegas-lab/Public/whooping-cough/TR2.mp3 Pertussis Infant 10
TR3 https://www.youtube.com/watch?v=TIV460AQUWk Pertussis Infant 139
TR4 https://www.youtube.com/watch?v = wuvn-vp5InE Pertussis Infant 10
TR5 www.whoopingcough.net/cough-child-muchwhooping.wav Pertussis Child 26
TR6 www.whoopingcough.net/paroxysm.wav Pertussis Child 35
TR7 https://www.youtube.com/watch?v=31tnXPlhA7w Pertussis Adult 56
TR8 https://www.youtube.com/watch?v=FIsQjsUJSiM Pertussis Adult 113
TR9 https://www.youtube.com/watch?v=Rmlo2to0ogs Pertussis Child 72
TR10 http://streaming.cdc.gov/vod.php?id=7ffe0c683b0dc2765090991b8f8018c920120904104432647 Pertussis Child 15
TR11 http://www.youtube.com/watch?v = xwOfOgY8Ye8 Croup Infant 123
TR12 http://www.youtube.com/watch?v=ID5KlHVJ91M Croup Child 16
TR13 http://www.youtube.com/watch?v=Qbn1Zw5CTbA Croup Infant 169
TR14 https://www.youtube.com/watch?v=Ro7HfT8oM8k Unknown NP Child 13
TR15 https://www.youtube.com/watch?v=8HWwSi1h0pw Unknown NP Child 20
TR16 https://www.youtube.com/watch?v = pAHDqQRDPCk Bronchiolitis Infant 73
TR17 https://www.youtube.com/watch?v=RFwr_zbgJII Bronchiolitis Infant 61
TE1 https://www.youtube.com/watch?v=AIVt3e5EVtc Pertussis Child 86
TE2 https://www.youtube.com/watch?v=KZV4IAHbC48 Pertussis Child 51
TE3 www.whoopingcough.net/whoop-child-slightwhoop.wav Pertussis Child 16
TE4 www.whoopingcough.net/wc-adult.wav Pertussis Adult 21
TE5 www.whoopingcough.net/images/whooping%20cough%2030%20second%20mpg.mpg Pertussis Child 30
TE6 www.whoopingcough.net/images/videochildwhoop3.wmv Pertussis Child 92
TE7 https://www.youtube.com/watch?v=VX98aiYpmW4 Pertussis Infant 106
TE8 https://www.youtube.com/watch?v = yv4GUrI0Cw4 Pertussis Child 37
TE9 https://www.youtube.com/watch?v = zuK4honWVsE Pertussis Infant 26
TE10 https://www.youtube.com/watch?v=PFNvGqw9HKY Pertussis Child 13
TE11 https://www.youtube.com/watch?v=_vgOOuBKKu8 Croup Child 58
TE12 https://www.youtube.com/watch?v=3eJQAdkW1Aw Unknown NP Child 62
TE13 https://www.youtube.com/watch?v = iQit0aZ_Sbg Unknown NP Child 15
TE14 https://www.youtube.com/watch?v = fWUoarRzAwY Unknown NP Child 42
TE15 https://www.youtube.com/watch?v = gus1GHeS7IE Unknown NP Infant 16
TE16 https://www.youtube.com/watch?v=IYllzXfvkmY Bronchitis Adult 53
TE17 https://www.youtube.com/watch?v=IE_6K-ZfI64 Bronchiolitis Infant 39
TE18 https://www.youtube.com/watch?v=GlzCDxaBB6w Croup Infant 12
TE19 https://www.youtube.com/watch?v = ooohsSgm5GM Asthma Adult 33
TE20 https://www.youtube.com/watch?v=5kAWlNZ-I_I Bronchiolitis Infant 44
TE21 https://www.youtube.com/watch?v=SsxsiISkLZA Bronchiolitis Infant 15
TRx—Training data; TEx—Test data; NP—Non-pertussis.
Zero-crossing Rate. Zero-crossing rate represents the frequency of sign-changes in a sig-nal [21] and is calculated usingEq (2). It results in higher values for noisy and high frequency signals where sign changes are more frequent.
ZCR¼ 1 T1
XT1
t¼1
Ifstst1<0g ð2Þ
Crest Factor. Crest factor is the ratio of the value of a peak in a waveform relative to its root mean square (RMS) value. Calculated usingEq (3), it gives a measure of the intensity of detected peaks.
CF¼jxjpeak xrms
ð3Þ
Energy Level. Energy level of an audio frame is calculated as the RMS of the frame using
Eq (4). Since cough is an explosive sound, it will have bursts of energy increase in short time. EnergyLevel¼ ffiffiffiffiffiffiffiffiffiffiffiffiffiffiffiffiffiffiffiffiffiffiffi PN1 n¼0xðnÞ 2 N r ð4Þ Fig 2. An example showing the output of sound event detection scheme where the non-silent parts of the recording have been successfully identified (areas under blue lines).
Dominant/Maximum Frequency (MaxF). Dominant/maximum frequency is the value of the frequency bin at which the maximum power of the signal is found. Since the whooping sound has a significantly higher dominant frequency compared to the cough sound because of its higher pitch, this feature can be useful to distinguish between these two types of sounds.
Spectral Roll-Off (SRO). Spectral roll-off determines the point below which most energy
of a signal is contained and is useful in distinguishing sounds with different energy distribu-tions. Both the cough and whooping sounds have different spectral roll-off frequencies since most energy in the cough sound is concentrated in the earlier sections of the frequency spectrum.
Spectral Skewness / Asymmetric Coefficient (SAC). Spectral skewness or asymmetric
coefficient is a measure of the asymmetry in the power spectrum of a signal about its mean (μ) and is useful in understanding if the power distribution in PSD estimate will have more density in lower or higher frequency. A negative skewness coefficient means that the distribution of the spectrum is left-tailed, while a positive coefficient signifies a right-tailed distribution. SAC is computed as the third moment divided by the cube of the standard deviation, as shown in the equation below.
SAC¼ EðxmÞ
d
3
ð5Þ
Spectral Kurtosis Coefficient (SKC). Spectral kurtosis coefficient is also a measure of the peak of the power spectrum and, similar to SAC, it can be used to describe the shape of the probability distribution of the energy in the power spectrum of a signal. A high kurtosis denotes more extreme infrequent deviation. From this feature, the power distribution peak, shoulder, and tail of the PSD estimate can be measured. SKC is computed by using the fourth moment as shown inEq (6).
SKC¼ EðxmÞ
d
4
ð6Þ
Spectral Centroid (SC). Spectral centroid represents the equivalent of the center of mass in a spectrum and is computed as a weighted mean of the spectrum as shown inEq (7)wheref (n) is the frequency bin and whilex(n) is the PSD estimate.
SC¼ PN1 n¼0 fðnÞxðnÞ PN1 n¼0xðnÞ ¼m1 ð7Þ
Spectral Spread (SSp). Spectral spread is a measure of the spread of a spectrum with respect to its mean. Also called spectral width, it is computed usingEq (8)where the momentμ is defined usingEq (9)[22]. SS¼ ffiffiffiffiffiffiffiffiffiffiffiffiffiffiffiffiffiffim2SC2 p ¼ ffiffiffiffiffiffiffiffiffiffiffiffiffiffiffim2m21 p ð8Þ mi ¼ PN1 n¼0 fðnÞ i xðnÞ PN1 n¼0 xðnÞ ð9Þ
Spectral Decrease (SD). Spectral decrease represents the rate of spectral decrease and is calculated as follows. SD¼PN1 n¼2x XN n¼2 xðnÞ xð1Þ n1 ð10Þ
Spectral Flatness (SF). Spectral flatness determines the flatness of a spectrum by compar-ing its geometric with the arithmetic mean. Also called tonality coefficient and calculated uscompar-ing
Eq (11), it helps to quantify how noise-like a sound is. SF¼e 1 N P nlogðxðnÞÞ ð Þ 1 N P nxðnÞ ð11Þ
Spectral Slope (SSl). Spectral slope measures the decreasing slope of a spectrum and indi-cates how quickly the power of a spectrum goes down towards high frequencies. Based on [23], it can be computed by linear regression of the spectrum as shown below.
SSl¼P1 nxðnÞ NPnfðnÞxðnÞ P nfðnÞ P nxðnÞ NPnf2ðnÞ ðP nfðnÞÞ 2 ð12Þ
Spectral Standard Deviation (SSD). Spectral standard deviation is a commonly used
fea-ture that measures the standard deviation of the PSD.
Band Power (BP). Band power represents the average power in a specific frequency band.
It is calculated by integrating the PSD estimate using rectangle approximation method.
Cough detection
It is important to understand the characteristics of a cough sound before any attempt of its detection is made. A cough sequence is started by a mechanical or chemical stimuli and is ended when the unwanted substances are removed from the airways [24]. The acoustic features of a cough sound depends on the airflow velocity as well as the dimensions of vocal tract and airways [24]. This makes it possible to detect or classify a cough sound based on the acoustic features since these features are dependent on the cause of cough.
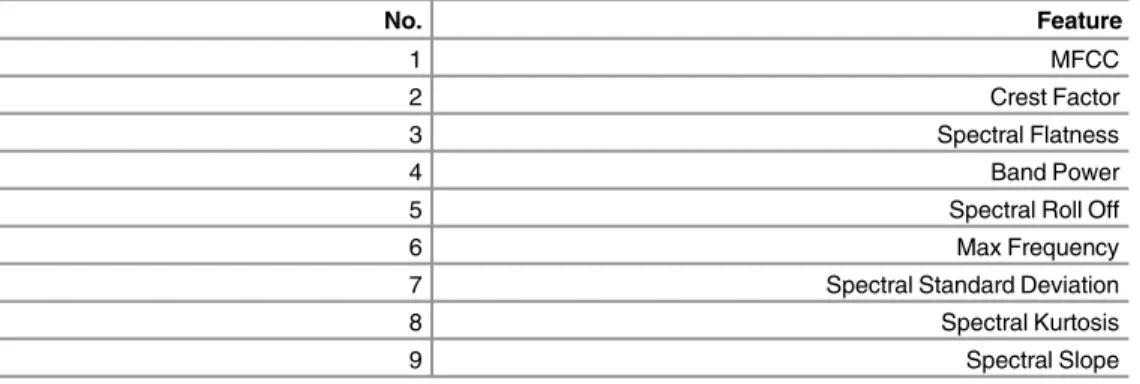
In order to perform cough detection from the audio signal, the features described in the ear-lier section are used as predictors in a logistic regression model (LRM). This cough sound detection model is trained using 10 pertussis and 7 non-pertussis recordings from the database. The cough sounds in each recording are manually segmented and clearly marked to allow for binary classification. The top nine features are then selected using sequential feature selection since addition of further features result in very small changes to the model deviance. The final list of features used for this classifier is shown inTable 2in order of maximum deviance minimization.
Cough classification
Chung et al. [25] classified cough sounds based on five different categories: behavioral, patho-logical, duration, effect and grade of coughs. Whooping cough, which is the focus of this work, is considered to be a pathological cough. The types of cough based on pathology, aside from whooping cough, are dry cough, wet cough, hacking, throat or chest irritation and nasal drip. However, a whooping cough is basically a series of dry coughs followed by whooping sound
making it somewhat similar to the coughs in other conditions. Thus, it is important to clearly distinguish whooping cough from other conditions with dry cough as a symptom, such as croup or bronchiolitis.
From observing a cough sound signal in time domain Morice et al. [26] concluded that there are three types of cough patterns. This includes 3-phased cough (which is the most com-mon type of cough sound signal) [27], 2-phased cough, and peal cough. For a 3-phased cough, Korpas et al. [28] concluded that the first phase of the cough is due to turbulent airflow which itself is caused by narrowed airways. This leads to vibrations in the airway as well as the lung tissue. In case of whooping cough, the airways will be filled with a lot of thick mucus which may cause stronger vibrations as the airways become narrower. Subsequently, this may lead to higher power during the first phase of the cough. The second phase of the cough is caused by the airflow in the trachea, while the final phase is induced by the adduction of the vocal fold at the end of the second phase [28].
The cough sounds detected are quite generic and may result from a number of different medical conditions. This section describes how the detected cough sounds are classified to determine if they are the kind of dry coughs that are specific to pertussis. A separate logistic regression model is used to perform the classification of the isolated cough events. From the dataset, half of the cough events are used to train the LRM and the other half are used for test-ing. The features extracted from the training set include all the time and frequency domain fea-tures listed earlier with 13 MFCCs including the zeroth coefficient. Each isolated cough event is divided into three same-length sections following the 3-phased cough model and a total of 30 features are extracted from each section. With these features, an LRM classifier is used to deter-mine whether the isolated cough sounds are of the kind that is heard in pertussis or not. How-ever, not all of the detected cough sounds are used for the automatic classification. Some of the extracted sound events have length that are not typical of a cough sound. Only sound events with length typical to a cough sound are selected to be used in the automatic classification while others are discarded by setting a threshold for duration. The final result of this classifier is the percentage of cough events classified as a pertussis case relative to the total number of coughs.
Whooping sound detection
Although the whooping sound normally follows an episode of coughing, it is not necessarily present in all cases of pertussis nor in every spell of coughing, especially in the case of infants. Table 2. List of features used for cough sound detection.
No. Feature
1 MFCC
2 Crest Factor
3 Spectral Flatness
4 Band Power
5 Spectral Roll Off
6 Max Frequency
7 Spectral Standard Deviation
8 Spectral Kurtosis
9 Spectral Slope
However, in cases where this sound is present, its detection helps to improve the diagnosis of pertussis and improve the overall accuracy an automated classifier.
The design of the whooping sound detector follows a similar pattern to the cough detector. Of the 38 recordings in the database, 10 pertussis and 7 non-pertussis recordings are used to create the training set. The MFCCs, time and frequency domain features listed earlier are extracted from these recordings to create a feature vector for a logistic regression model.
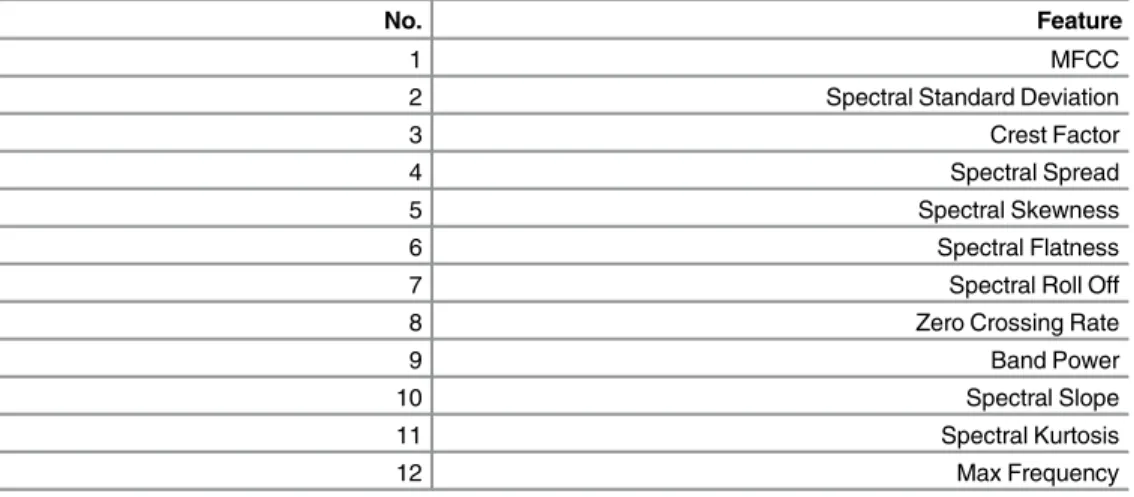
For feature selection, the features are added one by one to minimize the model deviance at each step. Once the reduction in deviance becomes very small with each additional feature, this process is stopped and only the top 12 features are used. This ensures the use of minimum number of features to achieve the highest classification performance.Table 3lists the features used in order of maximum deviance minimization.
Pertussis Diagnosis
The results from cough detection followed by classification and whooping sound detection are collated in order to provide the final pertussis identification. If a whooping sound is detected in an audio recording, then the case is identified as a pertussis even if the pertussis cough ratio is low. If there is no whooping sound detected, the identification result is obtained from the tussis cough ratio obtained from the cough classifier. Without the whooping sound, if the per-tussis cough ratio is greater than 0.5 then the case is classified as perper-tussis.
Results
There are three different instances of classification being performed in the algorithm before the final pertussis diagnosis is determined. The first one is the identification of individual cough instances to determine whether an audio sound is in fact a cough sound or not. Once this is complete, the next stage involves classification of these cough sounds. A parallel classifier attempts to identify the presence of whooping sounds. These results are then used to mark a recording as either pertussis or non-pertussis.
In this section the results of all these classifiers are presented individually to assess their per-formance on both training and test data sets using the following metrics [29].
1. Sensitivity, which represents the fraction of correctly identified positive cases. Table 3. List of features used for whooping sound detection.
No. Feature
1 MFCC
2 Spectral Standard Deviation
3 Crest Factor
4 Spectral Spread
5 Spectral Skewness
6 Spectral Flatness
7 Spectral Roll Off
8 Zero Crossing Rate
9 Band Power
10 Spectral Slope
11 Spectral Kurtosis
12 Max Frequency
2. Specificity, which represents the fraction of negatives cases being correctly rejected. 3. Positive Predictive Value (PPV), which represents the proportion of positive results that
are correctly detected.
4. Negative Predictive Value (NPV), which represents the proportion of negative results that are correctly rejected.
To calculate the metrics above,TP(True Positives) is the number of instances correctly detected as either cough or whooping sound (depending on the classifier),FP(False Positives) is the number of incorrectly scored instances,TN(True Negatives) is the number of instances correctly rejected, andFN(False Negatives) is the number of incorrectly rejected instances. For pertussis diagnosis, the PPV and NPV are the most important metrics since they indicate the degree of confidence with which a diagnosis is made.
Cough detection
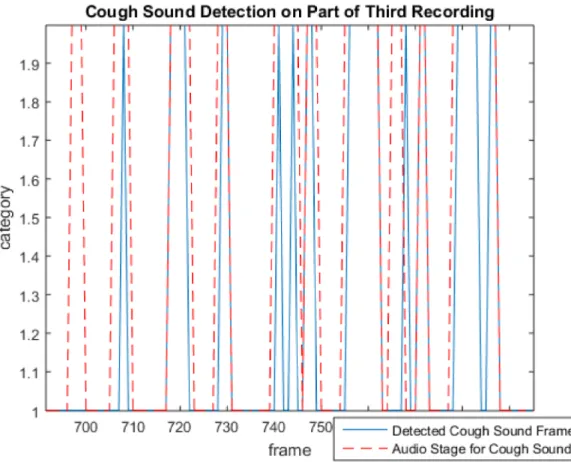
Fig 3shows an example of several cough instances being detected from an audio recording. The dotted lines show the reference cough frames in the recording while the solid lines show the frames classified as cough sound by the logistic regression model. In this example there are Fig 3. An example illustrating the output of cough detection with red lines showing the reference cough frames and blue lines showing the detected cough frames.
a total of ten actual cough events of which nine are detected (true positives) while one goes undetected and is counted as a false negative.
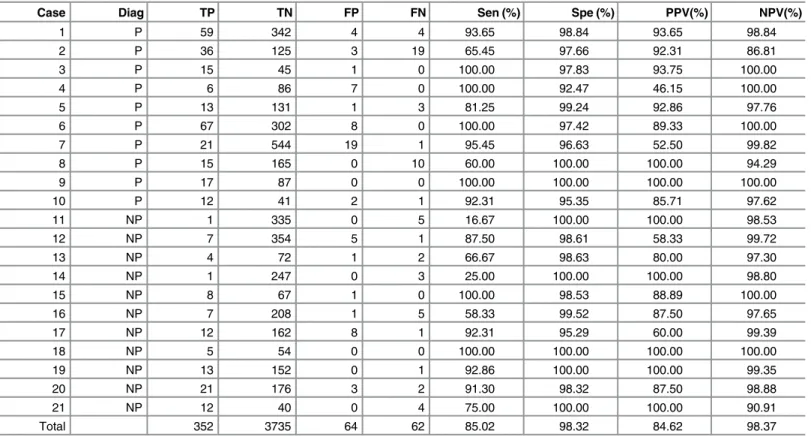
Table 4shows the overall cough detection performance across all test recordings as well as the individual performance for each of the 21 recordings. It shows the total coughs present in each audio recording of the test dataset and the fraction of correctly detected coughs. Of the total 414 cough events across 21 recordings, 85% of them are correctly detected with a com-bined PPV of 85%. In most cases with pertussis the sensitivity values are more than 80% indi-vidually with an average of 89% except in case 2 where the sensitivity is 65%. This is because of the recording consists of other people speaking at the time of cough events making it difficult to detect the cough sounds individually. However, the high specificity and low number of false positives indicate that the classifier is still able to reject other sounds which are not cough with a high accuracy. Further. in non-pertussis cases (11-21), the sensitivity values are generally lower. This is due to the lower number of reference cough sounds resulting in greater changes in overall sensitivity even when a smaller number of coughs are not detected.
Cough classification
Once the cough sounds are detected, they are checked to see if they are similar to the cough sound that is generally observed in pertussis. For this, the classifier is trained using cough sounds that are manually isolated from the audio recordings. Half of the manually segmented Table 4. Performance of the algorithm for cough sound detection using test data.
Case Diag TP TN FP FN Sen (%) Spe (%) PPV(%) NPV(%)
1 P 59 342 4 4 93.65 98.84 93.65 98.84 2 P 36 125 3 19 65.45 97.66 92.31 86.81 3 P 15 45 1 0 100.00 97.83 93.75 100.00 4 P 6 86 7 0 100.00 92.47 46.15 100.00 5 P 13 131 1 3 81.25 99.24 92.86 97.76 6 P 67 302 8 0 100.00 97.42 89.33 100.00 7 P 21 544 19 1 95.45 96.63 52.50 99.82 8 P 15 165 0 10 60.00 100.00 100.00 94.29 9 P 17 87 0 0 100.00 100.00 100.00 100.00 10 P 12 41 2 1 92.31 95.35 85.71 97.62 11 NP 1 335 0 5 16.67 100.00 100.00 98.53 12 NP 7 354 5 1 87.50 98.61 58.33 99.72 13 NP 4 72 1 2 66.67 98.63 80.00 97.30 14 NP 1 247 0 3 25.00 100.00 100.00 98.80 15 NP 8 67 1 0 100.00 98.53 88.89 100.00 16 NP 7 208 1 5 58.33 99.52 87.50 97.65 17 NP 12 162 8 1 92.31 95.29 60.00 99.39 18 NP 5 54 0 0 100.00 100.00 100.00 100.00 19 NP 13 152 0 1 92.86 100.00 100.00 99.35 20 NP 21 176 3 2 91.30 98.32 87.50 98.88 21 NP 12 40 0 4 75.00 100.00 100.00 90.91 Total 352 3735 64 62 85.02 98.32 84.62 98.37
Diag—indicates whether recording has pertussis (P) or non-pertussis (NP) diagnosis. TP—true positives; TN—true negatives; FP—false positives; FN— false negatives. Sen—sensitivity; Spe—specificity; PPV—positive predictive value; NPV—negative predictive value.
cough sounds are used for training the model and the other half for testing. The average perfor-mance achieved for the cough sound classification into either pertussis or non-pertussis cough is shown inTable 5. All of the metrics indicate a good classification performance except NPV which is slightly lower at 80%. This is perhaps due to the presence of more pertussis cough sounds in the database.
Table 6shows that while the NPV is high for infants, it is much lower for children. For this age agroup, the PPV is alse low despite a high sensitivity. This represents an area where more work is needed to improve the classifier performance. It is possible to explore age-dependent features in order to achieve higher accuracy.
The performance of this cough classifier is also assessed in combination with the cough detection block which automatically detects the individual cough instances. The number of coughs, for each test case, that are classified as pertussis cough as a fraction of the total number of detected coughs is then computed. This is a number between 0 and 1 that gives a fair proba-bility of pertussis diagnosis based on a large number of coughs for an individual. These results are shown inTable 7which clearly demonstrates a significantly higher percentage of pertussis coughs being classified in cases which are already diagnosed with pertussis.
Whooping sound detection
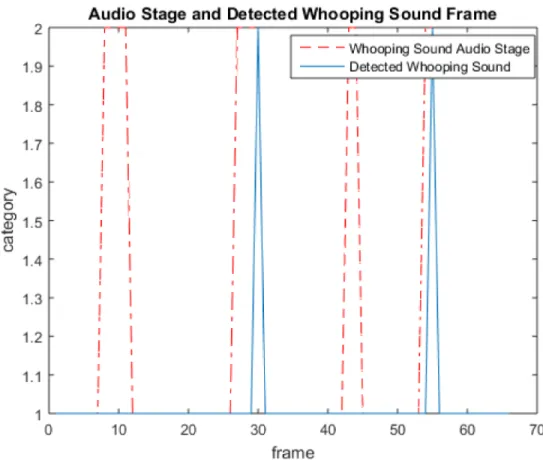
Fig 4shows an example of whooping sound detection being performed where the dashed lines represent the reference whooping sound while the solid lines show the whooping sound as detected by the algorithm. In this example, there are four frames with whooping sound of which two are correctly detected by the algorithm and two are incorrectly rejected.
While the example shows a clear case of pertussis with the presence of whooping sound, there are some recordings in the test dataset lacking this whooping sound despite being diag-nosed as pertussis. Further, no whooping sound is present in the recordings of non-pertussis cases. The complete results of the whooping sound detector for recordings from the test data set are shown inTable 8. The overall sensitivity in this case is 73% with the PPV value of 87%. Table 5. Performance of the algorithm for cough classification using test data.
Metric Value (%) Sensitivity 92.38 Specificity 90.00 PPV 96.50 NPV 79.84 doi:10.1371/journal.pone.0162128.t005
Table 6. Cough classification performance by age group.
Sensitivity (%) Specificity (%) PPV (%) NPV (%)
Infants 92.59 92.86 94.94 89.66
Children 93.00 70 69.88 50.00
Adults 89.36 92.31 97.67 70.59
Overall 92.38 90.00 96.50 79.84
In pertussis cases, there are two recordings without the presence of any whooping sound and both of these result in no false positives being detected by the classifier. Of the remaining eight, at least some of the whooping sound segment gets detected in six cases. In non-pertussis cases, there is no false detection of whooping sound resulting in specificity of 100% in all cases.
Pertussis Diagnosis
The complete pertussis identification results for the test data are shown inTable 9. From the table, it can be seen that all cases have been successfully identified as either pertussis or non-pertussis. In cases 1-10 (with pertussis diagnosis), six cases have been identified because the presence of whooping sounds have been detected. In the other four, the pertussis cough ratio is greater than 0.5 indicating a high likelihood of pertussis. For non-pertussis cases, the cough ratio is either zero or very low for all except case 12 which is on the border. The identification threshold can be increased if a more strict detection criterion is desired.
Discussion
In this paper, an algorithm for automated pertussis diagnosis is presented with additional iden-tification of other diagnostic features. The algorithm consists of LRM-based classifiers for whooping sound detection, cough sound detection, and cough sound classification. This algo-rithm represents the very first reported attempt towards a fully automated end-to-end solution Table 7. Performance of the algorithm for cough classification together with cough sound detection using test data.
Case Diag Pertussis Cough Ratio
1 P 0.98 2 P 0.70 3 P 1.00 4 P 0.67 5 P 0.91 6 P 1.00 7 P 0.90 8 P 1.00 9 P 0.93 10 P 1.00 11 NP 0.00 12 NP 0.50 13 NP 0.00 14 NP 0.00 15 NP 0.22 16 NP 0.00 17 NP 0.46 18 NP 0.25 19 NP 0.25 20 NP 0.00 21 NP 0.33
Diag—indicates whether recording has pertussis (P) or non-pertussis (NP) diagnosis.
that incorporates automatic cough detection and classification as well as whooping sound detection. As a result, no manual segmentation of cough sounds need to be performed allowing the algorithm to be used as a stand-alone solution in real-time. Additionally, it does not require any person-specific tuning of thresholds, is computationally efficient and is resilient to artifacts enabling unsupervised usage on smartphones under real-world conditions. The main contribu-tion of the work presented in this paper is a complete pertussis diagnosis algorithm, however, the intermediate classifiers for cough detection, classification and whooping sound detection can be used on their own for various applications.
The cough detection part of the diagnosis algorithm presented here, if used on its own, achieves performance that is comparable to other methods proposed in literature. This is despite its lower complexity compared to other cough detection methods [8,10,11,30] that use HMM, SVM and neural networks for classification.
Algorithms for cough classification have also been published previously including those for pneumonia [16,31,32], wet and dry cough classification [14,15,33] and asthma [34]. How-ever, the only other study for pertussis cough classification is published by Parker et al. [17]. This uses neural networks to classify coughs with sensitivity and specificity of 93% and 92% respectively for 47 cough events only. In comparison, the cough classifier part of the diagnosis algorithm proposed in this paper uses significantly more cough events as part of the test data and achieves performance comparable to that in [17]. Its performance can be improved further Fig 4. An example illustrating the output of whooping sound detection with red lines showing the reference whooping sound frames and blue lines showing the detected whooping sound frames.
by incorporating other types of coughs such as those in croup, bronchiolitis, asthma, and cold cough. Additionally, the proposed cough classifier also computes the pertussis cough ratio that minimizes the effects of misclassification at the final pertussis identification stage.
The whooping sound detection part of the diagnosis algorithm, when used independently, has a very high specificity but is limited by its lower sensitivity. It should be noted that whoop-ing sound is categorized as apathognomonicsymptom for pertussis. This means that whooping sound is a unique characteristic of pertussis. By developing a high specificity detector, a pertus-sis case can be objectively confirmed by the presence of a whooping sound.
The pertussis diagnosis algorithm proposed in this paper successfully identifies all the cases correctly resulting in 100% accuracy. However, it has been tested on a limited amount of test data consisting of 10 pertussis and 11 non-pertussis audio recordings. Further, the laboratory confirmation methods to obtain diagnosis in this data are not known. This is a limitation of the current preliminary study and further work is needed for validation with more data and known lab classification methods. If needed, the algorithm performance can also be enhanced by exploring the use of more features and improved intermediate classifiers. However, the use of more complex classifiers, such as neural networks, comes at the cost of added computational complexity. Depending on where the algorithm is to be implemented, certain feature extraction and classification methods can be computationally prohibitive. Additionally, when
Table 8. Performance of the algorithm for whooping sound detection using test data.
Case Diag Whoop TP TN FP FN Sen (%) Spe (%) PPV(%) NPV(%)
1 P Y 1 528 0 0 100.00 100.00 100.00 100.00 2 P Y 15 234 2 0 100.00 99.15 88.24 100.00 3 P N 0 99 0 0 - 100.00 - 100.00 4 P Y 1 113 0 2 33.33 100.00 100.00 98.26 5 P Y 4 165 0 0 100.00 100.00 100.00 100.00 6 P Y 1 565 0 1 50.00 100.00 100.00 99.82 7 P Y 0 640 0 5 0.00 100.00 - 99.22 8 P Y 0 229 0 1 0.00 100.00 - 99.57 9 P Y 5 127 2 1 83.33 98.45 71.43 99.22 10 P N 0 82 0 0 - 100.00 - 100.00 11 NP N 0 364 0 0 - 100.00 - 100.00 12 NP N 0 387 0 0 - 100.00 - 100.00 13 NP N 0 95 0 0 - 100.00 - 100.00 14 NP N 0 265 0 0 - 100.00 - 100.00 15 NP N 0 102 0 0 - 100.00 - 100.00 16 NP N 0 332 0 0 - 100.00 - 100.00 17 NP N 0 248 0 0 - 100.00 - 100.00 18 NP N 0 75 0 0 - 100.00 - 100.00 19 NP N 0 207 0 0 - 100.00 - 100.00 20 NP N 0 275 0 0 - 100.00 - 100.00 21 NP N 0 95 0 0 - 100.00 - 100.00 Total 27 5227 4 10 72.97 99.92 87.10 99.81
Diag—indicates whether recording has pertussis (P) or non-pertussis (NP) diagnosis. Whoop—indicates whether recording has whooping sound; Y—Yes; N- No. TP—true positives; TN—true negatives; FP—false positives; FN—false negatives. Sen—sensitivity; Spe—specificity; PPV—positive predictive value; NPV—negative predictive value.
implemented on a smartphone, a series of questions can be asked to obtain user input which can supplement the decision-making process for the diagnosis. These may include questions about the immunization status of an individual, clinical symptoms that vary by age, lifestyle-related information e.g. smoking habits, and questions about lifestyle-related prior problems.
While the main aim of the work presented in this paper is to target low-resource areas for diagnosing pertussis where clinical facilities are limited, it has other clinical and educational applications as well. It can be very useful to demonstrate and teach students the differences between various kinds of cough sounds. Further, it can be used for differential diagnosis of respiratory infections where symptoms of illnesses are similar. For example, pertussis cases may be misdiagnosed as bronchiolitis with further impacts such as missed antibiotic treat-ments. The use of our proposed method allows for the possibility of distinguishing between these two despite their similar symptoms otherwise.
Overall, the algorithm proposed in this paper achieves a high pertussis identification perfor-mance with simple classification methods. This shows that a pertussis cough can be automati-cally identified using its sound characteristics with a high degree of confidence and can be implemented on mid-range smartphones. This is particularly important in case of a whooping cough outbreak in locations where sophisticated laboratory tests and specialists may not be available. When implemented on a portable device, such as a smartphone or tablet, the algo-rithm can be extremely useful for quick identification or early screening of pertussis and for infection outbreaks control.
Table 9. Performance of the algorithm for pertussis diagnosis using test data.
Case Diag Whooping Sound Pertussis Cough Ratio Pertussis Identification
1 P 1 0.98 P 2 P 1 0.70 P 3 P 0 1.00 P 4 P 1 0.67 P 5 P 1 0.91 P 6 P 1 1.00 P 7 P 0 0.90 P 8 P 0 1.00 P 9 P 1 0.93 P 10 P 0 1.00 P 11 NP 0 0.00 NP 12 NP 0 0.50 NP 13 NP 0 0.00 NP 14 NP 0 0.00 NP 15 NP 0 0.22 NP 16 NP 0 0.00 NP 17 NP 0 0.46 NP 18 NP 0 0.25 NP 19 NP 0 0.25 NP 20 NP 0 0.00 NP 21 NP 0 0.33 NP
Diag—indicates whether recording has pertussis (P) or non-pertussis (NP) diagnosis.
Author Contributions
Conceptualization:ERV.
Data curation:RXAP SAI.
Formal analysis:RXAP SAI ERV.
Investigation:RXAP SAI ERV.
Methodology:RXAP SAI.
Project administration:ERV.
Resources:RXAP ERV.
Software:RXAP.
Supervision:SAI ERV.
Validation:RXAP SAI.
Visualization:RXAP SAI ERV.
Writing original draft:RXAP SAI.
Writing review & editing:SAI ERV.
References
1. NHS. Whooping cough—Symptoms; 2014. Available from: http://www.nhs.uk/Conditions/Whooping-cough/Pages/Symptoms.aspx
2. World Health Organization. Pertussis; 2016. Available from:http://www.who.int/immunization/topics/ pertussis/en/
3. Public Health Agency of Canada. Pertussis (whooping cough); 2016. Available from: http://www.phac-aspc.gc.ca/im/vpd-mev/pertussis-eng.php
4. Pew Research Center. Smartphone Ownership and Internet Usage Continues to Climb in Emerging Economies; 2016. Available from:http://www.pewglobal.org/
5. Martinek J, Tatar M, Javorka M. Distinction between voluntary cough sound and speech in volunteers by spectral and complexity analysis. J Physiol Pharmacol. 2008; 59(6):433–440. PMID:19218667
6. Barry SJ, Dane AD, Morice AH, Walmsley AD. The automatic recognition and counting of cough. Cough. 2006; 2. doi:10.1186/1745-9974-2-8PMID:17007636
7. Tracey BH, Comina G, Larson S, Bravard M, Lopez JW, Gilman RH. Cough detection algorithm for monitoring patient recovery from pulmonary tuberculosis. In: IEEE EMBC; 2011. p. 6017–6020. 8. Swarnkar V, Abeyratne UR, Amrulloh Y, Hukins C, Triasih R, Setyati A. Neural network based algorithm
for automatic identification of cough sounds. In: IEEE EMBC; 2013. p. 1764–1767.
9. Amrulloh YA, Abeyratne UR, Swarnkar V, Triasih R, Setyati A. Automatic cough segmentation from non-contact sound recordings in pediatric wards. Biomed Signal Process Control. 2015; 21:126–136. doi:10.1016/j.bspc.2015.05.001
10. Matos S, Birring SS, Pavord ID, Evans H. Detection of cough signals in continuous audio recordings using Hidden Markov Models. IEEE Trans Biomed Eng. 2006; 53(6):1078–1083. doi:10.1109/TBME. 2006.873548PMID:16761835
11. Liu JM, You M, Li GZ, Wang Z, Xu X, Qiu Z, et al. Cough signal recognition with Gammatone Cepstral Coefficients. In: 2013 IEEE China Summit and International Conference on Signal and Information Pro-cessing (ChinaSIP). IEEE; 2013. p. 160–164.
12. Lucio C, Teixeira C, Henriques J, de Carvalho P, Paiva RP. Voluntary cough detection by internal sound analysis. In: Biomedical Engineering and Informatics (BMEI), 2014 7th International Conference on; 2014. p. 405–409.
13. Larson EC, Lee T, Liu S, Rosenfeld M, Patel SN. Accurate and privacy preserving cough sensing using a low-cost microphone. In: 13th International Conference on Ubiquitous Computing, UbiComp’11 and the Co-located Workshops. Beijing, China; 2011. p. 375–384.
14. Chatrzarrin H, Arcelus A, Goubran R, Knoefel F. Feature extraction for the differentiation of dry and wet cough sounds. In: Medical Measurements and Applications Proceedings (MeMeA), 2011 IEEE Interna-tional Workshop on. IEEE; 2011. p. 162–166.
15. Swarnkar V, Abeyratne U, Chang A, Amrulloh Y, Setyati A, Triasih R. Automatic Identification of Wet and Dry Cough in Pediatric Patients with Respiratory Diseases. Ann Biomed Eng. 2013; 41(5):1016– 1028. doi:10.1007/s10439-013-0741-6PMID:23354669
16. Kosasih K, Abeyratne UR, Swarnkar V, Triasih R. Wavelet Augmented Cough Analysis for Rapid Child-hood Pneumonia Diagnosis. IEEE Trans Biomed Eng. 2014; 62(4):1185–1194. doi:10.1109/TBME. 2014.2381214PMID:25532164
17. Parker D, Picone J, Harati A, Lu S, Jenkyns MH, Polgreen PM. Detecting paroxysmal coughing from pertussis cases using voice recognition technology. PloS one. 2013; 8(12):e82971. doi:10.1371/ journal.pone.0082971PMID:24391730
18. Rabiner L, Juang BH. Fundamentals of speech recognition. Prentice Hall; 1993.
19. Brookes M. VOICEBOX: Speech Processing Toolbox for MATLAB; 2014. Available from:http://www. ee.ic.ac.uk/hp/staff/dmb/voicebox/voicebox.html
20. MathWorks. MATLAB and Simulink for Technical Computing; 2016. Available from:http://www. mathworks.com/
21. Scheirer E, Slaney M. Construction and evaluation of a robust multifeature speech/music discriminator. In: IEEE ICASSP. vol. 2. IEEE; 1997. p. 1331–1334.
22. Gillet O, Richard G. Automatic transcription of drum loops. In: IEEE ICASSP. vol. 4. IEEE; 2004. p. 269–272.
23. Peeters G. A large set of audio features for sound description (similarity and classification) in the CUI-DADO project. 2004;.
24. Thorpe W, Kurver M, King G, Salome C. Acoustic analysis of cough. In: Intelligent Information Systems Conference, The Seventh Australian and New Zealand 2001; 2001. p. 391–394.
25. Chung KF, Bolser D, Davenport P, Fontana G, Morice A, Widdicombe J. Semantics and types of cough. Pulmonary pharmacology & therapeutics. 2009; 22(2):139–142. doi:10.1016/j.pupt.2008.12. 008
26. Morice AH, Fontana GA, Belvisi MG, Birring SS, Chung KF, Dicpinigaitis PV, et al. ERS guidelines on the assessment of cough. European respiratory journal. 2007; 29(6):1256–1276. doi:10.1183/ 09031936.00101006PMID:17540788
27. Doherty M, Wang L, Donague S, Pearson M, Downs P, Stoneman S, et al. The acoustic properties of capsaicin-induced cough in healthy subjects. European Respiratory Journal. 1997; 10(1):202–207. doi:
10.1183/09031936.97.10010202PMID:9032516
28. Korpas J, Sadlonova J, Vrabec M. Analysis of the cough sound: an overview. Pulmonary pharmacol-ogy. 1996; 9(5):261–268. doi:10.1006/pulp.1996.0034PMID:9232662
29. Lalkhen AG, McCluskey A. Clinical tests: sensitivity and specificity. Continuing Education in Anaesthe-sia, Critical Care and Pain. 2008; 8(6):221–223. doi:10.1093/bjaceaccp/mkn041
30. Liu JM, You M, Wang Z, Li GZ, Xu X, Qiu Z. Cough detection using deep neural networks. In: 2014 IEEE International Conference on Bioinformatics and Biomedicine (BIBM). IEEE; 2014. p. 560–563. 31. Kosasih K, Abeyratne UR, Swarnkar V. High frequency analysis of cough sounds in pediatric patients
with respiratory diseases. In: IEEE EMBC; 2012. p. 5654–5657.
32. Abeyratne U, Swarnkar V, Triasih R, Setyati A. Cough Sound Analysis-A new tool for diagnosing Pneu-monia. In: IEEE EMBC. IEEE; 2013. p. 5216–5219.
33. Swarnkar V, Abeyratne UR, Amrulloh YA, Chang A. Automated algorithm for Wet/Dry cough sounds classification. In: IEEE EMBC; 2012. p. 3147–3150.
34. Al-khassaweneh M, Bani Abdelrahman R. A signal processing approach for the diagnosis of asthma from cough sounds. Journal of medical engineering & technology. 2013; 37(3):165–171. doi:10.3109/ 03091902.2012.758322