1
THE
EFFECTS
OF
SYLLABUS
DESIGN
ON
INFORMATION
RETENTION
BY
AT-RISK
FIRST
SEMESTER
STUDENTS
Evelyn Ann Mocek, Indiana University of Pennsylvania
INTRODUCTORY ESSAY
Researchers have examined and researched most aspects of the educational experience, however, one component has been neglected, the syllabus, specifically, the functional design of the syllabus. In architectural terms, there is a debate regarding form vs. function. In education research literature, the functionality of the syllabus has been researched much more than its form. Syllabi are a common element found across institutions of higher education; however, students are not necessarily reading or retaining this important information. Today's students communicate using multimodal means, such as through graphics and text. Whereas words and text are the primary sources of knowledge in academia, images function merely as illustrations. The following quantitative investigation explored whether an infographic syllabus design had an impact on the retention of course information presented in the syllabus.
The cognitive theory of multimedia learning (CTML) formed the theoretical framework for this study. A quasi-experimental approach was utilized where the control group received only the traditional text-based syllabus; and, the two experimental groups received an infographic addendum along with the traditional text-based syllabus. The students were tested both at three weeks and at ten weeks to determine if syllabus design impacted the retention of the syllabus information over time. Study participants were first-semester freshman at a regional campus primarily serving individuals identified as academically at-risk. A series of ANOVA tests were conducted to answer the following questions: (a) does syllabus design impact the retention of course syllabus information, (b) do graphics impact course syllabus information retention, and (c) does color impact course syllabus information retention? Statistical analysis indicates that both syllabus design and graphics promote the retention of syllabus information over time.
O
VERVIEW OF THEL
ITERATURE2
syllabus are designed to utilize the students’ multimodal learning preferences, would learning be enhanced?
S
YLLABUSO
VERVIEWA syllabus is a document that fulfills multiple roles within education. Syllabi are one of the oldest and most recognizable instructional tools and are an inherent and expected aspect of the college experience (Afros & Schryer, 2009; Fink, 2012; Husen & Postlethwaite, 1985). The definitions of ‘syllabus’ found within the literature research range from a broad definition to one with a narrow scope. This definition also varies from being geared toward the student’s role and activities, to one that guides the instructor. For this study, the definition is as an overall course plan for the student (Fink, 2012).
Syllabus research has primarily focused upon the discrete parts of a syllabus. A syllabus primarily is viewed as an outline for the student that demonstrates the efforts of the faculty member to plan and prepare a quality course (Berrett, 2012; Fink, 2012; Tokath & Kesli, 2009). Grunert (1997) outlined seventeen component parts that should be present in any syllabus. These components include the title page, a table of contents, instructor information, a letter to the students, the purpose of the course, course description, course and unit objectives, resources, readings, course calendar, course requirements, evaluation, grading procedures, instructions on how to use the syllabus and how to study for the course, content information, and learning tools (p. 24). These components are only a guide; therefore, the make-up of individual syllabi is highly variable (Afros & Schryer, 2009; Sidorkin, 2012). What generally is not acknowledged is that much of the content in a syllabus, such as student learning objectives, are handed down from one generation of faculty to another (Cardozo, 2006).
When considering syllabi, it is important to understand that they serve multiple audiences and purposes. Syllabi are basic to teaching; however, they are as individualistic as the instructors who create them (Rubin, 2013; Sidorkin, 2012; Wasley, 2008). They play an important role, not only in teaching and learning, but also serve as documentation of scholarly excellence to a variety of entities both within and outside the institution (McDonald, Siddal, Mandell, & Hughes, 2010; Sidorkin, 2012; Snyder, 2002). When the critical function of the syllabus, as identified by the faculty, is contrasted with the student’s learning preference, a disconnection is evident. Instructors use the syllabus to define learning outcomes, identify how those outcomes will be assessed, and what specifically must be accomplished to successfully complete the course (Afros & Schryer, 2009; Becker & Calhoon, 1999). Instructors are focused on pedagogical concerns and anticipate a deep study of the course material. Students, on the other hand, take a surface approach and are more focused upon tangible items such as the layout of information and format (Price, 2007). Students prefer a syllabus they can navigate through quickly so they can determine if they want to stay in the course. The preferred syllabus design highlights key items of interest such as how grades are calculated, and does not include information that can be obtained through other sources, such as withdrawal policies (Becker & Calhoon, 1999; Brink, 2009; McDonald et al., 2010).
M
ILLENNIALS
TUDENTS ANDT
ECHNOLOGY3
For this paper, the term millennial will be used. Millennials make up the largest cohort of students currently enrolled in US colleges and universities; however, this group is not homogenous. They are very diverse in their skills, their educational needs, and their expectations (Bennet, 2012; Hartman & McCambridge, 2011).
Of interest in this study are the millennial students who have been identified as “at-risk.” The No Child Left Behind Act (2002) established parameters for the determination of academic rigor (Schnee, 2008). These students are individuals with contributing factors that can and do impact retention. There is not one single definition or standard for the determination of who are classified as “at-risk” or under prepared (Mulvey, 2009). The factors for student non-completion include ethnicity, disability, socioeconomic status, low standardized testing scores, mental health issue, and first generation students (O’Keeffe, 2013). The ability of an individual to assume the role of a higher education student is critical to retaining them beyond the first year, especially those classified as “at-risk”. A challenge is that “at-risk” students deal with a combination of high levels of stress and poor self-worth as they are low-achieving comparative to peers (Sandoval-Lucero, 2014; Weisburg, Hirsh-Pasek, Golinkoff, & McCandliss, 2014).
It is a digital world; therefore, millennial students have had more technological exposure than previous generations and are generally more connected via technology. Millennials have always had access to their technologic gadgets, including cell phones and computers, and are lost without access to them (Department of Education, 2010; Scheid & McDonough, 2010; Worley, 2011). As they are so technologically attuned, this impacts both the type and manner of communication they prefer (Bracy et al., 2010; Geck, 2006; Hartman & McCambridge 2011; Howard, 2011; Sweeney, 2006). This shift is directly related to the nature of technology and how millennials utilize technology to absorb information (Hummerston, 2008; Spalter & van Dam, 2008). While millennials learn to contend with their limitless options, their attention span has decreased significantly, as they quickly sort through enormous amounts of information (Finch, 2015). Finch (2015) indicates that this group has developed what he terms as ‘eight-second’ filters, where they turn to compilation or trending pages within apps to collect information to be consumed in a finite amount of time.
M
ULTIMODALC
OMMUNICATION4
For learning and retention of the material to occur, information must be organized into a logical framework that allows for generalization of observation and the creation of a context with prior learning into memory (Mayer, 2014; Nilson, 2007). A syllabus designed using both text and graphics should help students to clarify the logical flow of concepts and various relationships within the information will be highlighted, ultimately promoting the integration of that information into new knowledge (Nilson, 2007; Levitin, 2014; Restak, 2003).
C
OGNITIVET
HEORY OFM
ULTIMEDIAL
EARNINGA number of theoretical frameworks were considered for this study including visual literacy, information processing theory, dual coding theory, working memory theory, and cognitive load theory. The cognitive theory of multimedia learning (CTML) incorporates many of the principles and functions from these various other theories. However, it also expands to address specific aspects related to multimodal communication. In the CTML, Richard Mayer specifically defines multimedia as a message that is presented utilizing both pictures and words designed to foster learning (Mayer, 2002; Mayer, 2014). This theory is concerned with bimodal or multimodal message design, however, terms it a multimedia. There is a direct relationship between what we see and process, with what we think (Moore, 2003). The CTML addresses how an educational message is presented, specifically combining pictures and text in a manner that fosters information retention and learning (Mayer, 2002; Mayer, 2014). This theory was the foundation for this study as it addresses both message design and the impact of design on long-term retention and recall of information. The primary assumption of the CTML is that individuals achieve a deeper understanding and retention of information when it is presented utilizing both verbal and pictorial representations (Mayer, 2002; Mayer, 2014). The major focus of instruction is to expand the knowledge of the student and encourage that knowledge to be stored within long-term memory. When information is presented using a multimodal framework, the students learn in a deeper fashion, with more information stored in long term memory, than when the information is from a single source— specifically verbal (Mayer, 2002). The assumption is that when materials are presented both verbally— text-based (written or spoken), and pictorially—pictures/graphics/videos/animations, the learner has twice the opportunity and exposure to the information and is able to use two information processing systems to retain the data (Mayer, 2014).
The one theme noted in much of the literature is that the provision of materials in a multimodal manner is both desired and expected by millennial students. Multimodal information has had strong pedagogical support as a preferred teaching method for children since the first pictorial instruction book in 1658 by Comenius titled Orbis Pictus (Mayer, 2014). The issue is that education, especially higher education, is bound by tradition, so the predominant manner of presenting information remains via one mode— verbal or text-based (Greenfield, 2003; Mayer, 2014).
5
fully understood when applied to the syllabus.
M
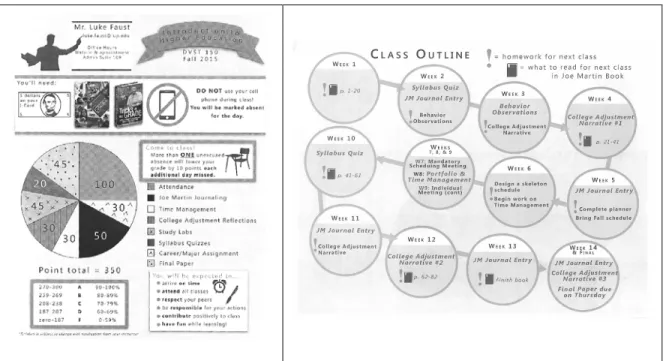
ETHODSThis experimental study’s purpose was to examine if an infographic syllabus addendum (as a graphic organizer) would increase the retention of syllabus information. The expectation was that the information presented as an infographic supported a student’s ability to organize, and helped promote course information retention into their long-term memories. As the syllabus is a common element in most higher education courses, it was selected as the modality of investigation. To protect the students participating in the study, all received the traditional text-based syllabus. The treatment was an infographic syllabus addendum addressing specifically on the items identified in the literature that students focus upon within a syllabus (Figure 1). Becker and Calhoon (1999); Iannarelli, Bardsley and Foote (2010); and McDonald et al. (2010) each indicated that what students’ focus upon are exam dates, course schedule, assignments and student responsibilities, grading criteria and course expectations. The treatment was created using CTML principles, along with infographic design features and the syllabus textual requirements. This investigation was primarily concerned with the following research question: What are the effects of an infographic syllabus design on information retention by “at-risk” first-semester freshman students?
Figure 1: Infographic syllabus treatment (black and white)
6
students’ retention of the information within the syllabus. This infographic was distributed to the students in the experimental groups (n=71), along with the text-based syllabus. There were two infographic addendums, both had the exact same information. The only difference between the two infographics was color, one was in black and white, while the other was in color.
TABLE 2:SECTION WHERE SUBJECTS WERE RECRUITED
Treatment Day/Time Of Class
# in Sample
Black & white infographic Monday/9:05 19
Black & white infographic Monday/10:10 15
Text only (control) Tuesday/12:30 27
Color infographic Wednesday/9:05 19
Color infographic Wednesday/10:10 18
TABLE 2:DESCRIPTION OF THE STIMULI
Group Treatment
Control Text-based syllabus only (Text)
Treatment 1 Text-based syllabus and black and white infographic (B&W)
Treatment 2 Text-based syllabus and color infographic (Color)
There were two identical 20 point, paper-based, multiple choice quizzes (posttests) scheduled as part of the course requirements. The same quiz was given during both scheduled test sessions. The order of the test questions was changed for each class to augment academic integrity. The first quiz was given the third week of class (originally scheduled for week two but a death in the faculty member’s family delayed testing by one week); and, the second was given in week ten. This timeframe was chosen to examine long-term memory, both within a shorter timeframe and over an extended period of time. The overall goal of this study is two-fold. The first goal is to examine the impact of syllabus design on the germane cognitive load or the construction of new knowledge. In other words, were students learning what they were supposed to learning about course information? The secondary goal was the retention of internal schemas into long-term memory; or, in other words, how long will students retain pertinent course information?
R
ESULTS/F
INDINGS7
H1. Graphics increases a student’s course information retention. H2. The design of a syllabus improves retention of course information. H3. The use of color supports course information retention.
The results in Table 3 indicate a statistical significance supporting the hypothesis that graphics influence students’ retention of information. The significant Welch’s F-test (p=.028), indicates that students demonstrate greater long-term retention of the material when it is presented in a multimodal manner incorporating graphics to support the text. For the intermediate time-frame (3 weeks), the hypothesis was not supported as the Analysis of Variance (ANOVA) was not statistically significant (Table 4). The significance was found only for quiz two (ten weeks) indicating that graphics do have a long-term impact on the students’ retention of information but not for retention over a shorter time-period.
TABLE 3:GRAPHICS AND INFORMATION RECALL AT 10WEEKS
Graphics present N Mean Std. Dev. Std. Error Welch’s F Significance
No 25 15.920 1.9774 .3955 F=5.183
df=1,82 p = .028* Yes 59 16.983 1.9073 .2483
Total 84 16.667 1.9778 .2158
Note: Levene’s = .032 (df=1,82) p = .858
TABLE 4:GRAPHICS AND INFORMATION RECALL AT 3WEEKS
Graphics present N Mean Std. Dev. Std. Error F-value Significance
No 26 14.423 1.9631 .3850 F=2.902
df=1,82 p = .092 Yes 60 15.283 2.2254 .2873
Total 86 15.023 2.1746 .2345
Note: Levene’s = .112 (df=1,84) p = .739
8 TABLE 5:SYLLABUS TYPE AND RECALL AT 10WEEKS
Syllabus Type N Mean Std. Dev. Std. Error Welch’s F Significance
Text 25 15.920 1.9774 .3955
F=3.323
df=2,50 p=.044* Black & White 32 16.875 2.3521 .4158
Color 27 17.111 1.2195 .2347
Total 84 16.667 1.9778 .2158
Note: Levene’s = 5.990 (df=2,81) p = .004
The results in Table 6, however, indicate that at the shorter timeframe (3 weeks), there was no significant difference (p=.176) in the recall of information between the control and experimental groups. Both treatment groups had higher mean scores than the text-based control. While the mean score for both groups that received the infographic addendum was higher than the students that received the text-only syllabus, the relatively large standard deviations indicate a great degree of variability within groups. While not statistically significant, it is interesting to note that the students who received the black and white addendum had the highest mean score, leading to questions concerning the impact of color on recall.
TABLE 6:SYLLABUS TYPE AND RECALL AT 3WEEKS
Syllabus Type N Mean Std. Dev. Std. Error F-value Significance
Text 26 14.423 1.9631 .3850
F=1.76
df=(2,83) p=.176 Black & White 29 15.517 2.2932 .4258
Color 31 15.065 2.1746 .3906
Total 86 15.023 2.1746 .2345
Note: Levene’s = .689 (df=2,83) p = .505
9
run to address this inequality. The premise that color affects information retention was not supported.
TABLE 7:COLOR AND INFORMATION RECALL ON QUIZ 1(EXCLUDING TEXT-BASED SYLLABUS)--ANOVA
Color N Mean Std. Dev. Std. Error F-value Significance
No 29 15.517 2.2932 .4258 F=.601
df=1,58 p = .436 Yes 31 15.065 2.1746 .3906
Total 60 15.283 2.2254 .2873
Note: Levene’s = 1.133 (df=1,58) p = .292
TABLE 8:COLOR AND INFORMATION RECALL ON QUIZ 2(EXCLUDING TEXT-BASED SYLLABUS)--ANOVA
Color N Mean Std. Dev. Std. Error Welch’s F Significance
No 29 15.517 2.2932 .4258 F=.245
df=1,48 p = .623 Yes 31 15.065 2.1746 .3906
Total 60 15.283 2.2254 .2873
Note: Levene’s = 13.106 (df=1,57) p = .001
Of note, both treatment groups, those who received the infographic addendum whether black and white or color, scored higher on both quizzes than the text-only control group (See Table 9). All groups had an improved mean score on the second quiz. The control group’s mean grade on quiz two was a 79.6 % or a high C grade, whereas the treatment groups were 83.8% or higher or a B grade. Granted, students had completed a large portion of the course by week ten; however, the results of this study suggest that the manner which information is presented does impact the retention of the material. It is noted that the mean grade at week ten for the sections that had the color infographic had the largest percent improved, suggesting color may have an impact that is difficult to statistically quantify.
TABLE 9:QUIZ AVERAGE SCORES
Treatment Day/Time
Of Class Quiz 1
Mean
Grade Quiz 2
Mean Grade
% grade Improved
B&W Monday/9:05 15.35 76.8% 16.89 84.4% 7.6%
B&W Monday/10:10 15.75 78.8% 17.20 86.0% 7.2%
10
Color Wednesday/9:05 14.94 74.7% 17.64 88.2% 13.5%
Color Wednesday/10:10 15.21 76.0% 16.75 83.8% 7.8%
Note – A total of 20 points possible for each quiz.
The sample size for this study was limited to the single class. When the size effect is examined, the observed power level was modest for both quiz one and quiz two; although, there was an improvement noted for quiz two. However, the partial eta squared for both quizzes was low (See Table 10). This suggests that other factors beyond the design of the syllabus also influence course information retention. The literature suggests factors such as student age, GPA, class rank, SAT scores, time of the semester and if students are first generation or non-traditional may play an additional role (Becker, & Calhoon, 1999; Wasley, 2008). This is an area for future study.
TABLE 10:SIZE EFFECT/POWER LEVEL
df Squared Mean F Sig Partial Eta Squared
Observed Power
Quiz one 2 18.690 2.809 0.066 0.063 0.538
Quiz two 2 24.586 3.892 0.024 0.087 0.688
C
ONCLUSIONSThis study found that both the use of graphics and an infographic syllabus addendum did impact student retention of the material over the long term. The infographic syllabus addendum was designed specifically to address information identified in prior research as important to students. The infographic specifically highlighted each of these points in a multimodal format.
11
L
IMITATIONSWhile this study produced some statistically significant results, there were also limitations to be considered. The study did not utilize all the principles of cognitive theory of multimedia learning; however, it did match the overarching framework. The presentations were not what is traditionally considered multimedia i.e. animation or computer-based. However, the materials were multimodal in presentation, with a combination of pictures and text and used in conjunction with verbal descriptions. The study did meet the criteria outlined by Mayer (2014) within his multimedia principle – use of words and pictures rather than words alone. The use of a hyperactive multimedia syllabus addendum represents an area for future research.
This study utilized a representative sample of the total population of at-risk students from a regional branch campus of a large, mid-eastern US research institution (49%); however, this population is not reflective of the general population of traditional college freshman. The use of a specific population of students classified as academically at-risk does limit the generalizability of the results to a larger group. Conversely, if students who are academically underprepared can increase retention of information using a multimodal syllabus format, all students may be equally supported. A follow-up study is in process, which expands the sample population beyond “at-risk” students and includes a general population of traditional students across a variety of disciplines.
The posttest format of the study had limitations in that students were aware of the scheduled time for the posttests. Students had the opportunity to refresh their memories of the syllabus information prior to the scheduled quizzes. To limit the confounding variable of refreshed knowledge, “pop” quizzes or unexpected testing of knowledge would be more reflective of long-term retention of information. This would provide a more rigorous examination of information retention both at the three-week and ten-week timeframe.
This study examined the effects of an infographic syllabus on a specific population, namely novice students who have been designated as “at-risk”. Further research should be conducted examining the effects on both traditional college students, as well as non-traditional students e.g., older than 25. Additionally, factors including class rank, GPA, age etc. should be examined in conjunction with the infographic to determine their impact on information retention. Further research is underway into the effectiveness of infographic syllabus addendum with students in a variety of course topics and disciplines over the course of a semester. Additionally, the effectiveness of infographics on the long-term retention of a variety of course content as reflected in overall course success will be examined. The creation of an infographic does take time and effort by the faculty. In the context of this study, the faculty would have to plan an innovative design for the syllabus addendum via the use of an infographic, however not necessarily for the syllabus itself. Higher education is mired in tradition; however, in the case of the syllabus, that tradition’s effectiveness has not been studied. This research has begun an examination of the form of syllabus design and its impacts on the functional use of the syllabus, its effectiveness, and the impact of multimodal methods of communication on the retention of information.
12 information. The study participants were academically underprepared; and, they had increased retention. This suggests potential for all students. A syllabus, as highlighted through the literature, serves multiple roles for the student, instructor, program, and educational institution. The provision of an infographic addendum, specifically focused on what is viewed as important to students, while preserving the traditional text-based syllabus to serve the additional needs of the instructor, program and institution is a win-win for both students and higher education.
Bibliography
Afros, E., & Schryer, C. F. (2009). The genre of syllabus in higher education. Journal of English for Academic Purposes, 8(3), 224-233.
Becker, A. H., & Calhoon, S. K. (1999). What introductory psychology students attend to on a course syllabus. Teaching of Psychology, 26(1), 6-11.
Bennet, S. (2012). Digital Natives. In Z. Yan (Ed.) Encyclopedia of Cyber Behavior, Volume 1. pp 212-219. United States: IGI Global.
Berrett, D. (2012). A new journal brings peer review to the college syllabus. The Chronicle of Higher Education, June 19, 2012.
Boutin, J. F., Lacelle, N., Lebrun, M., & Lemieux, N. (2013). Analyzing students’ comprehension of multitexts: The mobilization of images (visual mode) in the language classroom. The International Journal of the Image, 3(4), 69-78.
Bracy, C., Bevill, S., & Roach, T. D. (2010, July). The millennial generation: Recommendations for overcoming teaching challenges. In Proceedings of the Academy of Educational Leadership, 15(2), 21-25.
Brink, T. L. (2009). Review of book The Graphic Syllabus and the Outcomes Map: Communicating Your Course, by Linda B. Nilson. Teaching Theology & Religion, 12(3), 292-294.
Burmark, L. (2002). Visual Literacy: Learn to See, See to Learn. Alexandria, VA: Association for Supervision and Curriculum Development.
Cardozo, K. M. (2006). At the museum of natural theory: The experiential syllabus (or, what happens when students act like professors). Pedagogy: Critical Approaches to Teaching Literature, Language, Composition, and Culture, 6(3), 405-433.
Davis, A. (2013). Improving multimedia foundations: Design of a micro-syllabus for integrating multimedia modules into college courses at the University of Delaware. (Doctoral dissertation). Retrieved from ProQuest Digital Dissertations. (AAT 3612973)
Department of Education (2010). Transforming American education: Learning powered by technology: National Education Plan 2010. Washington, D.C.: Education Publications Center.
13
Eitel, A., Scheitier, K., Schuler, A., & Nystrom, M. (2013). How a picture facilitates the process of learning from text: Evidence for scaffolding. Learning and Instruction, 28, 48-63.
Erfani, S. M. (2012). Pictures speak louder than words in ESP, too! English Language Teaching, 5(8), 164-169.
Fink, S. B. (2012). The many purposes of course syllabi: Which are essential and useful? Syllabus, 1(1). Online journal - http://www.syllabusjournal.org/article/view/10147
Finch, J. (2015, August 8). What is Generation Z, and what does it want? [Web log comment]. Retrieved July 27, 2014 from http://www.fastcoexist.com/3045317/what-is-generation-z-and-what-does-it-want.
Fornaciari, C. J., & Dean, K. L. (2014). The 21st-century syllabus: From pedagogy to andragogy. Journal of Management Education, 38(5), 701-723.
Geck, C. (2006). The Generation Z Connection: Teaching Information Literacy to the Newest Net
Generation. Retrieved October 5, 2013, from
http://www.redorbit.com/news/technology/397034/the_generation_z_connection_teaching_in formation_literacy_to_the_newest/
Greenfield, S. (2003). Tomorrow’s People: How 21st-Century Technology is Changing the Way We Think and Feel. London, England: Penguin Books
Grunert, J. (1997). The Course Syllabus: A Learning-centered Approach. Bolton, MA: Anker Publishing Company, Inc.
Hartman, J. L., & McCambridge, J. (2011). Optimizing millennials' communication styles. Business Communication Quarterly, 74(1), 22-44.
Helsper, E., & Eynon, R. (2010) Digital natives: Where is the evidence? British Educational Research Journal, 36(3), 503-520.
Hoadley, E. (1990). Investigating the effects of color. Communications of the ACM, 33(2), 120-125.
Howard, E. A., (2011). How do Millennial Engineering and Technology Students Experience Learning Through Traditional Teaching Methods Employed in the University Setting? Department of Computer Graphics Technology Degree Theses. http://docs.lib.purdue.edu/cgttheses/1
Hummerston, A. (2008, December). Digital world digital life. Retrieved June 8, 2012 from http://www.tnsglobal.com/assets/files/TNS_Market_Research_Digital_World_Digital
Husen, T., & Postlethwaite, N. T. (1985). International Encyclopedia of Education: Research and Studies
(Vol. 8). Pergamon Press.
Iannarelli, B. A., Bardsley, M. E., & Foote, C. J. (2010). Here’s your syllabus, see you next week: A review of the first day practices of outstanding professors. The Journal of Effective Teaching, 10(2), 29-41.
Lamberski, R. J. (1980, May). A comprehensive and critical review of the methodology and findings in color investigations. Presented at the Annual Convention of the Association for Educational Communications and Technology, 338-380, Denver, CO.
14
information acquisition and retrieval. Educational Communication and Technology, 31(1), 9-21. Levitin, D. (2014). The Organized Mind: Thinking Straight in the Age of Information Overload. Penguin
Group, US. (Kindle Edition)
Margaryan, A., Littlejohn, A., & Vojt, G. (2011). Are digital natives a myth or reality? University students’ use of digital technologies. Computers & Education 56(2), 429–440.
Mayer, R. E. (2002). Cognitive theory and the design of multimedia instruction: An example of the two-way street between cognition and instruction. New Directions for Teaching and Learning, 89, 55-71.
Mayer, R. E. (2014). Multimedia Learning. New York: Cambridge University Press.
McDonald, J., Siddal, G., Mandell, D., & Hughes, S. (2010). Two sides of the same coin: Student-faculty perspectives of the course syllabus. Collected Essays on Learning and Teaching, 3, 112-118. McGee, J. B. (nd). Teaching Millennials [PowerPoint presentation]. Retrieved November 11, 2014 from
www.ame.pitt.edu/documents/McGee_Millennials.pdf
Moore, K. (2003). Overlooking the visual. The Journal of Architecture, 8(1), 25-40.
Nilson, L. B. (2007). The Graphic Syllabus and the Outcomes Map: Communicating Your Course. San Francisco, CA: Jossey-Bass.
O’Keeffe, P. (2013). A sense of belonging: Improving student retention, College Student Journal, 47(4), 605-613.
Prensky, M. (2009). H. Sapiens Digital: From digital immigrants and digital natives to digital wisdom.
Journal of Online Education, 5(3). Retrieved October 29, 2015 from http://eric.ed.gov/?id=EJ834284
Price, L. (2007). Lecturers’ vs. students’ perceptions of the accessibility of instructional materials.
Instructional Science, 35(4), 317-341. DOI 10.1007/sl11251-006-9009-y.
Restak, R. (2003). The New Brain: How the Modern Age is Rewiring Your Mind. New York, NY: Rodale. Rubin, S. (2013). Professors, students, and the syllabus. Retrieved on September 18, 2013 from
www.colorado.edu/gtp/2013/01/29/professors-students-and-syllabus.
Sandoval-Lucero, E. (2014). Serving the developmental and learning needs of the 21st century diverse college student population: A review of literature. Journal of Educational and Developmental Psychology, 4(2), 47-64.
Scheid, J., & McDonough, M. (2010). Types of communication styles: Bridging the generation gap.
Retrieved September 21, 2013 from http://www.brighthub.com/office/home/articles/76498.aspx
Schnee, E. (2008) “In the real world no one drops their standards for you”: Academic rigor in a college worker education program. Equity and Excellence in Education, 41(1). 62-80.
Serafini, F. (2012). Expanding the four resources model: Reading visual and multimodal texts.
15
Snyder, J. A. (2002). Brief history of the syllabus with examples. Derek Bok Center for Teaching and Learning Harvard University. Retrieved July 11, 2011 from http://isites.harvard.edu/fs/html/icb.topic58495/syllabushistory.html.
Spalter, A. M., & van Dam, A. (2008). Digital visual literacy. Theory Into Practice, 47(2), 93-101.
Sweeney, R. (2006). Millennial Behaviors & Demographics. Retrieved from: http://certi.mst.edu/media/administrative/certi/documents/Article-Millennial-Behaviors.pdf Thompson, B. (2007). The syllabus as a communication document: Constructing and presenting the
syllabus. Communication Education, 56(1), 54-71.
Tolkatli, A. M., Kesli, Y. (2009). Syllabus: How much does it contribute to the effective communication with the students? Procedia Social and Behavioral Sciences, 1(1), 1491-1494.
Wasley, P. (2008). The syllabus becomes a repository of legalese. The Chronicle of Higher Education 54(27). Retrieved September 15, 2013 from http://chronicle.com/article/The-Syllabus-Becomes-a/17723
Weisburg, D. S., Hirsh-Pasek, K., Golinkoff, R. M., & McCandliss, B. D. (2014). Mise en place: setting the stage for thought and action. Trends in Cognitive Sciences, 18(6), 276-278.
DO NOT
use your cell
phone during class!
You will be marked absent
for the day.
*Syllabus is subject to change with notification from your instructor
D V S T 1 5 0
F a l l 2 0 1 5
A
B
C
D
F
9 0 - 1 0 0 %
8 0 - 8 9 %
7 0 - 7 9 %
6 0 - 6 9 %
0 - 5 9 %
More than
ONE
unexcused
absence will lower your
grade by 10 points
each
additional day missed.
C o m e t o c l a s s !
More than
ONE
unexcused
absence will lower your
grade by 10 points
each
additional day missed.
C
o m e t o c
l
a s s
!
Yo u w i l l b e e x p e c t e d t o . . .
arrive
on time
attend
all classes
respect
your peers
be
responsible
for your actions
contribute
positively to class
have fun
while learning!
Attendance
Joe Mar tin Journaling
Time Management
College Adjustment Reflections
Study Labs
Syllabus Quizzes
Po i n t t o t a l = 3 5 0
O f f i c e H o u r s Wa l k- i n & a p p o i n t m e n t
A d m i n S u i t e 1 0 9
Yo u ’ l l n e e d :
1 0 0
3 0
3 0
4 5
4 5
5 0
Career/Major Assignment
2 0
2 7 0 - 3 0 0
2 3 9 - 2 6 9
2 0 8 - 2 3 8
1 8 7 - 2 0 7
z e r o - 1 8 7
Final Paper
= homework for next class
= what to read for next class
in Joe Mar tin Book
C
L A S S
O
U T L I N E
Behavior
Obser vations
p. 1-20
JM Journal Entr y
p. 21-41
College Adjustment
Narrative
Complete planner
Design a skeleton
schedule
Bring Fall schedule
W
E E K1
W
E E K2
W
E E K3
W
E E K4
W
E E K5
W
E E K6
p. 62-82
W
E E K S7 , 8 , & 9