*Correspondence to Author:
Chenghang Cao
College of Economics and Management, China Three Gorges University, Yichang, 443002, China.
How to cite this article:
Chenghang Cao, Zhang Liu, Jiajin Lei, Xiaoxiong Zuo, Lei Liu. Study on the Impact of Climate Change on Regional Instability. International Journal of Social Research, 2019; 3:27
eSciPub LLC, Houston, TX USA. Website: http://escipub.com/
Chenghang Cao et al., IJSR, 2019; 3:27
International Journal of Social Research
(ISSN:2576-5531)
Research Article IJSR (2019) 3:27
Study on the Impact of Climate Change on Regional Instability
In this paper we will discuss the problem on how the regional instability of a country can be affected by the climate change. Based on the data collected about the national vulnerabilities, we select fifteen indicators by the principal component analysis. A new three-level indicator system is then established to assess the country’s vulnerability. To obtain and optimize the weight for each indicator used at different levels, the Analytic Hierarchy Process (AHP) and Gray Relational Analysis (GRA) are used. Based on this work, a measurement system including the climate, economic, security, politics and human development is set up to measure the vulnerability of the country.
Keywords: Climate change; Regional instability; Three-level indicator system
Chenghang Cao1*, Zhang Liu2, Jiajin Lei3, Xiaoxiong Zuo2, Lei Liu2
1College of Economics and Management, China Three Gorges University, Yichang, 443002, China. 2College of Medicine, China Three Gorges University, Yichang, 443002, China.
3College of Hydraulic and Environmental Engineering, China Three Gorges University, Yichang, 443002, China.
1. Introduction
Since the beginning of 21st century, the theory of the fragile state has been gradually rising in the west. The study of the national fragility has become a basic core issue for the western aca-demia to discuss the issue of world develop-ment. As to the nature of vulnerability, many sc- holars have some disagreements. Some schol-ars believe that vulnerability is an important at-tribute of the coupling system (social-ecosys-tem, human-environment coupling system) whi- le Mitchell J. Erte and Bohle H. G [1] believes
that vulnerability includes response ability and exposure to external disturbances and shocks of the system. On the contrary, GallopinG.G be-lieves that exposure is not a component of vul-nerability, which is combined with the sensitivity and coping ability to disturbance from the out-side world, etc. Based on the understanding of different concepts of vulnerability proposed by different scholars [2], vulnerability is defined as
a property of the structure and function of the system that is susceptible to changes due to the sensitivity of the system to disturbances both from inside and outside of the system as well as the lack of coping ability. Only when the system is disturbed does this property show that the in-ternal characteristics of the system is the direct and main reason that leads to the fragility of the system, while the interaction between the dis-turbance leading to the system enlarges or re-duces the fragility of the system is the indirect and forcing reason for the change of the system vulnerability. The indirect and forcing reason works by influencing the internal characteristics of the system so that changes take place, which ultimately reflects external sensitivities and cop-ing skills. Therefore, the vulnerability of a coun-try can be defined as: "Those governments are unwilling or unable to exercise their core func-tions for the majority of their people." Countries can be classified into three states of stable, vul-nerable and very vulvul-nerable.
As is well known, climate change [3] may have
some impact on the region, including glacier
shrinkage, increased droughts, sea level rise, and the scope of flora and fauna changes. The- se changes vary region by region. The Intergov-ernmental Panel on Climate Change claimed climate change [4] is likely to be far-reaching and
influential, and that those changes will change the way humans live and may lead to the break-down and collapse of social and government structures [5]. An unstable government system,
on the other hand, may increase national vul-nerability and put the country in crisis. There-fore, the relationship between vulnerable coun-tries under climate change is worth studying. Climate change may not only directly lead to the change of national vulnerability, but also indi-rectly affect the national vulnerability through economic, war, political and other factors. Solo-mon M. Hsiang [6] studied the global non-linear
effect of temperature on economic production and found that economic productivity would rise with the annual average temperature and peaks at 13 degrees Celsius. When the average an-nual temperature exceeds 13 degrees Celsius, economic productivity will decline. Marshall B. Burke et al. [7] found that there was a strong
his-torical link between the civil war and the tem-perature in Africa. Climate warming makes the possibility of war greatly increased, see, for ex-ample, Mark A [8]. Cane and the others
pre-dicted the future war on the history of the tem-perature. It is estimated that by 2030, the inci-dence of armed conflicts in Africa will increase by about 54%, resulting in 393,000 deaths. Cli-mate change will cause turmoil in the country and the stability of the country will face a severe test. The government climate change special committee (IPCC) [9] stressed that the melting of
and effective system to quantify the impact of climate change on national vulnerability.
2. The main indicator system
There are many factors that affect a country's vulnerability [10]. In order to "describe the
con-cepts with as few constitutional elements as po- ssible, determine the conceptual logic, and avo- id unnecessary or mixed concepts," we carry out a general analysis of the different indicators of vulnerability and score the selected indica-tors. The following three steps are mainly taken: systematization of the concept of vulnerability, selection of the index of vulnerability and calcu-
lation of the final score.
The initial choice of the third-level indicato- rs: With reference to the country external vul-nerability indicator description, considering the need to take climate change into consideration
[8], climate and environmental relevance, and
the merger of population and human develop-ment, the concept of vulnerability can be sys-tematized into five categories of indicators, na- mely, security and crime, economics, politics, human development and climate [11]. We will
se-lect fifteen major third-level indicators, which are specified as follows:
Indicator Name Indicator Description Indicator Source Types
Conflict intensity Annual sum for INT (intensity)
variable UCDP/PRIO Armed Conflict Dataset Security and crime(SAC) Human Rights –
Em-powerment Empowerment Rights Index CIRI Human Rights Index Security and crime(SAC) Political Stability Political stability/no violence,
point estimate World Governance Indica-tors
Security and crime (SAC) GDP per capita GDP per capita (constant
2005 US $) World Development Indica-tors Economic(EN) Percentage of GDP GDP Growth % World Development
Indica-tors Economic
(EN)
Inflation Inflation, consumer prices (an-nual %)
World Development
Indica-tors Economic
(EN)
Government
Effec-tiveness Government effectiveness, point estimate World Governance Indica-tors Politics(PT ) Level of Corruption (CPI)Corruption
Percep-tions Index (CPI)
Transparency International Politics(PT )
Level of Democracy POLITY2 – Net
Democ-racy/Autocracy score Polity IVIV Politics(PT ) Gender Inequality Gender Inequality Index HDR
UNDP HDR
Human Development (HDP) Human Development
Index Human Development Index UNDP HDRHDR Human Development(HDP) Population Density Population density (people per
sq. km) World Development Indica-tors Human Development (HDP)
Temperature Average annual temperature Climate Change Knowledge
Portal Climate
(CA)
Rainfall The average annual rainfall Climate Change Knowledge
Portal Climate(CA) Extreme natural
dis-aster
Annual natural disasters sum Climate Change Knowledge
Portal Climate
(CA)
3. Weight analysis 3.1 De-dimensional data
As the dimensions of the indicators are not uni-fied, firstly we process all the indicators based on dimension 10, the absolute value of each
indicator is then transformed into a relative va- lue, finally, the standardized processing for CO- STTYPE indicators, efficiency indicators and moderate indicators of data is applied. We intro-duce the following three indexes:
' ' ' '
min max min
( ) ( ( ) ( ) / ( ( ) ( ) ) 10
ik ik ik
X j = X j −X j X j −X j
Cost-type index
' ' ' '
max max min
( ) ( ( ) ( )) / ( ( ) ( ) ) 10
ik ik ik
X j = X j −X j X j −X j
Moderate-type index
(
)
(
)
' ' ' '
1 1 min max 2 1
'
1
' ' '
1 1 min max 1
1 ( ) max ( ) , ( ) ( )
( ) 0 ( )
1 ( ) max ( ) , ( )
ik ik
ik ik
ik
s X j s X j X j s X j s
X j X j s
X j s s X j X j s
− − − − = = − − − − ' 1
Xik( )j s
where subscript i indicates the national ordinal
numbers, jindicates the ordinal of the metric, k indicates the number of time series, X j'( )max
indicates item j maximum value of the metric, '
min
( )
X j indicates item jminimum value of the
metric, andXik( )j indicates inkyear the value
of the item i j after normalized metric.
3.2 The weight of AHP analysis
In order to streamline and optimize the indica-tors in a better way, AHP selected 1-9 scales to construct a judgment matrix for the above hier-archy. The weight of each indicator is as follows:
Index Security and crime Economic Political Human Development Climate
Weight 0.172 0.243 0.324 0.136 0.125
In order to scientifically and comprehensively assess the national vulnerability and select dif-ferent vulnerability indicators according to differ-ent countries, we consider the correlation be-tween the metrics and the complexity of the data. Applying the standard processing of index data, we can obtain the modified weight of each indi-cator using the gray relational analysis, and then implement the comparable computation of the vulnerability of different countries.
3.3 Gray correlation assessment weight Due to the complexity and certain mutual influ-ence of each indicator on the overall evaluation, it is considered to establish a gray relational as-sessment model to analyze and evaluate the vulnerability of each country. Gray relational as-sessment is a branch of gray system theory, which is widely used in the comprehensive eval-uation of things and phenomena influenced by many interrelated factors. The steps of using gr- ay relational analysis to make a comprehensive evaluation are as follows:
1:
Step Determining the reference data column as the ideal comparison standard, it is possible to construct the reference data column based
on the optimal value (or the worst value) of each metric, or to select other reference values acco- rding to the purpose of the evaluation, referred to as
0 ( (1),0 0(2), , 0( ))
X = x x x m .
Choose the worst value as the reference series, that is,X0 =(10,10, ,10).
2 :
Step Calculate the absolute difference be-tween the index of each target object (compari-son sequence) and the corresponding element of the reference sequence, that is,
0
( ) ( ) ( )
ik j x ji x j
= − .
3 :
Step Determine
1 1 1
min min min{ ik( )}
i n j m k u
a j
=
and
1 1 1
max max max{ ik( )}
i n j m k u
b j
= .
4 :
Step Calculate the absolute difference be-tween the index sequence (comparison seque- nce) of each target object and the correspond-ing element of the reference sequence, that is,
( )
( ) 1, 2, ,
( ( ) )
ik
i
a b
y j j m
j b
+ = = + ,where means resolution factor,(0,1) , the
5 :
Step Calculate the degree of association, and the average of each correlation coefficient be-tween each metric and the corresponding ele-ment of each evaluation object (comparison se-quence) to reflect the relationship between each evaluation object and the reference sequence and call it the degree of association, which is denoted by:
1 1
1
( )
n u
j ik
i k
r y j
n u = =
=
.6 :
Step Calculate the weight of each metric
'
1 2
1, 2, , j
j
m
r
r j m
r r r
= =
+ + + .
4. Comprehensive evaluation index
4.1 Determine the second-level indicators Determining the second level of indicators is the selection of a series of comprehensive and ef-fective five major indicators, namely, safety and crime, economics, politics, human development and climate, and to determine a reasonable wei- ght. These five second-level indicators will be used to assess the five dimensions of country vulnerability.
⚫ Security and Crime: National security is the fundamental interest of the country. It is an unsuspecting objective state in which the state has no external threats and aggres-sions as well as internal chaos. National se-curity, to a certain extent, has made the cou-
ntry more stable.
⚫ Economics: The national economy refers to the autonomy of a country's domestic economy in supporting the country's econ-omy. The weak economy and the lack of ec- onomic independence will increase the cou- ntry's vulnerability.
⚫ Politics: The political instability and lack of ability of handling, coping and adaptability to the political crisis will make the country politically vulnerable and more politically ac-tive, which in turn will increase the country's vulnerability.
⚫ Human development: The human devel-opment perspective inherently includes the need for sustainable development, compre-hensive attention to health, education, equ- ality and the decent life of mankind. The en-hancement of human development also co- ntributes to the realization of sustainable d- evelopment. The improvement of the sus-tainable development level will help the co- untry's stability.
⚫ Climate: The impact of climate change on the country is multi-scale, multi-faceted, and multi-level. Climate change will also lead to the stability of the country and affect its vul-nerability.
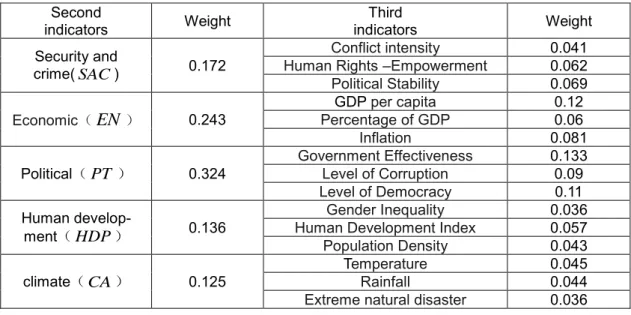
The final establishment of the index system and weight are shown in the Table 1:
Table 1:the weight of indicators Second
indicators Weight indicators Third Weight Security and
crime(SAC) 0.172
Conflict intensity 0.041
Human Rights –Empowerment 0.062
Political Stability 0.069
Economic(EN) 0.243
GDP per capita 0.12
Percentage of GDP 0.06
Inflation 0.081
Political(PT ) 0.324
Government Effectiveness 0.133
Level of Corruption 0.09
Level of Democracy 0.11 Human
develop-ment(HDP) 0.136
Gender Inequality 0.036
Human Development Index 0.057
Population Density 0.043
climate(CA) 0.125
Temperature 0.045
Rainfall 0.044
4.2 Determine the first-level of indicators Based on the above-mentioned index system to determine the third-level indicators and weight of the second-level indicators, a comprehensive assessment can be established that identifies the country's vulnerability. The country's vulner-ability Zi can be expressed as:
1 2 3 4 5
i
Z =w SAC w EN+ +w PT +w HDP w CA+
Among them:wi indicates the weight corre-sponding to the second level indicator and can be vectored as:
0.172 0.243 0.324 0.136 0.125
w=
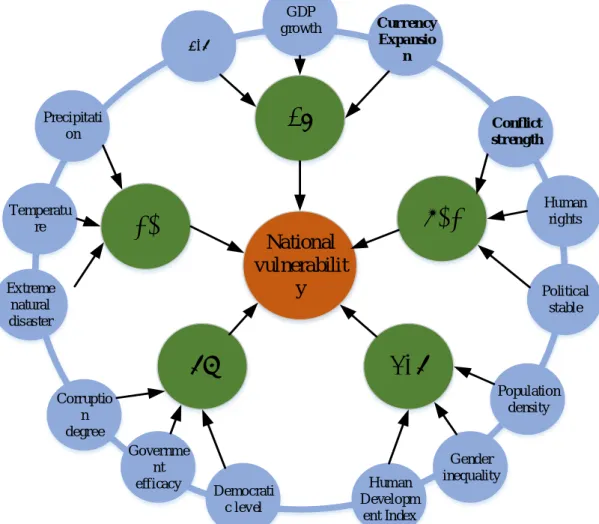
Through the above analysis, the three-level co- mprehensive evaluation system is finally estab-lished. The relationship between the evaluation indicators of these three levels is shown in the Fig.1.
National vulnerabilit
y
CA
PT
HDP
SAC
EN
Gender inequality GDP
growth
Human rights Temperatu
re
Governme nt efficacy
Conflict strength Currency
Expansio n
Political stable
Population density
Human Developm
ent Index Democrati
c level Corruptio
n degree Extreme
natural disaster
Precipitati on
GDP
Figure 1: The relationship between the evaluation indicators of these three levels.
5. Conclusion
Through principal component analysis, 20 indi-cators that affect regional vulnerability were identified. The weights are analyzed by the gray correlation algorithm, and the weights of these indicators affecting regional vulnerability are de-termined. Among them, safety and crime, eco-nomics, politics, human development and cli-mate are the main factors affecting regional vul-nerability, especially politics is the most critical,
and climate has less impact. By analyzing these factors, the vulnerability of a country or region can be assessed. This has a very important role in predicting regional vulnerability.
References
1. Bohle H G, Vulnerability and criticality: Perspec-tives from social geography[J]. IHDP Update,20 01, 2(1): 3-5.
Climate Change Impacts[J]. Review of Econom-ics & StatistEconom-ics, 2013, 97(2):461-471.
3. Dell M , Jones B F , Olken B A . What Do We Learn from the Weather? The New Climate-Ec- onomy Literature[J]. Nber Working Papers, 201 3, 52(3):págs. 740-798.
4. Hsiang, S. M . Temperatures and cyclones str- ongly associated with economic production in the Caribbean and Central America[J]. Procee- dings of the National Academy of Sciences, 201 0, 107(35):15367-15372.
5. “http://emiguel.econ.berkeley.edu/assets/mi- guel_media/473/ZCommunications_Cli-mate_change_conflicts.pdf”
6. Burke M, Hsiang S M, Miguel E. Global non-lin-ear effect of temperature on economic produc-tion[J]. Nature, 2015, 527(7577):235.
7. Burke M B , Miguel E , Satyanath S , et al. War- ming increases the risk of civil war in Africa[J]. Proceedings of the National Academy of Sci-ences of the United States of America, 2009, 10 6(49):20670-20674.
8. Cane M A , Miguel E , Burke M , et al. Temper-ature and violence[J]. NTemper-ature Climate Change, 2014, 4(4):234-235.
9. “http://www.ipcc.ch/”
10. “ https://carleton.ca/cifp/failed-fragile-states/” 11. Burke M , Hsiang S M , Miguel E . Climate and