Browse Title Index
28
0
0
Full text
(2) Aisyah Abu Bakar, Mariana Mohamed Osman, Syahriah Bachok & Mansor Ibrahim Analysis on Community Involvement in Cultural Activities: Transmission of Ethnic Language. INTRODUCTION For over 600 years since Malacca was founded, Malaysia is now inhabited by more than 50 ethnic groups of diverse languages and dialects. With interesting history and variety of architectural and other cultural heritages, Malaysia has turned into mosaics of cultures. Although the official language in Malaysia is the Malay language, other languages such as Mandarin, Tamil, Cristao, Malay Creoles and many others need to be acknowledged. These languages are the vehicles connecting one cultural community to the other as well as a tool in transferring knowledge from one generation to the next. A phenomenon addressed as ‘Language Shift’ occurs when a language is displaced by another along the lives of community members. Among the factors contributing to this phenomenon are demographic declination, Interlingua distance, dialect diversity, writing system and mass media (Huebner T., 1987). The phenomenon of language shift also occurs in Malaysia whereby one of the contributing factors are the use of English has once been adapted in text books and is also employed in discourses in school classes and social interaction. Other than the fact that there are varieties of Malay dialects articulated among the citizens, Malaysians being a multiracial society are typically to experience interethnic (Asmah O., 2004). Thus it is possible for the official Malay language, and perhaps other languages used in Malaysia to experience language shift. Therefore acknowledging diversity of languages in a particular cultural community is crucial to determine if the culture has been genuinely transmitted or passed on. This also establishes the degree of understanding and involvement of a certain individual to his cultural community. Survey Questionnaires have been recently conducted in one of the World Heritage Sites, Melaka, inquiring four cultural communities to address their level of involvement in social and cultural clubs. These four communities are selected geographically. They are Morten Village Community, Portuguese Village Community, Heren and Jonker Streets Community and Gajah Berang Village Community. Research hypothesis addresses that different communities have different level of language practice and that the differences are caused by the significance of community demographic and socio-economic characters.. © 2014 by MIP. 106.
(3) PLANNING MALAYSIA Journal of the Malaysia Institute of Planners (2014). In order to prove so, the sample from the questionnaires is analyzed by employing suitable SPSS statistical tests. In consistent with the primary hypothesis, subsequent hypotheses are addressed for each statistical test in supporting the primary hypothesis. PRACTICE OF ETHNIC LANGUAGE Ethnic Language is referred to the language which is highly associated with the respondents’ ethnic background. In this research, the case studies namely Morten Village, Portuguese Village, Heren and Jonker Street and Gajah Berang Village are selected because of the minority cultured communities who are claimed to reside in the four locations. The cultured communities are Traditional Malays, Chetty, Portuguese and Baba and Nyonya. It is presumed that the respondents from the cultural community speak their Ethnic Language. Therefore, Chetty respondents speak Malay Creole Chetty, Baba and Nyonya respondents speak Malay Creole Baba, Portuguese respondents speak Cristao, Indian respondents speak Tamil, Chinese respondents speak Cantonese, Mandarin or Hokkien and lastly Malay respondents speak Malay. However, it is discovered that only 60% of the respondents recognize their Ethnic Language as their Mother Tongue and Spoken Language, 2% of the respondents recognize Ethnic Language as Spoken Language but not Mother Tongue, and 38% of the respondents no longer recognize their Ethnic Language as Spoken Language or Mother Tongue. Additionally, 30% of the respondents recognize Ethnic Language as their Mother Tongue but not their Spoken Language. This implies that transmission of Ethnic Language is deteriorating. Furthermore, 6% of the respondents recognize English as their Mother Tongue and Spoken Language. English is considered a popular Spoken Language since 36% of the respondents speak English regardless of their Mother Tongue. Despite the fact that the statistical evidence implies that Ethnic Language practice is deteriorating, majority of the respondents claim that they still practice their Ethnic Language occasionally. Therefore, regardless if their Mother Tongue and Spoken Language are not their Ethnic Language, Ethnic Language is still recognized and practiced in certain occasion.. 107. © 2014 by MIP.
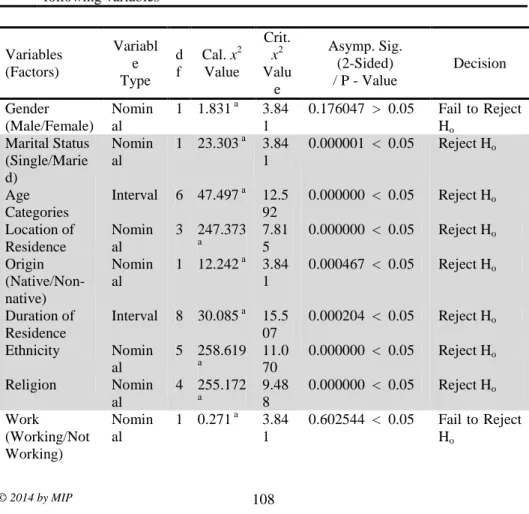
(4) Aisyah Abu Bakar, Mariana Mohamed Osman, Syahriah Bachok & Mansor Ibrahim Analysis on Community Involvement in Cultural Activities: Transmission of Ethnic Language. ANALYSIS ON FACTORS INFLUENCING PRACTICE OF ETHNIC LANGUAGE Ethnic Language Practice is a dichotomous variable which determines whether the respondents are either Ethnic Language Practitioners or NonPractitioners. Chi-Square for Independence tests are implemented to assess if there are relationships between any of the demographic and socioeconomic variables with Ethnic Language Practice variable. The results of the tests are shown in Table 16. Table 16: Summary of Chi-Square for Independence Results for Ethnic Language Practice with Demographic and Socio-Economic Variables and Club Participation Variables H0: H1:. There are no relationships between Ethnic Language Practice and the following variables There are significant relationships between Ethnic Language Practice and the following variables. Variables (Factors) Gender (Male/Female) Marital Status (Single/Marie d) Age Categories Location of Residence Origin (Native/Nonnative) Duration of Residence Ethnicity Religion Work (Working/Not Working) © 2014 by MIP. Variabl e Type. Cal. x2 Value. d f. Nomin al Nomin al. 1 1.831 a. Interval. 6 47.497 a. Nomin al Nomin al. 3 247.373. Interval. 8 30.085 a. Nomin al Nomin al Nomin al. 5 258.619. 1 23.303 a. a. 1 12.242 a. a. 4 255.172 a. 1 0.271 a. Crit. x2 Valu e 3.84 1 3.84 1. Asymp. Sig. (2-Sided) / P - Value. 0.000001 < 0.05. Fail to Reject Ho Reject Ho. 12.5 92 7.81 5 3.84 1. 0.000000 < 0.05. Reject Ho. 0.000000 < 0.05. Reject Ho. 0.000467 < 0.05. Reject Ho. 15.5 07 11.0 70 9.48 8 3.84 1. 0.000204 < 0.05. Reject Ho. 0.000000 < 0.05. Reject Ho. 0.000000 < 0.05. Reject Ho. 0.602544 < 0.05. Fail to Reject Ho. 108. 0.176047 > 0.05. Decision.
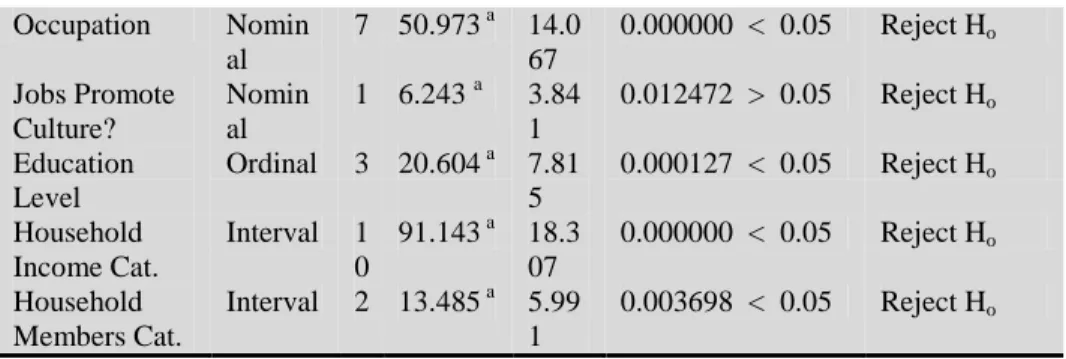
(5) PLANNING MALAYSIA Journal of the Malaysia Institute of Planners (2014). Occupation Jobs Promote Culture? Education Level Household Income Cat. Household Members Cat.. Nomin al Nomin al Ordinal. 7 50.973 a. Interval. 1 91.143 a 0 2 13.485 a. Interval. 1 6.243 a 3 20.604 a. 14.0 67 3.84 1 7.81 5 18.3 07 5.99 1. 0.000000 < 0.05. Reject Ho. 0.012472 > 0.05. Reject Ho. 0.000127 < 0.05. Reject Ho. 0.000000 < 0.05. Reject Ho. 0.003698 < 0.05. Reject Ho. According to Table, the summary of Chi-Square results indicates 12 factors which influence Ethnic Language Practice. The outcome summary implies that between subjects of the 12 factors highlighted in the table, the observed counts of Ethnic Language Practitioners have deviated from the expected counts which consequently results in statistically significant value of χ2. As the amount of deviation increases, the value of χ2 also increases and p value retreats from 0.05. The lesser the p value from 0.05, the more significant is the value of χ2. Thus for the 12 factors, the Chi-Square tests reject the null hypothesis. This means that there are relationships between the 12 factors and Ethnic Language Practice. On the other hand, two factors namely Gender and Work have no relationships with Ethnic Language Practice, p > 0.05. Table 17 is the interpretation of results for the 12 significant factors. Table 17: Chi-Square for Independence Interpretation of Results for Ethnic Language Practice with Significant Related Factors Decision: REJECT H0 (There is a significant relationship) DV: Ethnic Language Practice IV (Factor) Interpretation of Results Significance Frequency of ethnic language There is a highly practitioners between single statistically and married respondents is significant significantly different. This relationship means ethnic language Marital between Ethnic practice is significantly Status Language Practice influenced by marital status. (Single/ and Marital Status, However, Phi of -1.94 2 Maried) x (1) = 24.18, p = indicates a weak association 0.00 < 0.01. between Marital Status and Measure of Ethnic Language Practice Association: There are significantly high Phi : - 1.94, p = 0.00 observed counts than expected 109. © 2014 by MIP.
(6) Aisyah Abu Bakar, Mariana Mohamed Osman, Syahriah Bachok & Mansor Ibrahim Analysis on Community Involvement in Cultural Activities: Transmission of Ethnic Language. Age Categories. © 2014 by MIP. counts of married respondents who practice ethnic language compared to single respondents who practice ethnic language. Reasoning: The weak association between Ethnic Language Practice and Marital Status indicates that most ethnic language practitioners are married, however the likelihood is not too convincing. Married respondents have more family interaction compared to single respondents. Majority of married respondents have the same ethnicaffiliated partners. Thus explains how being married have higher possibility to practice ethnic language compared to being single. On the other hand, majority of single respondents experience schools and work environment, therefore tendencies of interaction with non-ethnic affiliated acquaintances are higher and more than married respondents. Additionally, it is discovered that 50% of single respondents consider English as their Spoken Language. Therefore infers that it is unlikely for the members of the cultural community who are single to practice ethnic language. There is a highly Frequency of ethnic language statistically practitioners in every age significant category is significantly relationship different. This means ethnic between Ethnic language practice is Language Practice significantly influenced by and Age age categories. Categories, However, Eta of 0.272 x2(6) = 47.50, p = indicates a weak positive 0.00 < 0.01. association between Age Measure of Categories and Ethnic Association: Language Practice. Eta : 0.272, p = 0.00 There are significantly high *The greater the age of observed counts than respondents, the more likely expected counts of ethnic they practice ethnic language practitioners who language are more than 70 years old. Reasoning: The positive yet weak association between Ethnic Language Practice and Age Categories indicates that as the respondents’ age increases, the more likely the respondents practice ethnic language, although the likelihood is not too convincing. It is discovered that less than half of the respondents who are below 40 years old practice ethnic language. On the other hand, there are 72% of respondents who are above 40 years old practice ethnic language. Based on this finding, there are two sides of inferences which can be addressed. First is that practice and transmission of ethnic language of 110.
(7) PLANNING MALAYSIA Journal of the Malaysia Institute of Planners (2014). Location of Residence. the drastically declining. It is found that 50% of respondents who are below 40 years old consider English as spoken language, and 25% of respondents who are above 40 years old consider English as spoken language. English is the most popular spoken language of the younger generation of the cultural community, compared to their ethnic language. Secondly, this also infers that ethnic languages may still be articulated in the cultural community however they are greatly practiced by the older generation compared to younger generation. This is because interaction with people of different ethnicity such as in schools and working environment reduces as age increases. At the same time, interaction with family members who tend to be ethnicaffiliated people increases as age increases. This encourages the use of ethnic language as spoken language as respondents grow older. Frequency of ethnic language practitioners in every location is significantly different. This means ethnic language practice is significantly There is a highly influenced by location of statistically residence. significant Cramer’s V of 0.622 relationship between indicates a strong Ethnic Language association between Practice and Location of Residence and Location of Ethnic Language Practice. Residence, There are significantly high 2 x (3) = 247.4, p = observed counts than 0.00 < 0.01. expected counts of ethnic Measure of language practitioners who Association: live in Morten Village, Cramer’s V : 0.622, p = 0.00 Gajah Berang Village and Heren and Jonker Streets respectively. Only 15% respondents from Portuguese Village practice their ethnic language. Reasoning: The strong association between Ethnic Language Practice and Location of Residence points out that there is a strong likelihood of respondents from Portuguese Village not to practice their ethnic language, while respondents from Morten Village, Heren and Jonker Streets and Gajah Berang Village to practice their ethnic language. All respondents from Portuguese Village are Portuguese descendants thus their ethnic language is Cristao which is among the least common spoken languages in Malaysia. As the Portuguese 111. © 2014 by MIP.
(8) Aisyah Abu Bakar, Mariana Mohamed Osman, Syahriah Bachok & Mansor Ibrahim Analysis on Community Involvement in Cultural Activities: Transmission of Ethnic Language. Origin (Native/ Non-native). © 2014 by MIP. respondents interact with other people outside their village, Cristao is no longer a widely comprehensible language. This has become a difficulty for the Portuguese residents in Malaysia to practice Cristao as a spoken language. Although 36% of the Portuguese respondents’ mother tongue is Cristao, only 15% of them speak Cristao. Instead, English is the most widely used language in Portuguese Village. In addition, the only 15% of the Portuguese’s Village respondents who still speak Cristao age above 50 years old. This suggests that apart from having difficulty in practicing Cistao, the use of Cristao in Portuguese Village is highly deteriorating and poorly transmitted to the younger generation. In contrast, all respondents from Morten Village, and majority of Gajah Berang Village and Heren and Jonker Streets respondents are still practicing their ethnic languages; which are mostly Malay, Creole Malay and Mixed or Traditional Chinese. Since these ethnic languages are widely conversed and comprehensible in Malaysia, the difficulty to practice ethnic language for respondents from the three locations is significantly less than respondents from Portuguese Village. Frequency of native and non-native ethnic language practitioners is significantly different. This means ethnic There is a highly language practice is statistically significantly influenced by significant origin. relationship between However, Phi of -0.143 Ethnic Language indicates a very weak Practice and Origin, negative association 2 x (1) = 12.242, p = between Origin and Ethnic 0.00 < 0.01. Language Practice Measure of There are significantly high Association: observed counts than Phi: -0.143, p = 0.000 expected counts of ethnic language practitioners who are non-native to their location of residence. Reasoning: A very weak association between Ethnic Language Practice and Origin indicates that ethnic language practitioners are likely non-native to their location, although the likelihood is not too convincing. It is discovered that the observed counts of non-native ethnic language practitioners are only higher than expected counts for Morten Village, Gajah Berang Village and Heren and Jonker Streets. It is not surprising for all the non-native respondents in Morten Village to practice their ethnic language since all of them are Malays and Malay is the national language of Malaysia. However for Gajah 112.
(9) PLANNING MALAYSIA Journal of the Malaysia Institute of Planners (2014). Duration of Residence Categories. Berang Village, Chetty Creole Malay is practiced by majority of the non-native respondents. This implies a possibility that most of the non-native residents of Gajah Berang Village originate from areas where Chetty Creole Malay is widely practiced. Additionally, this also suggests that the non-native respondents have adapted well with majority of Chetty residents in the village, thus enable them to enhance the use of Chetty Creole Malay. In Heren and Jonker Streets, 27% of native respondents of Heren and Jonker Streets practice English while nearly half of the non-native respondents speak English. However, majority of both native and non-native respondents still speak their ethnic language, which is mostly Mixed or Traditional Chinese. The language is also among commonly used languages in Malaysia by the Chinese people. Unlike the three locations, majority of non-native respondents from Portuguese Village speak English instead of their ethnic language. Since majority of the native residents in Portuguese Village speak English too, thus the possibility for the non-native residents to learn Cristao from the native residents is bleak. Frequency of ethnic language practitioners in There is a highly every category of duration statistically of residence is significantly significant different. This means ethnic relationship between language practice is Ethnic Language significantly influenced by Practice and duration of residence Duration of categories. Residence However, Eta of 0.241 Categories, indicates a weak positive x2(8) = 30.085, p = association between 0.00 < 0.01. Duration of Residence Measure of Categories and Ethnic Association: Language Practice Eta: 0.241 There are significantly high *The greater the duration of observed counts than residence of the respondents, expected counts of ethnic the more likely they practice language practitioners who ethnic language have settled in their respective locations for more than 40 years Reasoning: The positive yet weak association between Ethnic Language Practice and Duration of Residence Categories indicates that the longer the respondents’ duration of residence, the more likely the respondents practice ethnic language, although the likelihood is not too convincing. It is discovered that most ethnic language 113. © 2014 by MIP.
(10) Aisyah Abu Bakar, Mariana Mohamed Osman, Syahriah Bachok & Mansor Ibrahim Analysis on Community Involvement in Cultural Activities: Transmission of Ethnic Language. Ethnicity. © 2014 by MIP. practitioners are respondents who have settled in for more than 40 years. This suggests that the longer the respondents stayed in their respective locations, the more likely ethnic language is practiced as spoken language by the respondents. Since ethnicity is a geographical driver of the cultural community, communication with the existing community influences the use of ethnic language. This means that duration of residence determines the length of interaction which certain individuals experience with their community. The length of interaction represents profoundness of community bridge, which at the same time encourages the community to speak in a language that shows a sense of belonging to each other and to the place. However, since the measure of association indicates a weak positive relationship of 0.241, this means that the practice of ethnic language which results from this interaction is deteriorating. This may be due to several reasons, one of which is the use of ethnic language in the place itself is deteriorating. At the same time, interaction between the individuals in the community can also be declining. Frequency of ethnic language practitioners in every ethnicity is There is a highly significantly different. This statistically means ethnic language significant practice is significantly relationship between influenced by ethnicity. Ethnic Language Cramer’s V of 0.636 Practice and indicates a strong positive Ethnicity, association between 2 x (5) = 258.62, p = Ethnicity and Ethnic 0.00 < 0.01. Language Practice. Measure of There are significantly high Association: observed counts than Cramer’s V : 0.636, p = expected counts of ethnic 0.000 language practitioners who are Malay, Chinese and Chetty respondents. Reasoning: The strong association between Ethnic Language Practice and Ethnicity indicates that there is significant partiality of frequencies of ethnic language practitioners in every ethnicity. It is discovered in that there are significantly high observed counts than expected counts of ethnic language practitioners who are Malay, Chinese and Chetty respondents compared to Indians, Baba and Nyonya and Portuguese respondents. Indians and Baba and Nyonya are minorities of the communities in Gajah Berang Village and Heren and Jonker Streets respectively. Indian respondents do not speak their ethnic language of Tamil, instead their spoken language is Malay 114.
(11) PLANNING MALAYSIA Journal of the Malaysia Institute of Planners (2014). Religion. Occupation. Creole Chetty, alongside with the Chetty respondents who are majority residents of Gajah Berang Village. Although 60% of Baba and Nyonya respondents still speak Malay Creole Baba, vast majority of them are above 60 years old. The rest of Baba and Nyonya respondents speak Mixed or Traditional Chinese, alongside with the Chinese respondents who are majority residents of Heren and Jonker Streets. Two inferences can be addressed from this finding. From a positive angle, this implies that there is a strong community bridge between Indians and Chetty respondents as well as between Chinese and Baba and Nyonya respondents. However, from a negative angle, this has caused deteriorations of ethnic language practice for minorities like Indian and Baba and Nyonya respondents when they adapted with majority residents of their locations. A different case for the Portuguese who are ethnic minority of the country that have among the least comprehensible ethnic languages; hence it is unsurprising for them to face difficulties in practicing Cristao. Frequency of ethnic language practitioners in every religion is There is a highly significantly different. This statistically means ethnic language significant practice is significantly relationship between influenced by religion. Ethnic Language Cramer’s V of 0.631 Practice and indicates a strong positive Religion, association between 2 x (4) = 255.17, p = Religion and Ethnic 0.00 < 0.01. Language Practice. Measure of There are significantly high Association: observed counts than Cramer’s V : 0.631, p = expected counts of ethnic 0.000 language practitioners who believe in Islam, Buddhism and Hinduism. Reasoning: The strong association between Ethnic Language Practice and Religion indicates that there is a significant partiality of frequencies of ethnic language practitioners for every religion. Since religion variable is strongly associated with ethnicity variable (all Malay respondents believe in Islam, most Chinese respondents believe in Buddhism and most Chetty respondents believe in Hinduism), therefore observed counts of ethnic language practitioners are higher than expected counts for Islam, Buddhism and Hinduism. There is a highly Frequency of ethnic statistically language practitioners in. 115. © 2014 by MIP.
(12) Aisyah Abu Bakar, Mariana Mohamed Osman, Syahriah Bachok & Mansor Ibrahim Analysis on Community Involvement in Cultural Activities: Transmission of Ethnic Language. significant relationship between Ethnic Language Practice and Occupation, x2(7) = 59.973, p = 0.00 < 0.01. Measure of Association: Cramer’s V : 0.282, p = 0.022. every occupation is significantly different. This means ethnic language practice is significantly influenced by occupation. However, Cramer’s V of 0.283 indicates a weak positive association between Occupation and Ethnic Language Practice. There are significantly high observed counts of ethnic language practitioners who work as Government Employees, Sole Traders, Retirees and Housewives Reasoning: The weak association between Ethnic Language Practice and Occupation indicates that there is a significant partiality of frequencies of ethnic language practitioners for every occupation. Earlier it is discovered that whether the respondents are working or not, it has no significant relationship with whether or not the respondents are ethnic language practitioners. This result further indicates four categories of Occupation which are mixed of working and not working respondents that have high observed counts than expected counts of ethnic language practitioners. The four categories are Government Employees, Sole Traders. Retirees and Housewives. Vast majority of Government Employees are Malay and Chetty respondents. Only two of the Government Employees in the sample are Portuguese respondents. Malay and Chetty respondents’ ethnic languages are Malay and Malay Creole respectively. Since both languages are the most widely practiced and comprehensible language in the country; therefore it is spontaneously easy for the Malay and Chetty respondents to practice their ethnic language in a larger society. Additionally, this explains why only two Portuguese respondents work as Government Employees. One of the reasons is due to the use of language in the working environment with society outside their village. Vast majority of Sole Traders are respondents from Heren and Jonker Streets. 52% of the Sole Trader respondents work in the fields of Trade and Retailing and Arts and Handicrafts. The two fields are culture based professional fields. The rest of working fields of Sole Traders in the sample are mostly related to culture based professions. Examples of other working fields of the Sole Traders include Culture and Performing Arts, Manufacturing and Production, Catering and Restaurants and Accommodations. The ability to practice ethnic language is an advantage for those who work © 2014 by MIP. 116.
(13) PLANNING MALAYSIA Journal of the Malaysia Institute of Planners (2014). Job Promotes Culture? (Cultural Based Profession / NonCultural Based Profession). in culture based professions. Thus this explains why vast majority of Sole Trader respondents practice their ethnic language. For Retirees and Housewives respondents, most of them spend their time at home or with families and their cultural community. One of the strong factors which can influence the tendency to speak ethnic language is the surrounding individuals a person interacts with. Since interaction with family and surrounding residents are likely more regular for Retirees and Housewives in comparison with other categories of Occupation, it is therefore unsurprising for majority of Retirees and Housewives of the cultural community to practice their ethnic language as spoken language. Frequency of ethnic language practitioners who have cultural based profession and non-cultural There is a highly based profession is statistically significantly different. This significant means ethnic language relationship between practice is significantly Ethnic Language influenced by job promotes Practice and Job culture. Promotes Culture, However, Phi of 0.135 x2(1) = 6.243, p = indicates a very weak 0.01 < 0.01. positive association between Measure of Job Promotes Culture and Association: Ethnic Language Practice. Phi: 0.135, p = 0.000 There are significantly high observed counts of ethnic language practitioners who have cultural based professions. Reasoning: The strong association between Ethnic Language Practice and Job Promotes Culture indicates that ethnic language practitioners are likely those who work in cultural-based profession. Respondents who work in cultural based professions are likely those with professional expertise in cultural manifestation and tourism management. Since practice of ethnic language is significant in determining the strength of community bridge, to master in ethnic language practice is an advantage for the respondents with cultural based professions. First, this enables the respondents to make the most out of the interaction with individuals in the cultural community especially resourceful individuals who are cultural experts. Secondly, this enables the respondents to maximize understanding and skills in culture through ethnic conversational practice. Thirdly, the ability to converse well in ethnic language reflects skills and expertise in 117. © 2014 by MIP.
(14) Aisyah Abu Bakar, Mariana Mohamed Osman, Syahriah Bachok & Mansor Ibrahim Analysis on Community Involvement in Cultural Activities: Transmission of Ethnic Language. Education Level. Household Income Categories. © 2014 by MIP. culture of the professionals. Therefore it is expected for those with cultural based professions to acquire the ability to converse in their ethnic language. Frequency of ethnic language practitioners of different education levels is There is a highly significantly different. This statistically means ethnic language significant practice is significantly relationship between influenced by education Ethnic Language levels. Practice and However, Cramer’s V of Education Level, 0.179 indicates a very weak x2(3) = 20.604, p = positive association between 0.00 < 0.01. Education Level and Ethnic Measure of Language Practice. Association: There are significantly high Cramer’s V: 0.179, p = 0.000 observed counts of ethnic language practitioners who have primary school education attainment. Reasoning: A weak association between Ethnic Language Practice and Education Level indicates that ethnic language practitioners are likely those with low education attainment, although the likelihood is not too convincing. Conversely, this implies that the chance for individuals with high education level in the cultural community to speak their ethnic language is unpromising. High education levels enable the respondents to work in more demanding professions, thus allow more interaction with larger society. It is possible for ethnic language practice to deteriorate due to less interaction with cultural community and more interaction with the larger and more general society. Nevertheless, for the individuals in the cultural community to obtain a high education level is equally important as protecting their heritage. It is vital for the individuals in the ethnic minorities of Malaysian citizens to move up in the general society through better education attainment, not only for them to have access to more opportunities to improve their way of living, but also for the larger society to be conscious of the existence of the ethnic minorities. At the same time, culture manifestation must also be upheld to sustain the strength of the cultural roots. There is a highly Frequency of ethnic statistically language practitioners of significant different household income relationship between categories is significantly Ethnic Language different. This means ethnic 118.
(15) PLANNING MALAYSIA Journal of the Malaysia Institute of Planners (2014). Practice and Household Income Categories x2(10) = 91.143, p = 0.00 < 0.01 Measure of Association: Eta: - 0.377 *The smaller the household income of the respondents, the more likely they practice ethnic language. Household Members Categories. language practice is significantly influenced by household income categories. Eta of - 0.377 indicates a weak negative association between Household Income Categories and Ethnic Language Practice. There are significantly high observed counts of ethnic language practitioners who have lower than RM 4,000 household income. Reasoning: The negative yet weak association between Ethnic Language Practice and Household Income Categories indicates that as the respondents’ household income increases, the more unlikely for the respondents to practice ethnic language, although the likelihood is not too convincing. The reasoning for Household Income Categories is parallel to the reasoning in Education Level. Better education attainment allows more job opportunities and higher income. Thus household income correlates with education attainment. It is previously pointed out that the higher the education level, the more unlikely for the respondents to practice ethnic language. Both education level and household income responds to socio-economic status of the respondents. This implies that as the respondents move up in the socio-economic status, ethnic language practice is likely to deteriorate. This finding is alarming for the cultural community. This is because for the cultural community to transmit their ethnic language is equally as important as to improve their socio-economic status. Alas, the finding proves otherwise. Therefore, among efforts to sustain ethnic language practice, there must be unique or exclusive approaches on individuals with high income and high education attainment. There is a highly Frequency of ethnic statistically language practitioners of significant different household relationship between members categories is Ethnic Language significantly different. This Practice and means ethnic language Household Members practice is significantly Categories influenced by household x2(2) = 13.485, p = members categories. 0.00 < 0.01. Eta of - 0.093 indicates a Measure of weak negative association 119. © 2014 by MIP.
(16) Aisyah Abu Bakar, Mariana Mohamed Osman, Syahriah Bachok & Mansor Ibrahim Analysis on Community Involvement in Cultural Activities: Transmission of Ethnic Language. Association: Eta: - 0.093 *The smaller the household members of the respondents, the more likely they practice ethnic language. between Household Members Categories and Ethnic Language Practice. There are significantly high observed counts of ethnic language practitioners who have lower than five household members. Reasoning: The negative yet very weak association between Ethnic Language Practice and Household Members Categories indicates that as the respondents’ household members increases, the more unlikely for the respondents to practice ethnic language, although the likelihood is not too convincing. There are two ways to infer this finding. First, in response with latter reasoning, since household members categories correlate with household income categories, household members can also be used to determine socio-economic status. Therefore the reasoning for this analysis is similar to previous reasoning on household income. Secondly, as family members increases, there is a possibility that more variety of language is used to converse at home, thus reduce the use of ethnic language. This is because as individuals in the family socialize with the general society, chances of ‘Language Shift’ to occur are inevitable. Thus, when the individuals return home, there is a possibility that the ethnic language practiced in the family to be replaced by other languages. Therefore, the greater the amount of members in the family, the stronger is the likelihood of Language Shift to occur.. According to the reasoning of results in Table 18, characters of majority of ethnic language practitioners and non-practitioners in the cultural community can be distinguished. Table addresses the common characters of ethnic language practitioners and non-practitioners. Table 18: Common Characters of Club Participants and Non-Participants Common Characters of Respondents Who Are Drawn to be Practitioners of Ethnic Language Marital Status : Married Age Categories : 40 years old and above : Morten Village, Heren and Jonker Streets, Gajah Location of Residence Berang Village Origin : Non-Native Duration of Residence : 60 years and above. © 2014 by MIP. 120.
(17) PLANNING MALAYSIA Journal of the Malaysia Institute of Planners (2014). Categories Ethnicity Religion Occupation Job Promotes Culture Education Level Household Income Categories Household Members Categories. : : : : : :. Malay, Chinese, Chetty Islam, Buddhism, Hinduism Government, Sole Traders, Housewives, Retirees Cultural Based Professions Primary Schools Below RM 4,000. :. 5 Members and below. Common Characters of Respondents Who Are Drawn to be Non-Practitioners of Ethnic Language Marital Status : Single Age Categories : 40 years old and below Location of Residence : Portuguese Village Origin : Native Duration of Residence : Below 60 years Categories Ethnicity : Baba and Nyonya, Indians, Portuguese Religion : Roman Catholic, Atheism : Private Employees, Partnerships, Students, Occupation Unemployed Job Promotes Culture : Non-Cultural Based Professions Education Level : Secondary Schools, College, Bachelor Degree Household Income : Above RM 4,000 Categories Household Members : More than 5 members Categories. The Chi-Square Analysis indicates that there are significant relationships between some demographic and socio-economic factors. Therefore, in order to implement efforts to enhance the practice of ethnic language, the focus groups are those who are drawn not to be non-practitioners of Ethnic Language.. ANALYSIS ON PRACTICE OF LANGUAGE FORMS BASED ON AGE FACTOR Language Forms refer to practices and expressions which require strong command of Ethnic Language. In this research, there are 10 Language Forms to be analysed. The followings are the 10 Language Forms: 121. © 2014 by MIP.
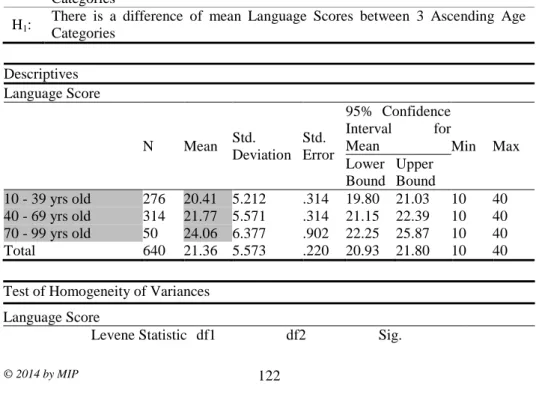
(18) Aisyah Abu Bakar, Mariana Mohamed Osman, Syahriah Bachok & Mansor Ibrahim Analysis on Community Involvement in Cultural Activities: Transmission of Ethnic Language. 1. Accent and Dialect 2. Proverb and Idioms 3. Spiritual Religious Passages 4. Spell Incantation 5. Traditional Songs. 6. 7. 8. 9. 10.. Nursery Rhymes Poems Epic Songs Riddles Hereditary Tips Myths and Legends. The respondents are inquired to address their practice regularity of 10 language forms. Each level of regularity is given scores for further statistical test. Language Scores refers to a continuous variable which represent the sum of scores of practice regularity for each language forms. It is found that as age increases, the practice of language forms improves. A Trend Analysis is implemented to observe the mean difference of Language Scores between younger age group, middle age group and older age group. Table 19: Trend Analysis between 3 Ascending Age Categories and Language Scores H0: H1:. There is no difference of mean Language Scores between 3 Ascending Age Categories There is a difference of mean Language Scores between 3 Ascending Age Categories. Descriptives Language Score. N. 10 - 39 yrs old 40 - 69 yrs old 70 - 99 yrs old Total. 276 314 50 640. 95% Confidence Interval for Std. Std. Mean Mean Min Deviation Error Lower Upper Bound Bound 20.41 5.212 .314 19.80 21.03 10 21.77 5.571 .314 21.15 22.39 10 24.06 6.377 .902 22.25 25.87 10 21.36 5.573 .220 20.93 21.80 10. Test of Homogeneity of Variances Language Score Levene Statistic df1 © 2014 by MIP. df2 122. Sig.. Max. 40 40 40 40.
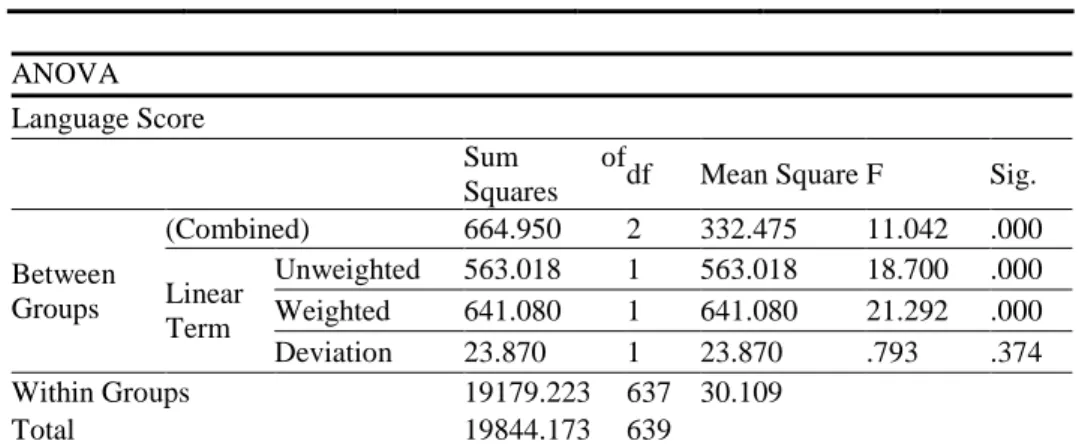
(19) PLANNING MALAYSIA Journal of the Malaysia Institute of Planners (2014). .957. 2. 637. .385. ANOVA Language Score. (Combined) Unweighted Between Linear Groups Weighted Term Deviation Within Groups Total. Sum of df Squares 664.950 2 563.018 1 641.080 1 23.870 1 19179.223 637 19844.173 639. Mean Square F. Sig.. 332.475 563.018 641.080 23.870 30.109. .000 .000 .000 .374. 11.042 18.700 21.292 .793. The Trend Analysis produces three consecutive tables. The Desciptives table shows that as the age categories increase in continuum, the language scores also increases. Levene’s test for homogeneity of variances is not significant (p = 0.345 > 0.05), indicating that the assumption of homogeneity has not been violated. The Anova table shows a significant between-groups F-ratio (p = 0.000019 < 0.05), thus it can be concluded that Language Score differs significantly across the age categories, F (2, 637) = 11.042, p < 0.05. Therefore rejects the null hypothesis, which means there is a significant difference of mean language scores between 3 ascending age categories. Furthermore, by examining the linear term, which is also significant (p < 0.05), it can be concluded that language score increases consistently across age categories. An illustration of this linear trend can be observed in Figure 25.. Mean Language Score. MEAN LANGUAGE SCORE FOR 3 ASCENDING AGE GROUPS 25 23 21 19 10 - 39 yrs old. 40 - 69 yrs old. 70 - 99 yrs old. Figure 25: Linear Trend of Language Score across 3 Ascending Age Categories 123. © 2014 by MIP.
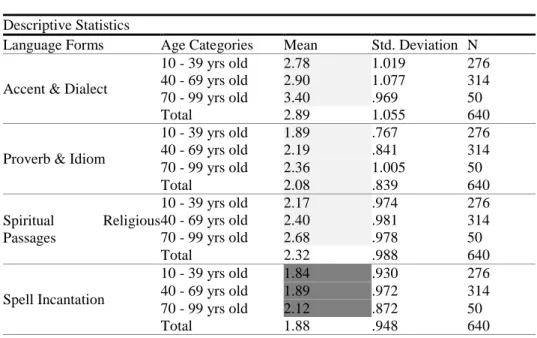
(20) Aisyah Abu Bakar, Mariana Mohamed Osman, Syahriah Bachok & Mansor Ibrahim Analysis on Community Involvement in Cultural Activities: Transmission of Ethnic Language. Figure 25 shows a linear relationship between the three age categories and language score. As age increases in continuum, the Language Scores also increases. Thus, the older respondents are likely to gain high language scores than younger respondents. For more accurate result, a correlation test on a continuous Age variable and Language Score variable has been implemented beforehand. The analysis yields a low correlation value, r = 0.153. This suggests a possibility of interfering factors which have weakened the relationship. Since Language Score is the total score of practice regularity for 10 language forms, there is a chance that for a few language forms, age has no effect on the practice regularity score. That is, for some language forms, respondents from older age categories do not score higher than respondents from younger age categories. A Multivariate Anova is conducted to observe the significant differences of mean practice regularity score of each 10 language forms for 3 ascending age categories.. Table 20: Multivariate Anova [Manova] to Compare Practice Regularity Score of 10 Language Forms between 3 Ascending Age Categories H0: H1:. There is no significant differences of Mean Practice Regularity Score for 10 Language Forms between the 3 Ascending Age Categories There are significant differences of Mean Practice Regularity Score for 10 Language Forms between the 3 Ascending Age Categories. Descriptive Statistics Language Forms. Age Categories 10 - 39 yrs old 40 - 69 yrs old Accent & Dialect 70 - 99 yrs old Total 10 - 39 yrs old 40 - 69 yrs old Proverb & Idiom 70 - 99 yrs old Total 10 - 39 yrs old Spiritual Religious40 - 69 yrs old 70 - 99 yrs old Passages Total 10 - 39 yrs old 40 - 69 yrs old Spell Incantation 70 - 99 yrs old Total © 2014 by MIP. Mean 2.78 2.90 3.40 2.89 1.89 2.19 2.36 2.08 2.17 2.40 2.68 2.32 1.84 1.89 2.12 1.88 124. Std. Deviation 1.019 1.077 .969 1.055 .767 .841 1.005 .839 .974 .981 .978 .988 .930 .972 .872 .948. N 276 314 50 640 276 314 50 640 276 314 50 640 276 314 50 640.
(21) PLANNING MALAYSIA Journal of the Malaysia Institute of Planners (2014). Traditional Songs. Nursery Rhymes. Poems Epic Songs. Riddles. Hereditary Tips. Myths & Legends. 10 - 39 yrs old 40 - 69 yrs old 70 - 99 yrs old Total 10 - 39 yrs old 40 - 69 yrs old 70 - 99 yrs old Total 10 - 39 yrs old 40 - 69 yrs old 70 - 99 yrs old Total 10 - 39 yrs old 40 - 69 yrs old 70 - 99 yrs old Total 10 - 39 yrs old 40 - 69 yrs old 70 - 99 yrs old Total 10 - 39 yrs old 40 - 69 yrs old 70 - 99 yrs old Total. Multivariate Tests Effect Value Intercept Pillai's Trace .899 (Age Categories) Pillai's Trace .153 Range 30 Years Tests of Between-Subjects Effects. 2.22 2.28 2.18 2.25 2.01 1.95 1.92 1.97 1.97 2.07 2.48 2.06 1.69 1.81 2.22 1.79 2.01 2.34 2.46 2.20 1.83 1.94 2.24 1.91. 276 314 50 640 276 314 50 640 276 314 50 640 276 314 50 640 276 314 50 640 276 314 50 640. F 558.510b. Hypothesis df Error df 10.000 628.000. 5.199. 20.000. Type III Sum df of Squares -Accent&Dialect 16.472 2 -Proverb&Idiom 17.471 2 -Spiritual&Rel Pass 14.733 2 Age 2 Categories -Spell&Incantation 3.395 (Range 30-TraditionalSongs .774 2 Years) -NurseryRhymes .793 2 -Poems&EpicSongs 11.193 2 -Riddles 12.006 2 Source. .831 .864 .896 .852 .813 .798 .804 .805 .802 .818 .762 .816 .710 .707 .815 .729 .822 .850 .973 .865 .762 .754 .894 .775. Dependent Variable. 125. Mean Square 8.236 8.736 7.366 1.698 .387 .397 5.596 6.003. Sig. .000. 1258.000 .000. F. Sig.. 7.552 12.862 7.701 1.894 .532 .612 8.595 11.661. .001 .000 .000 .151 .588 .543 .000 .000. © 2014 by MIP.
(22) Aisyah Abu Bakar, Mariana Mohamed Osman, Syahriah Bachok & Mansor Ibrahim Analysis on Community Involvement in Cultural Activities: Transmission of Ethnic Language. Error. -HereditaryTips -MythsLegends -Accent&Dialect -Proverb&Idiom -Spiritual&Rel Pass -Spell&Incantation -TraditionalSongs -NurseryRhymes -Poems&EpicSongs -Riddles -HereditaryTips -MythsLegends. 19.564 7.651 694.652 432.623 609.316 570.816 463.226 412.807 414.782 327.937 458.622 376.622. 2 2 637 637 637 637 637 637 637 637 637 637. 9.782 3.825 1.091 .679 .957 .896 .727 .648 .651 .515 .720 .591. 13.587 6.470. .000 .002. The Manova test produces three important tables. The followings explain these three tables. Descriptive Statistics Table Descriptive Statistics shows mean scores of practice regularity of 10 language forms between 3 age categories which increase in continuum. cells indicate the language forms which have statistically significant difference in practice regularity between age categories and increase in mean score of practice regularity as the age categories ascend. cell which belongs to Spell and Incantation shows an increase of mean score of practice regularity as the age categories ascend, however the differences of the mean scores between the age categories are not statistically significant. cells which belong to Traditional Songs and Nursery Rhymes indicate language forms which have no statistically significant differences of mean scores of practice regularity between the ascending age categories. Therefore, based on the Descriptive Statistics, it is discovered that there are two language forms which affect the positive relationship of Language Score and Age. They are Traditional Songs and Nursery Rhymes.. © 2014 by MIP. 126.
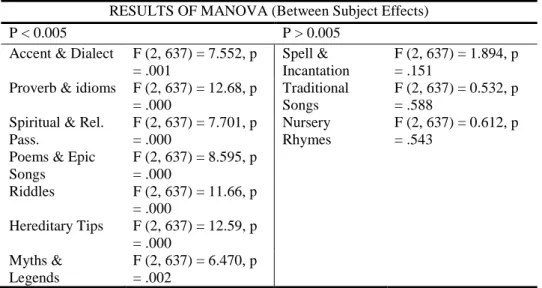
(23) PLANNING MALAYSIA Journal of the Malaysia Institute of Planners (2014). Multivariate Tests Table According to Multivariate Tests table, the highlighted significant value suggests that there is an effect of the 3 Age Categories towards the mean of Practice Regularity Score, F (20, 1258) = 5.199, p < 0.005 Test of Between-Subjects Effects Tests of Between-Subjects Effects table indicates that there are seven language forms as highlighted in yellow which have p value < 0.005. This shows that there are significant differences of mean score of practice regularity of the seven language forms between the ascending age categories. However, there are also three language forms as highlighted in red which have p value > 0.005. This shows that there are no significant differences of mean score of practice regularity of the three language forms between the ascending age categories. These language forms are Spell and Incantation, Traditional Songs and Nursery Rhymes. Table 2.6 is the overall result Manova test. Table 21: Interpretation of Manova Results of Mean Scores Practice Regularity for 10 Language Forms between 3 Ascending Age categories RESULTS OF MANOVA (Between Subject Effects) P < 0.005 P > 0.005 Accent & Dialect F (2, 637) = 7.552, p Spell & F (2, 637) = 1.894, p = .001 Incantation = .151 Proverb & idioms F (2, 637) = 12.68, p Traditional F (2, 637) = 0.532, p = .000 Songs = .588 Spiritual & Rel. F (2, 637) = 7.701, p Nursery F (2, 637) = 0.612, p Pass. = .000 Rhymes = .543 Poems & Epic F (2, 637) = 8.595, p Songs = .000 Riddles F (2, 637) = 11.66, p = .000 Hereditary Tips F (2, 637) = 12.59, p = .000 Myths & F (2, 637) = 6.470, p Legends = .002. 127. © 2014 by MIP.
(24) Aisyah Abu Bakar, Mariana Mohamed Osman, Syahriah Bachok & Mansor Ibrahim Analysis on Community Involvement in Cultural Activities: Transmission of Ethnic Language. Since there are differences of mean found between subjects in the Manova test, the null hypothesis is therefore rejected. This means that there are statistically significant differences of Mean Practice Regularity Score for 10 Language Forms between the 3 Ascending Age Categories. Up to this point, the statistical tests indicate that age influences practice regularity of most Language Forms and the overall Language Score. The statistical tests suggest that the older the respondents, the more regularly they practice their expressions of Language Forms, though some expressions of Language Forms indicate differently, especially Nursery Rhymes and Traditional Songs. These language forms have weakened the positive relationship between age and overall language score. However, at the same time this suggest that either the older respondents are showing lesser interest than younger respondents in expressing some of the language forms or the younger respondents are showing greater interests and commitment than older respondents in expressing some of the language forms. If this is the case, then different age categories have different interest, awareness and commitment in practice in different language forms. Then again, this outcome generalizes only on age categories for all respondents regardless of other demographic and socio-economic factors. LANGUAGE EXPERIENCES AND INFLUENCES ON COMMUNAL ACTIVITIES The respondents are inquired to address their level of three types of experience in the 10 Language Forms. These types of experiences are Exposure to Language Forms, Training of Language Forms and Knowledge on the basis of the Language Forms. The research attempts to determine the correlation between the three types of Language Experiences Score and Language Scores. A Pearson Correlation is implemented for this assessment. Table 22: Pearson’s Correlation Test of Language Score and Three Language Experiences H0: H1:. There are no significant correlations between the 3 types of Language Experiences and Language Scores There are significant correlations between the 3 types of Language Experiences and Language Scores Language Score. © 2014 by MIP. 128. Language Experiences Score Exposure Trained Informed.
(25) PLANNING MALAYSIA Journal of the Malaysia Institute of Planners (2014). Pearson Correlation 1 .504** Language Sig. (2-tailed) .000 Score N 640 640 **. Correlation is significant at the 0.01 level (2-tailed).. .498** .000 640. .502** .000 640. According to Table, all p values are less than 0.01 which imply that there are high level statistically significant correlations between the three types of Language Experiences and Language Score, Exposure (r = 0.505, p < 0.01), Trained (r = 0.498, p < 0.01) and Informed (r = 0.502, p < 0.01). This implies that there are positive correlations between Language Experiences and Language Scores. Since all correlations’ figures are between 0.4 and 0.6, all correlations’ strengths are considered moderate. This means that language experiences moderately influence Language Scores. There are other factors which influence Language Scores such as Practice of Ethnic Language, Demographic and Socio-Economic Factors which are highlighted earlier. The significances of Oral Traditions are reflected in respondents’ level of involvement in cultural and communal activities. The respondents are inquired to address their regularity in attending community gathering and rate their commitment towards their cultural community. Additionally, at the end of the questionnaire, the respondents are asked to address their level of awareness and involvement in their cultural activities. All of the respondents’ statements on the four mentioned inquiries are measured in Anchored 5 point scale. Language Experience Score is the sum of scores for the three types of Language Experiences mentioned earlier. The research attempts to observe the impacts of Language Score and Language Experience Score towards regularity in attending community gathering, commitment towards cultural community, awareness of cultural activities and involvement in cultural activities.. 129. © 2014 by MIP.
(26) Aisyah Abu Bakar, Mariana Mohamed Osman, Syahriah Bachok & Mansor Ibrahim Analysis on Community Involvement in Cultural Activities: Transmission of Ethnic Language. Table 23: Correlation of Language Experience Score, Language Score, Community Gathering, Commitment towards Community, Awareness and Involvement in Cultural Activities. Language Score. Attendance Community Gathering Pearson Correlation .293** Sig. (2-tailed) .000 N 640 Pearson Correlation .182** Sig. (2-tailed) .000. Language Experience Score N. 640. Commitment towards Community .356** .000 640 .207** .000 640. Awareness Involvement .407** .000 640 .512** .000. .455** .000 640 .451** .000. 640. 640. **. Correlation is significant at the 0.01 level (2-tailed).. Based on Table, all p values are less than 0.001 which implies that there are high level statistically significant correlations between every two variables being compared. All correlations display positive values which suggest that the increase of any of the variables influence the increase of other variables. However, none of the correlations are considered as strong correlations. Attendance Community Gathering and Commitment Community have low correlations with Language Score and Language Experience Score, while Awareness and Involvement variables have moderate correlations with Language Score and Language Experience Score. According to Language Score row, the highest correlation value is Involvement variable (r = 0.455, r2= 0.21), followed by Awareness (r = 0.407, r2 = 0.17), Commitment Community (r = 0.356, r2 = 0.13) and Community Gathering (r = 0.293, r2 = 0.09) respectively. This suggests that among the four, the highest percentage that can be attributed to Language Scores is Involvement variable, which is 21%. The remaining percentage of Language Scores is attributed to other variables. This means that 21% of Language Score affect Involvement in Cultural Activities. On the other hand, for Language Experience Score, the highest correlation value is Awareness variable (r = 0.512, r2 = 0.26), followed by Involvement (r = 0.451, r2 = 0.20), Commitment Community (r = 0.207, r2 = 0.04) and Community Gathering (r = 0.182, r2 = 0.03) respectively. This suggests that among the four, the highest percentage that can be attributed to Total Experiences is Awareness variable, which is 26%. The remaining percentage of Language Experience Score is attributed to other variables.. © 2014 by MIP. 130.
(27) PLANNING MALAYSIA Journal of the Malaysia Institute of Planners (2014). This means that 26% of Language Experience Score affect Awareness in Cultural Activities. This finding infers that in order for the respondents to be more involved in cultural activities, they have to practice their language forms and expressions more regularly. As well as that, in order for the respondents to have high awareness level of their cultural activities, they have to gain better knowledge and experience of their cultural language expression. CONCLUSION This paper reviews the significance of community character to practice of ethnic language and cultural language forms. It is found that community characters specifically referring to demographic and socio-economic factors influence the practice of their oral traditions. For cultural communities in Malacca, ethnicity and religion are two drivers of social geography. Thus expression of culture can be distinguished by locations since location represents majority of ethnicity and religion. Among the significant factors which affect ethnic language practice are Age, Location of Residence, Origin, Duration of residence, Ethnicity, Religion, Occupation, Job Promotes Culture, Education Levels, Household Income and Household Members. It is also found that Age significantly affects the level of practice regularity of cultural language forms. As the respondents grow older, it is more likely of them to practice their ethnic language forms. However, younger respondents have shown interests to practice Traditional Songs and Nursery Rhymes more than older respondents. Language is an important tool to ensure cultural heritage such as traditional wisdom and folklores are transmitted in the most genuine manner. As mentioned by Shigemoto (2003), “A language is the culmination of thousands of years of a people’s experience and wisdom. Moreover, it is the vehicle that transmits and perpetuates that wisdom.” (Shigemoto, J, 2003). Language is intricately combined with a unique view of the world, belief system, culture and literature. The surge of increasing homogenization of places causes the loss of distinctiveness and diversity which used to make lives interesting and profound. By understanding history and heritage through arts, celebrations and sharing institutions will strengthen a sense of cultural identity and distinctiveness of a place. Diversity promotes economic health as it fosters opportunity while non-diversity offers little prospect for future expansion, 131. © 2014 by MIP.
(28) Aisyah Abu Bakar, Mariana Mohamed Osman, Syahriah Bachok & Mansor Ibrahim Analysis on Community Involvement in Cultural Activities: Transmission of Ethnic Language. either in the form of personal growth or economic development. Designing for diversity combines the aesthetic interest of urban design with social objectives of urban planning. Sustainability rests on the ability of people to be involved in the contribution to the well-being of the society. Community’s opinions and perspectives must be regarded as important information in decision making processes. The involvement of the community in the significant cultural activities of a place heightens integration of social, political and economic aspects of the place (ICHC (2003), Newman P. & Jennings, I. (2008) & UNESCO (2003)). The future direction of this analysis is the assessment of community involvement in the remaining four domains of Intangible Cultural Heritage. They are Performing Arts, Knowledge, Social Practices and Traditional Craftsmanship. The involvement levels are analysed based on preferences and regularity of customary cultural expressions and practices. REFERENCES Asmah, O. (2004). The encyclopedia of Malaysia. Vol. 9: Languages and Literature. Singapore: Archipelago. Huebner, T. (1987). A socio-historical approach to literacy development: A comparative case study from the Pacific. In J.A. Langer (Ed.), Language, literacy, and culture: Issues of society and schooling. (pp. 178-196). Norwood, New Jersey: Ablex Publishing Co. Intangible Cultural Heritage Convention (ICHC). 2003. The Convention for the Safeguarding of Intangible Cultural Heritage. Retrieved January 4, 2011. http://www.unesco.org/culture/ich Newman, P., & Jennings, I. (2008). Cities as Sustainable Ecosystem. Principles and Practices. Washington D.C.: Island Press. Shigemoto, J. (2003). Language Change and Language Planning Policy. Retrieved October 4, 2011. http://www.prel.org/products/products/language-change.pdf United Nations Educational, Scientific and Cultural Organization (UNESCO). 2003. Implementing the Convention for the Safeguarding of Intangible Cultural Heritage.. © 2014 by MIP. 132.
(29)
Figure
+4

Related documents
Create display ads with beginner dance information Use logo, slogan, web site address. Include local contact information Ask for
Brand rate of duty drawback is granted in terms of rules 6 & 7 of Customs and Central Excise Duties Drawback Rules, 1995 in cases where the export product does not have any AIR
Each department would select the poorest schools that are well-managed, and have Section 21 status, and begin to subsidise Reception Year places at those schools at the
So, think of all people all over the world who buy sugared breakfast cereals that make health claims, for themselves, and their families including children.. Here is what
think of, for example, systems for the support of logistics management of a transport fleet, dynamic traffic management, as well as advanced driver support systems such as navigation
Here, we introduce FTT: transport, an evolutionary technol- ogy diffusion simulation model for road transport technology, as an IAM sub-component, which features sufficiently
In addition to these measures, hedges are also form using daily updated implied volatility (IV), fitted implied volatility (FPCIV) and directly estimated implied price change
Recommended UK MARKAL annual fixed O&M cost data for hydrogen production technologies for the period 2000–2050, for use in energy systems models.. See the text for a
