R E S E A R C H A R T I C L E
Open Access
A time-duration measure of continuity of
care to optimise utilisation of primary
health care: a threshold effects approach
among people with diabetes
Ninh Thi Ha
1, Mark Harris
2, David Preen
3, Suzanne Robinson
1and Rachael Moorin
1,3*Abstract
Background:Literature highlighted the importance of timely access and ongoing care provided at primary care
settings in reducing hospitalisation and health care resource uses. However, the effect of timely access to primary care has not been fully captured in most of the current continuity of care indices. This study aimed to develop a time-duration measure of continuity of primary care (“cover index”) capturing the proportion of time an individual is under the potentially protective effect of primary health care contacts.
Methods:An observational study was conducted on 36,667 individuals aged 45 years or older with diabetes
mellitus extracted from Western Australian linked administrative data. Threshold effect models were used to determine the maximum time interval between general practitioner (GP) visits that afforded a protective effect against avoidable hospitalisation across complication cohorts. The optimal maximum time interval was used to compute a cover index for each individual. The cover was evaluated using descriptive statistics stratified by population socio-demographic characteristics.
Results:The optimal maximum time between GP visits was 9–13 months for people with diabetes with no
complication, 5–11 months for people with diabetes with 1–2 complications, and 4–9 months for people with diabetes with 3+ complications. The cover index was lowest among those aged 75+ years, males, Indigenous people, socio-economically disadvantaged and those in very remote areas.
Conclusions:This study developed a new measure of continuity of primary care that adds a time parameter to
capturing longitudinal continuity. Cover has the potential to better capture underuse of primary care and will significantly contribute to the sparsely available methods for analysis of linked administrative data in evaluating continuity of care for people with chronic conditions.
Keywords:Cover index, Continuity of care, Optimal time interval, Diabetes mellitus, Primary care, Potentially preventable hospitalisation
© The Author(s). 2019Open AccessThis article is distributed under the terms of the Creative Commons Attribution 4.0 International License (http://creativecommons.org/licenses/by/4.0/), which permits unrestricted use, distribution, and reproduction in any medium, provided you give appropriate credit to the original author(s) and the source, provide a link to the Creative Commons license, and indicate if changes were made. The Creative Commons Public Domain Dedication waiver (http://creativecommons.org/publicdomain/zero/1.0/) applies to the data made available in this article, unless otherwise stated.
* Correspondence:[email protected];[email protected] 1Health systems and Health economics, School of Public Health, Curtin University, Perth, Western Australia 6845, Australia
3Centre for Health Services Research, School of Population and Global Health, The University of Western Australia, 35 Stirling Highway, Crawley, WA 6009, Australia
Background
Given current pressures experienced by most health sys-tems improvements in care delivery are needed to make the system more effective, efficient and sustainable. Over recent years the focus in many countries has been the enhancement of primary health care to reduce poten-tially preventable hospitalisations (PPH) which are often costly and undesirable for patients [52]. The rationale behind this is that timely utilisation and effective treat-ment in primary health care (PHC) settings for people with chronic conditions could afford a protective effect in preventing complications and adverse health events [10, 47]. For common chronic conditions such as dia-betes, heart failure and asthma, a shift in focus from acute to primary care has the potential to delay or even prevent the onset of complications and reduce PPH. This theory surrounding ‘ambulatory care sensitive con-dition’has been the driver of many policies aimed at in-creasing long-term ongoing, rather than sporadic or episodic, contact with a General Practitioner (GP).
The Australian government has set a focus on strengthening the PHC system to address inequities and future challenges of chronic diseases [15]. One of the ways this is being undertaken is by providing financial incentives for aspects of PHC and general practitioner (GP) behaviour, such as the introduction of Primary Health Networks, Integrated Care Models, Service/Prac-tice Incentive Payments, Health Care Homes, Chronic Disease Management Medicare Benefits Scheme items
and Home Medication Reviews [39]. Although GPs act
as the gatekeeper of the health care system in Australia, it is not required that individuals register with a single practitioner or general practice. People are free to visit any GP they wish and can visit multiple GPs and general practices simultaneously. The role of GPs has been emphasised that GPs are the only physicians appropriate for taking the leading roles in the primary health care team and coordinating with other health care profes-sionals into providing the best patient centred care in-cluding diagnosis, treatment and management [5].
Continuity of care (COC) is an important component of high-quality primary care as it is associated with in-creased patient satisfaction, quality of life and health outcomes [29,42,45,49]. New models of care often rely on the theoretical link between COC and better health outcomes. A well-known conceptual framework of con-tinuity of care proposed that concon-tinuity of care is a com-bination of three essential components: interpersonal continuity, management continuity and informational continuity [29,32]. Interpersonal continuity is defined as an ongoing relationship between a patient and the same provider where the relationship between patients and providers are strengthen through mutual familiarity and personal trust [32]. Informational continuity is a link
between providers to share comprehensive information about patients’ history of care and circumstances that helps to reduce duplicative and wasteful resources [32]. Management continuity is a collaboration between pro-viders to ensure services delivered regularly and comple-mentary and especially important in chronic and complex conditions which require management from multiple providers [32]. A sufficient continuity of care requires a presence of both care of an individual and proper management of care linked over time (Barker, Steventon, and Deeny 2017; [32]).
Although interpersonal continuity of care can be easily measured and widely used in literature [6,7,12,18,42], it is becoming more difficult to sustain due to the chan-ging size of practices over time and to the recent evolu-tion of large multi-partner (or corporate) practices rather than the solo-practice model common in previous decades (Gulliford, Naithani, and Morgan 2006; [32]). In the current context of a high burden of complex and multiple chronic conditions, health care for people with complex needs is now extended to a wide range of skills and settings to better manage chronic conditions [28,29]. Thus, the view of continuity of care is concerned with management continuity - the extent of health care pro-vided over time in a coordinated manner with appropriate response to patients’needs [28]. While continuity of care is a complex multi-dimensional concept, current measures of continuity of care mostly reflect interpersonal continu-ity of care [6,7,36,38]. Development of measures which can integrate management aspect of continuity would be useful to support comprehensive evaluations on continuity of care and optimising efficiency in management of chronic disease.
Few recent studies have considered management as-pect of continuity of care in term of regularity of visiting GPs which captures the degree of regular contact with PHC providers [19, 20, 26]. Studies reported that regu-larity of contact is more important than the frequency of contact for reducing number and costs of hospitalisa-tions [55,56]. Greater regularity of visits more likely in-dicates care which is planned and proactive, while visits on an irregular basis (even if frequent/numerous) likely indicate care which is unplanned or reactive and thus
not indicative of good ongoing management [43].
Current evidence also shows that use of the Enhanced Primary Care Medicare items increases regular PHC contact in the following year [26,55], suggesting that re-gularity is suitable as a target for health policy interven-tion [25,26].
provide adequate management of the patient’s condition and therefore some of the protective effects of regular care may be lost. Although the concept of time duration between services is relative new in health care services research, it has been integrated in other research areas such as customer relationship management [35,40,41, 46] and pharmaceut-ical studies to capture medication persistence–a proportion of time duration under adequate medication supply [9,48]. Our new metric–the Cover Index is defined as the propor-tion of days, within a fixed ascertainment period (preferably 1 year since this is the time period that current chronic dis-ease management plans are based [50]) that a patient is con-sidered under the ‘protective effect’ of their PHC contact and at reduced risk of PPH. In contrast to drug utilisation studies where medication protective effect is well defined, in primary care, no data exist providing the duration over which a GP visit has the potential to protect a patient from an adverse event or complication of their chronic disease.
We hypothesise that interaction with a GP can protect a patient from experiencing a diabetes-related potentially pre-ventable hospitalisation and that this protective effect can be maintained if GP interactions fall within a particular max-imum time interval (i.e. do not exceed this time) named the
“optimal maximum time interval”. Our study aimed to de-velop a methodology for determining“cover”of primary care using individual-level linked administrative data by (i) esti-mating the optimal maximum time interval over which pri-mary care affords an increased protection from PPH using threshold effects models; and (ii) using the derived optimal time period to operationalise“cover”at the individual level.
Methods
Time-duration index of continuity of primary care (cover) development
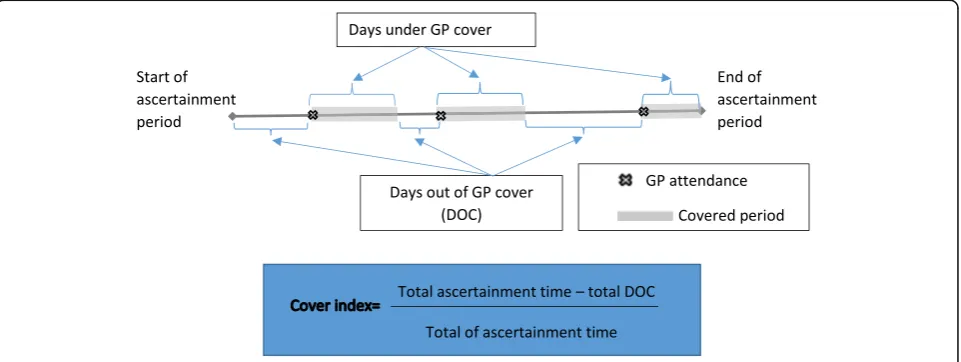
The proposed time-duration index, which we call“Cover”, is defined as the proportion of time that an individual is
under the potentially protective effect of PHC (via contact with their GP) over a pre-specified ascertainment period. Construction of the index relies on first determining a period of time between GP visits that a patient with a stated set of socio-demographic and clinical characteristics has a reduced probability of PPH. We term this the‘
opti-mal maximum time interval’. Once this optimal time
period has been determined cover can be calculated as shown in Fig.1. Briefly, the actual time interval (in days) between each GP attendance within the ascertainment period is first determined. This time is then compartmen-talised into within and outside of the pre-defined optimal maximum time interval for persons with pre-defined char-acteristics in that year. The number of days within the op-timal maximum time interval (i.e. days covered) are then aggregated over an ascertainment period for each individ-ual in the complication cohort and the proportion of the total number of days eligible for cover over the ascertain-ment period calculated. This provides the cover index, which has a value between 0 and 1, for each individual in each year in our scenario (or some other time period chosen based on specific clinically or policy based ration-ale). A higher score reflects a greater proportion of time
‘covered’. Although methods used to calculate the cover score were demonstrated in complication cohorts of people with diabetes, the methods are applicable to other ambulatory care sensitive conditions.
Estimation of the optimal time interval for GP services in people living with diabetes
Data sources
Western Australia (WA) whole-of-population adminis-trative health data linked at the individual level for adults aged 18 years or older enrolled to vote in WA at any time between 1 July 1990 and 30 June 2004 were used for this study. The data included four datasets: WA
[image:3.595.59.540.535.716.2]Hospital Morbidity Data System (HMDS); Medicare Benefits Scheme (MBS) claim records; WA Electoral Roll (ER) records and WA mortality records. The HMDS provided information on diagnosis, date of ad-mission and date of discharge from all WA hospitals. The MBS provided information on services provided outside the hospital (for example GP services) and in-cluded the date of service and type of medical service. The ER provided information on dates of migration in and out of WA or changes in a residential address while living in WA. Mortality records provided date and cause of death. WA data were linked and extracted via the
WA Data Linkage System (WADLS)[33] and MBS data
by the Commonwealth Department of Health and Age-ing usAge-ing a linkage key provided by the WADLS.
Study population
The study population consisted of people living with dia-betes aged 45 years and older in WA for the years 1998/ 99 to 2003/04. Individuals with diabetes mellitus were determined using the International Classification of Dis-ease, 9th edition-clinical modification (ICD-9-CM) codes in HMDS records and MBS claims indicative of the presence of diabetes using all the available data and has been described previously [31]. Three diabetes complica-tion cohorts were constructed for this study depending on level of disease at each observed year: no diabetes compli-cations, 1–2 complications and 3+ complications. Compli-cation severity level was assessed using the compliCompli-cation severity index suggested by Young et al. [57] and stratified into three groups as outlined previously [31].
All individuals were observed annually from the baseline year to 30 June 2004, or last year living in WA or death with the data constructed as a panel (with years nested within a person). Only individuals who were alive and resi-dent in WA for at least two consecutive years were in-cluded in the study. Individuals could move to a higher complication cohort if their complication status changed as ascertained at the end of each observed year. Within each complication cohort, we measured individual characteristics including GP utilisation, hospitalisations, complications, co-morbidities and socio-demographic characteristics in each observed year, and GP utilisation and hospitalisations in the following year. A similar design has been applied in other studies [13,31].
Ethical approval was provided by The University of Western Australia and Curtin University Human Re-search Ethics Committees.
Dependent variable
The number of diabetes-related potentially preventable hospitalisations during each follow-up year was the main outcome of the study. Diabetes-related hospitalisations were identified using ICD-9-CM and ICD-10-AM codes
suggested by the National Health Performance Frame-work [1] and hospitalisations where diabetes was identi-fied as a significant risk factor by Davis et al. [14].
Independent variables
GP utilisation including frequency of GP services and the time interval between GP services were focal mea-sures in this study. For each individual, the date of GP services within a financial year was identified in MBS data. The time between GP visits was determined by number of days: (1) between GP visits within a financial year and; (2) between the date of first GP visit of a finan-cial year and the date of the last GP visit in the previous financial year(s) looking back up to 3 financial years. In the case where a hospitalisation was observed, time was counted either to the first GP visit post-hospitalisation provided that the GP visit was within 14 days of dis-charge or from day 14 after hospital disdis-charge date and the next GP visit [37]. The 14 day rule was applied based on a large scale study which suggests that timely follow-up within 14 days of discharge may be considered to reduce the risk of readmission for patient with mul-tiple complex chronic conditions such as diabetes, heart disease and chronic obstructive pulmonary disease [37] and that time in excess of that would be deemed“out of cover”. The time intervals within a financial year were used to calculate the mean time interval for a GP visit, the variance of the time intervals and maximum time interval to a GP visit in months (or part thereof ) of the financial year for each individual.
As mean time interval reflects central tendency of time intervals between services, two individuals can have the same mean time interval but their maximum time inter-val may be entirely different. In addition, the maximum time interval is more likely to capture the period of time that people were not covered by any protective effect of GP service contact than mean time interval. Thus, the maximum time interval to a GP visit in the following year was used as the main predictor of the number of hospitalisation in all analyses while mean time interval, frequency and regularity in the same year as well as mean time interval and regularity in the last year com-prised covariates.
associated with the existing episode of care rather than being indicative of a new episode (e.g. returning for the results of tests), recommended in the literature [17].
A number of individual socio-demographic and clinical characteristics were also measured. Demographic charac-teristics included were age groups (45–59 years, 60–74
years and≥75 years), gender, and Indigenous status.
Socio-economic status was assessed annually using quin-tiles of the Census specific Socio-Economic Indexes for Areas (SEIFA) Index of Relative Socioeconomic Disadvan-tage [4]. Service accessibility was measured annually clas-sified as very remote, remote, moderate, accessible and highly accessible [3]. The number of comorbidities was
summed using MACSS index [34], excluding conditions
classified as complications of diabetes. Duration of dia-betes was calculated in years from the first identification in WA linked data. Other use of health services was accounted for by capturing the number of specialist visits and the number of non-diabetes related hospitalisations in each financial year.
Average cost per hospitalisation was calculated and used to describe the characteristics of each complication cohort but not used as a controlling variable in regres-sion models. Costs were assigned using Australian Re-fined Diagnostic Related Group costs from the National Hospital Cost Data collection and National Efficient Price of the Independent Hospital Pricing Authority [16]. All costs were adjusted to 2014 Australian dollar using the Consumer Price Index.
Statistical analyses
The data for each complication cohort were constructed as a panel data structure with multiple measures for each individual, such that response and control variables could vary over the study period. Panel data were com-plex and unbalanced as individuals could move in and out of WA, die or move to higher complication level co-hort during the study period. Characteristics of the population were described for each complication cohort at the time entering to the cohort.
To estimate the optimal maximum time interval we employed threshold effects model proposed by (Gannon, Harris, and Harris 2014) to examine how the relation-ship between GP service and diabetes-related potentially preventable hospitalisation varies with the length of the time interval (the maximum time interval) between GP services. The model proceeded by searching for sample heterogeneity in the response of diabetes-related poten-tially preventable hospitalisation to variation in the time interval between GP services across populations in each complication cohort. The information criteria approach including Bayes Information Criterion (BIC) and Akaike Information Criterion (AIC) statistics was used to select the optimal model. The selected model was used to
identify a number of subpopulations defined in terms of length of the time interval between GP services. The op-timal model was used to suggest the maximum opop-timal time interval between GP services where the number of diabetes-related potentially preventable hospitalisations was minimal. The threshold effects model evaluates all subpopulations simultaneously rather than sequentially and therefore extends towards a non-linear model [22,
23,27] that allows more flexibility in examining the
rela-tionship between GP service and the risk of
diabetes-related potentially preventable hospitalisation. This approach has been applied in previous studies [24,
31].
The threshold effects model in our study was an ex-tension of the random effects negative binomial model for panel data which accounts for time-variant factors and unbalance in the data structure. The general form of the model for individualiin yeartpresented as follows:
HOSPit ¼
XM
m¼1
γmRm;i ðTInti;t
GPsvci;tGPsvci;t¼1TInti;t≤18
þβ1 D1¼1jGPsvci;t¼0
þβ2 D2¼1jTInti;t>18
Tinti;t
þβ1Xi;tþβ2xi;tþαiþHOSPt0þUi;t
þβ0
;i¼1;2…N;t¼1;2…;T
The equation is the hypothesised differential effect of GP services (GPsvci, t) on diabetes-related PPH (HOSPit) with respect to an individual’s position with regard to the maximum time interval (TInti,t)to the next GP ser-vice. The threshold model allows the coefficient γm on GP service to vary according to the time interval to a GP service (in month) indicated by subpopulation indi-cators: Rm, i= 1 if {τm−1<Tinti, t≤τm}, and 0
other-wise, where m is the number of subpopulation andτis
the threshold parameters. The number of subpopulation m (1, 2, 3…M) and the threshold parametersτwas es-timated from the data. The model splits the data into M subpopulations. The M = 1 setting gives the constant co-efficient as a standard negative binomial model.
The threshold variable Ri only took values from 1 to 18 for two reasons: 1) 99% of the population in each complication cohort had a maximum time interval to a
GP service ≤18 months, the sample size for the time
The threshold effects model included a dummy vari-able (D1) for any observation with no GP service in a fi-nancial year to control for, rather than excluding, the observation. The model also included demographic and clinical characteristics in the observed years and GP util-isation in both observed and follow-up years in the nota-tion Xi, t to control for any confounding. Endogeneity due to a correlation between the error term and the maximum time interval has been minimized by adding
Mundlak variables xi,t, which are group means of
time-varied variables including frequency of GP visits, regularity of GP visits and comorbidities. The group mean of time-varied variables relax the assumption of the random-effects estimator that unobserved factors were independent with the observed factors [11,44]. In addition, the model also included initial conditions (his-tory of hospitalisation at the baseline year, and GP utili-sations in the previous years) to adjust for effects of unobserved heterogeneity [54].
All competing models were compared using their BIC and AIC statistics. The preferred model was the one which minimised the appropriate information criteria (AIC and BIC) [23]. Within each diabetes complication cohort, the preferred model indicated the maximum time interval to a GP service which had minimal risk of diabetes-related potentially preventable hospitalisations and suggested the maximum optimal time interval to a GP service corresponding to each diabetes complication cohort that was subsequently used to operationalise the cover index.
All analyses were conducted using STATA for Window version SE14.1.
Operationalizing the cover index in the diabetes cohort
In this demonstration, the cover index was calculated for each financial year (July 1st to June 30th) for the studied period of 1998 to 2004, date of death or date of leaving WA which ever came first. The year of death was excluded from the analysis. Thus, part-years were not considered in the Cover Index calculation. For each financial year, the ascertainment days were the total number of days that people were living in the commu-nity (i.e. not in hospital).
Days out of GP cover (DOC) were calculated by sub-traction of the pre-defined optimal maximum time inter-val (updated according to diabetes severity level) from the actual time interval between a GP service and the next health care service (either GP or hospital admis-sion). Thus, by definition DOC values were positive. Any time interval that was shorter than the optimal max-imum time interval was deemed as “under cover”, thus, DOC was counted as zero.
The cover index = [∑ascertainment days - ∑DOC] /
∑ascertainment days] was calculated for each individual
annually. As the optimal maximum time interval was identified as a range of values from the threshold effects model, the cover index was calculated with low, middle and upper values bounds corresponding to low, middle and upper values of the optimal maximum time interval identified for each complication cohort (Fig.1).
Values of cover were reported by socio-demographic characteristics of the cohort to explore the range of scores and serve to evaluate the face validity of the cover index in capturing vulnerable groups which traditionally have poor continuity of primary care.
Results
Characteristics of diabetes complication cohorts at the time entering the cohort
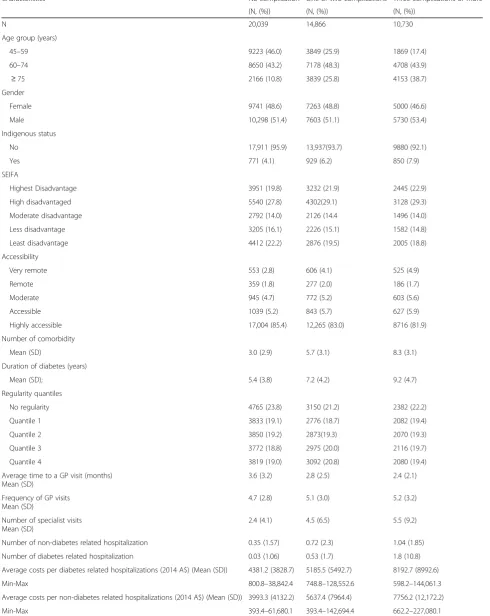
A total of 36,667 individuals aged 45 years or older were classified as living with diabetes in WA in this study. Since individuals could change complication cohorts (i.e. move to a higher complication group) throughout the study the total number of individuals shown in Table 1
reflects the number of individuals who were classified in that particular complication cohort at any time and is thus larger than the total number of individuals in the study. The complication cohorts are not mutually sive over the entire study period but are mutually exclu-sive within individual years (i.e. an individual cannot be in more than one complication cohort in the same fi-nancial year). During the studied period, 8968 individ-uals changed complication cohorts.
Characteristics of the individuals at the time of entry into each complication cohort is presented in Table 1. Compare with individuals in the cohort with no compli-cation, individuals in cohorts with higher complications were older (38.7% of those in three complication cohort and 25.8% of those in one or two complication cohort aged 75 years or older vs. 10.8% among those with no complication); had a higher number of comorbidities (average of 8.3 and 5.7 vs. 3.0 comorbidities, respect-ively); a longer duration of diabetes (9.2 years and 7.2 years vs. 5.4 years, respectively), a higher number of hos-pitalisations (1.8 and 0.53 hospitalisation per year vs. 0.03 hospitalisation per year, respectively) and higher average cost per hospitalisation (AU$ 7756.2 and AU$ 5637.4 per hospitalisation vs. AU$ 3993.2). However, other characteristics such as gender, socio-economic sta-tus and accessibility to services and GP usage did not vary between complication cohorts.
Estimation of the optimal maximum time intervals for each diabetes complication cohort
Table 1Characteristics of studied population at the time entering each complication cohort
Characteristics No complication One or two complications Three complications or more
(N, (%)) (N, (%)) (N, (%))
N 20,039 14,866 10,730
Age group (years)
45–59 9223 (46.0) 3849 (25.9) 1869 (17.4)
60–74 8650 (43.2) 7178 (48.3) 4708 (43.9)
≥75 2166 (10.8) 3839 (25.8) 4153 (38.7)
Gender
Female 9741 (48.6) 7263 (48.8) 5000 (46.6)
Male 10,298 (51.4) 7603 (51.1) 5730 (53.4)
Indigenous status
No 17,911 (95.9) 13,937(93.7) 9880 (92.1)
Yes 771 (4.1) 929 (6.2) 850 (7.9)
SEIFA
Highest Disadvantage 3951 (19.8) 3232 (21.9) 2445 (22.9)
High disadvantaged 5540 (27.8) 4302(29.1) 3128 (29.3)
Moderate disadvantage 2792 (14.0) 2126 (14.4 1496 (14.0)
Less disadvantage 3205 (16.1) 2226 (15.1) 1582 (14.8)
Least disadvantage 4412 (22.2) 2876 (19.5) 2005 (18.8)
Accessibility
Very remote 553 (2.8) 606 (4.1) 525 (4.9)
Remote 359 (1.8) 277 (2.0) 186 (1.7)
Moderate 945 (4.7) 772 (5.2) 603 (5.6)
Accessible 1039 (5.2) 843 (5.7) 627 (5.9)
Highly accessible 17,004 (85.4) 12,265 (83.0) 8716 (81.9)
Number of comorbidity
Mean (SD) 3.0 (2.9) 5.7 (3.1) 8.3 (3.1)
Duration of diabetes (years)
Mean (SD); 5.4 (3.8) 7.2 (4.2) 9.2 (4.7)
Regularity quantiles
No regularity 4765 (23.8) 3150 (21.2) 2382 (22.2)
Quantile 1 3833 (19.1) 2776 (18.7) 2082 (19.4)
Quantile 2 3850 (19.2) 2873(19.3) 2070 (19.3)
Quantile 3 3772 (18.8) 2975 (20.0) 2116 (19.7)
Quantile 4 3819 (19.0) 3092 (20.8) 2080 (19.4)
Average time to a GP visit (months) Mean (SD)
3.6 (3.2) 2.8 (2.5) 2.4 (2.1)
Frequency of GP visits Mean (SD)
4.7 (2.8) 5.1 (3.0) 5.2 (3.2)
Number of specialist visits Mean (SD)
2.4 (4.1) 4.5 (6.5) 5.5 (9.2)
Number of non-diabetes related hospitalization 0.35 (1.57) 0.72 (2.3) 1.04 (1.85)
Number of diabetes related hospitalization 0.03 (1.06) 0.53 (1.7) 1.8 (10.8)
Average costs per diabetes related hospitalizations (2014 A$) (Mean (SD)) 4381.2 (3828.7) 5185.5 (5492.7) 8192.7 (8992.6)
Min-Max 800.8–38,842.4 748.8–128,552.6 598.2–144,061.3
Average costs per non-diabetes related hospitalizations (2014 A$) (Mean (SD)) 3993.3 (4132.2) 5637.4 (7964.4) 7756.2 (12,172.2)
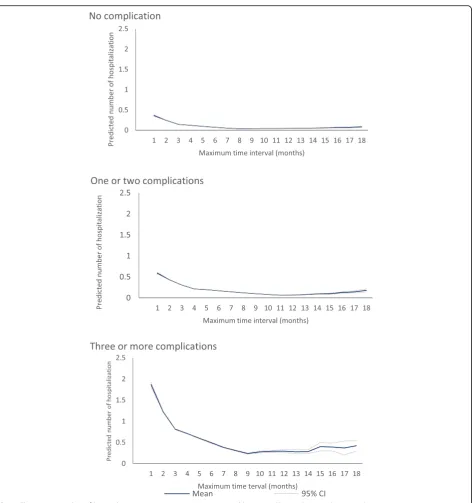
services by complication cohort. Based on both BIC and AIC, the preferred models indicated a non-linear rela-tionship between maximum time interval between GP visits and the number of hospitalisations with five sub-populations in both no complication cohort and one or two complication cohort and four subpopulations in three or more complication cohort (Table 2). Overall, the expected number of diabetes related PPH was ob-served lowest in a maximum time interval between GP visits of 9 months to 13 months for diabetes with no complication; 5 months to 11 months for diabetes with one or two complications; and 4 months to 9 months for diabetes with three or more complications. For no com-plication cohort, the average number of predicted dia-betes related potentially preventable hospitalisation within the optimal maximum time interval was 0.044 (95%CI, 0.043–0.045) admissions while the number was significantly higher among the sub-optimal time inter-vals (0.127 (95%CI, 0.126–0.128)). For one or two com-plication cohort, the average number of predicted diabetes related potentially preventable hospitalisation within the optimal maximum time interval was 0.159 (95%CI, 0.158–0.160) admissions while the number of hos-pitalisation was significantly higher among sub-optimal time interval (0.314 (95%CI, 0.311–0.316)). For three or more complication cohort, the predicted number of dia-betes related potential preventable hospitalisations within the optimal maximum time interval was 0.589 (95%CI, 0.583–0.595) admissions while the number of hospitalisa-tions was significantly higher among the sub-optimal time interval (1.15, 95%CI 1.14–1.16). The change in the number of predicted diabetes-related potentially preventable hospi-talisations across the maximum time interval between GP visits using spline function is also presented in Fig.2.
Cover index and its distributions
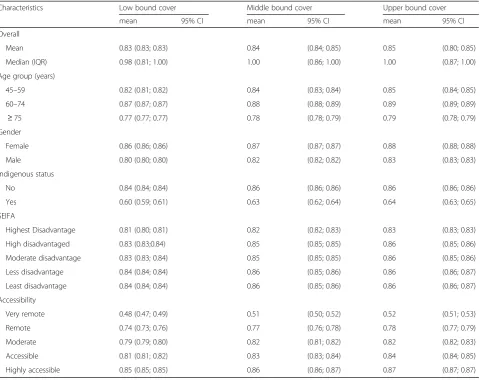
Table 3 shows the annual average cover index score
overall for the whole studied population and by socio-demographic characteristics. Overall, the average cover score was 0.85 (upper bound) (95%CI 0.80 to 0.85) indicating that on average, in this cohort, 85% of the year people with diabetes were under the potentially protective effect of PHC via contact with their GP. How-ever, only 83% of the time period was covered if the lower boundary of the optimal maximum time interval was considered rising to 84% of the time interval cov-ered if the middle bound of the optimal maximum time interval was considered. The cover index score changed by socio-demographic characteristics. The lowest aver-age cover index scores across low, middle and upper bounds was observed among those aged 75 years or older (0.77–0.78 - 0.79, respectively), males (0.80–0.82 -0.83, respectively), indigenous (0.60–0.63 - 0.64, respect-ively), having highest disadvantage (0.81–0.82 - 0.83,
respectively) and living in very remote areas (0.48–0.51 -0.52, respectively).
Discussion
Our study aimed to develop and operationalise the cover index, a novel measurement of continuity of primary care that represents an improvement in existing mea-surements of regularity of primary care through ac-counting for a time-limited protective effect achieved from interaction with a GP. This study presented an em-pirical approach to estimate the optimal time period for GP cover in a diabetes patient population in order to demonstrate its operationalisation, however, we suggest that the cover index could be flexibly operationalised with a range of a priori optimal time periods, such as those based on expert opinion or clinical guidelines, if applicable, to aid in both the development and evaluation of policies incentivizing provider-patient interactions. Dif-ferences in the cover index score operationalised in this way could be used as to evaluate the impact of such opin-ion, guidelines or policy on potentially preventable hospi-talisations. The tremendous growth in the availability and range of whole-of-population administrative health data-sets provide opportunities to measure the performance of health systems and evaluate the impact of health policy. However, currently available metrics are limited in their sophistication regarding the domains within utilisation they capture. The cover metric would significantly con-tribute to the advancement of available methods for the analysis of these data.
In these data, the threshold model indicated the opti-mal maximum time interval of 9–13 months for diabetes without complication, 5–11 months for one or two com-plications and 4–9 months for three or more complica-tion where the risk of hospitalisacomplica-tion was minimised. This finding is in line with the recommendation in pri-mary care guidelines for diabetes [2, 51] which suggest people with diabetes should receive primary care at regular intervals of 3–12 months depending on the com-plexity of individual needs. In addition, our findings are consistent with growing evidence that optimised primary care use may improve health outcomes and reduce re-sources used [30, 58]. However, current evidence does not clearly indicate specific time intervals for different disease severity levels, which may limit the ability to ef-fectively measure primary care performance and utilisa-tion. In addition to facilitating the operationalisation of cover our findings provide an important insight into pri-mary care needs of people with diabetes corresponding to their severity level that may provide evidence for im-provement of primary care performance.
Table 2 Threshold search for max time to a GP visits by complications for people aged 45 years or older Comp lication cohort s No compl ication (a) One or two compl ication s (b) Three or more complic ations© Numb er of subpopulati ons 234561 8 23 4 5 61 8 23 4 5 1 8 AIC 45,1 69.0 45,0 91.2 45,0 49.5 45,020 .4 45,017 .6 45,018 .7 53,464. 2 53,413. 6 53,360 .2 53 ,346.5 53,408. 3 53,340. 3 69,875. 6 69,812. 3 69,7 74.9 69,769. 4 69,777. 3 BIC 45,3 98.5 45,3 29.9 45,2 97.3 45,277 .4 45,283 .8 45,450 .1 53,683. 6 53,641. 8 53,597 .2 53 ,592.3 53,662. 8 53,752. 9 70,086. 1 70,031. 2 70,0 02.3 70,005. 2 70,173. 0 Thresho ld parame ters τ1 88222 – 10 2 2 2 3 – 92 2 2 – τ2 1 3 833 – 10 3 3 6 – 33 3 – τ3 13 8 8 – 11 4 7 – 99 – τ4 13 10 – 11 9 – 13 – τ5 13 – 11 – Coeffic ients γ1 − 0.229*** − 0.249*** − 0.040 0.134* * 0.123* * – − 0. 194*** − 0.01 5 0.194* ** 0. 323*** − 0. 165*** – − 0.12 8*** 0.289*** 0.19 6*** 0.190*** – (0.01 ) (0.01 ) (0.03 ) (0.05 ) (0.05 ) – (0.01 ) (0.03 ) (0.04 ) (0.0 5) (0.03 ) – (0.01) (0.03) (0.03 ) (0.03) – γ2 − 0.083*** − 0.12 6*** − 0.19 9*** − 0.057 − 0.064* – − 0.053* ** − 0.157* ** 0.006 0. 087** − 0. 216*** – − 0. 014 0.115*** 0.05 4* 0.050* – (0.01 ) (0.01 ) (0.02 ) (0.03 ) (0.03 ) – (0.01 ) (0.01 ) (0.02 ) (0.0 3) (0.02 ) – (0.01) (0.02) (0.02 ) (0.02) – γ3 − 0.013 − 0.101*** − 0.148*** − 0.152* ** – − 0.03 9** − 0.099* ** − 0.023 − 0.188* ** – − 0.00 1 − 0.04 6** − 0.048* * – (0.01 ) (0.01 ) (0.02 ) (0.02 ) – (0.01 ) (0.01 ) (0.0 2) (0.02 ) – (0.01) (0.02 ) (0.02) – γ4 0.00 4 − 0.072*** − 0.089*** – − 0. 000
− 0.071***
[image:9.595.110.484.84.733.2]density of GP services [21] to examine utilisation of GP services. In countries where GPs are the gatekeepers to ac-cess for most medical services, using these approaches may not capture underutilisation of GP services. Our study suggests using the maximum time interval between health care services in examining the relationship with the risk of hospitalisation since the maximum time interval drives attention towards the “long overdue period” likely to reflect discontinuity of GP care and lost opportunities for early treatment in the primary care setting.
[image:10.595.66.539.83.587.2]information to target health care resources and provide a tool to accurately quantify the improvement in primary care resulting from interventions. Given the high burden of hospitalisation, improvement in GP cover would offer a cost-effective opportunity to reduce the costs of hospi-talisation, especially among those with multiple compli-cations. While not explored in this paper, in addition to capturing periods that are not covered, the metric could also be adapted to capture periods of “over cover” and thus be used to measure over as well as under servicing.
Strengths and limitation of the study
The major strength of our study was using a threshold effects model, an advanced and flexible approach to comprehensively estimate the optimal time interval for a GP visit. A further strength of this study is the large population and comprehensive range of linked databases used in the empirical analysis that allowed us to measure and control any changes in both outcomes and expo-sures over the studied period.
The cover metric developed in this paper does not in-corporate the number of GPs or GP practices visited. Since the purpose of the metric is to determine the in-fluence of the time between visits adjusting for other di-mensions of continuity (e.g. via the usual provider index, the frequency of visits and the number of practices vis-ited) in models would be superior to incorporating these dimensions of continuity in the metric. Therefore, inclu-sive measure of time duration in the design of the Cover Index is a strength, since using the cover metric with separate adjustment for other dimensions of continuity allows the impact of the time duration component to be separated from other components. This is more valuable to practitioners and policy makers than a metric that re-ports a combined impact. Interaction terms could be used for evaluating various combinations of dimensions if required.
[image:11.595.59.542.98.478.2]Our study has some limitations to consider when inter-preting the results. The empirical analyses were conducted using data from 1990 to 2004, hence it cannot provide
Table 3Average yearly cover score across maximal optimal time interval boundary over the studied period
Characteristics Low bound cover Middle bound cover Upper bound cover
mean 95% CI mean 95% CI mean 95% CI
Overall
Mean 0.83 (0.83; 0.83) 0.84 (0.84; 0.85) 0.85 (0.80; 0.85)
Median (IQR) 0.98 (0.81; 1.00) 1.00 (0.86; 1.00) 1.00 (0.87; 1.00)
Age group (years)
45–59 0.82 (0.81; 0.82) 0.84 (0.83; 0.84) 0.85 (0.84; 0.85)
60–74 0.87 (0.87; 0.87) 0.88 (0.88; 0.89) 0.89 (0.89; 0.89)
≥75 0.77 (0.77; 0.77) 0.78 (0.78; 0.79) 0.79 (0.78; 0.79)
Gender
Female 0.86 (0.86; 0.86) 0.87 (0.87; 0.87) 0.88 (0.88; 0.88)
Male 0.80 (0.80; 0.80) 0.82 (0.82; 0.82) 0.83 (0.83; 0.83)
Indigenous status
No 0.84 (0.84; 0.84) 0.86 (0.86; 0.86) 0.86 (0.86; 0.86)
Yes 0.60 (0.59; 0.61) 0.63 (0.62; 0.64) 0.64 (0.63; 0.65)
SEIFA
Highest Disadvantage 0.81 (0.80; 0.81) 0.82 (0.82; 0.83) 0.83 (0.83; 0.83)
High disadvantaged 0.83 (0.83;0.84) 0.85 (0.85; 0.85) 0.86 (0.85; 0.86)
Moderate disadvantage 0.83 (0.83; 0.84) 0.85 (0.85; 0.85) 0.86 (0.85; 0.86)
Less disadvantage 0.84 (0.84; 0.84) 0.86 (0.85; 0.86) 0.86 (0.86; 0.87)
Least disadvantage 0.84 (0.84; 0.84) 0.86 (0.85; 0.86) 0.86 (0.86; 0.87)
Accessibility
Very remote 0.48 (0.47; 0.49) 0.51 (0.50; 0.52) 0.52 (0.51; 0.53)
Remote 0.74 (0.73; 0.76) 0.77 (0.76; 0.78) 0.78 (0.77; 0.79)
Moderate 0.79 (0.79; 0.80) 0.82 (0.81; 0.82) 0.82 (0.82; 0.83)
Accessible 0.81 (0.81; 0.82) 0.83 (0.83; 0.84) 0.84 (0.84; 0.85)
evidence regarding current utilisation of GP services. How-ever, for the purposes of this paper, which sought to de-velop and operationalise the cover metric, the lack of contemporaneous data is unimportant. The cover metric could have been developed solely using synthetic data; how-ever the use of these historical data is a strength because they allowed us to develop the metric using real world rela-tionships between GP visits and other covariates and also afforded us the opportunity undertake face validity of the metric during the development stage. In addition, the use of these historical data could be considered a strength be-cause this particular time period incorporates a period in Australia with little intervention aimed at increasing provision of primary care for people with chronic condi-tions. Thus, the data in this period could, with appropriate control of confounding factors, provide the baseline needed to identify the incremental impact of policies aimed at sup-porting continuity of primary care, via changes in the cover score and associated impact on PPHs.
Administrative data are not collected for research pur-poses, hence, they do not include some details about se-verity of disease. Our data also did not have information about whether individuals visited the same or different GPs which may have improved the threshold modelling of our estimation of the maximum optimal time period. As the same provider is a potential factor for a holistic ap-proach to continuity of care, future work may wish to ex-pend on the current metric with inclusion of such data. The empirical results were limited to those who were clin-ically diagnosed with diabetes and incur health care re-source utilisation through hospitals or Medicare claims that may affect generalisation of the maximal optimal time period estimated. Although the covered time interval found in our study relates only to diabetes at particular se-verity levels, the cover metric has application to other am-bulatory care sensitive chronic conditions.
Conclusions
Our study adds to the current literature by developing and operationalizing a new approach to measuring con-tinuity of primary care which incorporates time-duration protective effects of primary care. This study used novel threshold modelling to determine the impact of maximum duration between GP services on preventable hospitalisa-tion and used the estimated value to operahospitalisa-tionalise cover. However, the operationalisation of cover is flexible and al-lows for use of a priori time intervals, which makes it ideal to evaluate clinical guidelines and policies that recom-mend specified durations between GP visits.
Abbreviations
AIC:Akaike Information Criterion; BIC: Bayes Information Criterion; COC: Continuity of care; DOC: Days out of Cover; ER: Western Australian Electoral Roll; GP: General Practitioner; HMDS: Hospital Morbidity Data System; MBS: Medicare Benefits Scheme; PHC: Primary health care;
PPH: Potentially Preventable Hospitalisation; WA: Western Australia; WADLS: Western Australian Data Linkage System
Acknowledgements
The authors wish to thank the staff at the Western Australian Data Linkage Branch and Commonwealth Department of Health and Aging for providing the linked data for this project.
Funding
This work was supported by the National Health and Medical Research Council, project grant APP1078345. The study funders had no role in the study design, conduct, manuscript writing or decision to submit for publication.
Availability of data and materials
The data that support the findings of this study are available from the relevant data custodians of the study datasets. Restrictions by the data custodians mean that the data are not publicly available or able to be provided by the authors. Researchers wishing to access the datasets used in this study should refer to the WA data linkage application process (https:// www.datalinkage-wa.org.au/access-and-application).
Authors’contributions
TNH, RM and MH conceived the idea and study design for the manuscript. TNH conducted data analyses and drafted the manuscript. RM and MH provided supervision and contributed in analysis, interpreting the results, drafting and revising the manuscript. DP and SR involved in drafting and revising critically for important intellectual content of the manuscript. All authors read and approved the final version of the manuscript for publication.
Ethics approval and consent to participate
Approval was provided by the University of Western Australia and Curtin University Human Research Ethics Committees (reference numbers RD-42-14 and RA/4/1/1239 respectively) which exempted the study from requiring pa-tient consent.
Consent for publication Not Applicable.
Competing interests
The authors declare that they have no competing interests.
Publisher’s Note
Springer Nature remains neutral with regard to jurisdictional claims in published maps and institutional affiliations.
Author details 1
Health systems and Health economics, School of Public Health, Curtin University, Perth, Western Australia 6845, Australia.2School of Economics and Finance, Curtin University, Perth, Western Australia 6845, Australia.3Centre for Health Services Research, School of Population and Global Health, The University of Western Australia, 35 Stirling Highway, Crawley, WA 6009, Australia.
Received: 5 September 2018 Accepted: 12 April 2019
References
1. AIHW. A set of performance indicators across the health and aged care system. In: Canberra: Australian institute of health and welfare; 2008. 2. American Diabetes Association. Standards of medical care for patients with
diabetes mellitus. Diabetes Care. 2003;26(Suppl 1):S33–50.
3. Australian Bureau of Statistics. Census of Population and Housing: Socio-Economic Indexes for Areas. Canberra: Australian Bureau of Statistics; 1981– 2006.
4. Australian Bureau of Statistics. Census of Population and Housing: Socio-Economic Indexes for Areas. Canberra: Australian Bureau of Statistics; 2011. 5. Authority, T. n. H. P. Healthy communities: potentially preventable
6. Barker I, Steventon A, Deeny SR. Association between continuity of care in general practice and hospital admissions for ambulatory care sensitive conditions: cross sectional study of routinely collected, person level data. BMJ. 2017;356:j84.
7. Bentler SE, Morgan RO, Virnig BA, Wolinsky FD. The Association of Longitudinal and Interpersonal Continuity of care with emergency department use, hospitalization, and mortality among Medicare beneficiaries. PLoS One. 2014;9(12):e115088.
8. Bywood P, Katterl R, Lunnay B. Disparities in primary health care utilisation: who are the disadvantaged groups? How are they disadvantaged? What interventions work? In: PHCRIS policy issue review. Adelaide: Primary Health Care Research & Information Service; 2011.
9. Caetano PA, Lam JM, Morgan SG. Toward a standard definition and measurement of persistence with drug therapy: examples from research on statin and antihypertensive utilization. Clin Ther. 2006;28(9):1411–24 discussion 10. 10. Caminal J, Starfield B, Sanchez E, Casanova C, Morales M. The role of
primary care in preventing ambulatory care sensitive conditions. Eur J Pub Health. 2004;14(3):246–51.
11. Chamberlain G. Multivariate regression models for panel data. J Econ. 1982; 18(1):5–46.
12. Cho KH, Lee SG, Jun B, Jung B-Y, Kim J-H, Park E-C. Effects of continuity of care on hospital admission in patients with type 2 diabetes: analysis of nationwide insurance data. BMC Health Serv Res. 2015;15:107.
13. Comino EJ, Islam MDF, Tran DT, Jorm L, Flack J, Jalaludin B, Haas M, Harris MF. Association of processes of primary care and hospitalisation for people with diabetes: a record linkage study. Diabetes Res Clin Pract. 2015;108(2): 296–305.
14. Davis WA, Knuiman MW, Hendrie D, Davis TM. Determinants of diabetes-attributable non-blood glucose-lowering medication costs in type 2 diabetes: the Fremantle diabetes study. Diabetes Care. 2005;28(2):329–36. 15. Department of Health and Ageing. Building a 21st century primary health
care system: Australia's first National Primary Health Care strategy. Commonwealth of Australia: Department of Health and Ageing; 2010a. 16. Department of Health and Ageing. 2010b.“National Hospital Cost Data
Collection: Cost report Round 13 (2008–2009)”. Available at:https:// catalogue.nla.gov.au/Record/5739562. Accessed 15 Feb 2010. 17. Donabedian A. Evaluating the quality of medical care. 1966. Milbank Q.
2005;83(4):691–729.
18. Dreiher J, Comaneshter DS, Rosenbluth Y, Battat E, Bitterman H, Cohen AD. The association between continuity of care in the community and health outcomes: a population-based study. Isr J Health Policy Res. 2012;1(1):21. 19. Einarsdóttir K, Preen DB, Emery JD, Holman CDAJ. Regular primary care
plays a significant role in secondary prevention of ischemic heart disease in a Western Australian cohort. J Gen Intern Med. 2011;26(10):1092–7. 20. Einarsdóttir K, Preen DB, Emery JD, Kelman C, Holman CDAJ. Regular
primary care lowers hospitalisation risk and mortality in seniors with chronic respiratory diseases. J Gen Intern Med. 2010;25(8):766–73.
21. Falster MO, Jorm LR, Leyland AH. Visualising linked health data to explore health events around preventable hospitalisations in NSW Australia. BMJ Open. 2016;6(9):e012031.
22. Frühwirth-Schnatter S. Finite Mixture and Markov Switching Models: Springer Series in Statistics; 2006.
23. Gannon B, Harris D, Harris M. Threshold effects in nonlinear models with an application to the social capital-retirement-health relationship. Health Econ. 2014;23(9):1072–83.
24. Gannon B, Harris D, Harris M, Magnusson L, hollingsworth B, Lnder B, Munford L. New approaches to estimating the child health-patental income relationship”Economics Discussion; 2015. p. 15–31.
25. Gibson D, Moorin R, Preen D, Emery J, Holman CD. Effects of the Medicare enhanced primary care program on primary care physician contact in the population of older Western Australians with chronic diseases. Aust Health Rev. 2011;35:334–40.
26. Gibson D, Moorin R, Preen D, Emery J, Holman CD. Enhanced primary care improves GP service regularity in older patients without impacting on service frequency. Aust J Prim Health. 2012;18(4):295–303.
27. Gonzalo J, Pitarakis J-Y. Estimation and model selection based inference in single and multiple threshold models. J Econ. 2002;110(2):319–52. 28. Gulliford M, Naithani S, Morgan M. What is‘continuity of care’? J Health Serv
Res Policy. 2006;11(4):248–50.
29. Guthrie B, Saultz JW, Freeman GK, Haggerty JL. Continuity of care matters. BMJ. 2008;337:a867.
30. Ha NT, Harris M, Preen D, Robinson S, Moorin R. Identifying patterns of general practitioner service utilisation and their relationship with potentially preventable hospitalisations in people with diabetes: the utility of a cluster analysis approach. Diabetes Res Clin Pract. 2018;138: 201–10.
31. Ha NT, Harris M, Robinson S, Preen D, Moorin R. Stratification strategy for evaluating the influence of diabetes complication severity index on the risk of hospitalization: a record linkage data in Western Australia. J Diabetes Complicat. 2017;31(7):1175–80.
32. Haggerty JL, Reid RJ, Freeman GK, Starfield B, Adair CE, McKendry R. Continuity of care: a multidisciplinary review. BMJ. 2003;327(7425):1219. 33. Holman CD, Bass AJ, Rouse IL, Hobbs MS. Population-based linkage of
health records in Western Australia: development of a health services research linked database. Aust N Z J Public Health. 1999;23(5):453–9. 34. Holman CD, Preen DB, Baynham NJ, Finn JC, Semmens JB. A multipurpose
comorbidity scoring system performed better than the Charlson index. J Clin Epidemiol. 2005;58(10):1006–14.
35. Hong-kit Yim F, Anderson RE, Swaminathan S. Customer relationship management: its dimensions and effect on customer outcomes. J Pers Sell Sales Manag. 2004;24(4):263–78.
36. Jackson C, Ball L. Continuity of care is vital but how do we measure it. J Health Serv Res Policy. 2018;47:662–4.
37. Jackson C, Shahsahebi M, Wedlake T, DuBard CA. Timeliness of outpatient follow-up: an evidence-based approach for planning after hospital discharge. Ann Fam Med. 2015;13(2):115–22.
38. Jee SH, Cabana MD. Indices for continuity of care: a systematic review of the literature. Med Care Res Rev. 2006;63(2):158–88.
39. Kecmanovic M, Hall PJ. The use of financial incentives in Australian general practice. Med J Aust. 2015;202(9):488–91.
40. Lee EW. Data mining application in customer relationship Management for Hospital Inpatients. Healthc Inform Res. 2012;18(3):178–85.
41. Ling R, Yen DC. Customer relationship management: an analysis framework and implementation strategies. J Comput Inf Syst. 2001;41(3):82–97. 42. Menec VH, Sirski M, Attawar D, Katz A. Does continuity of care with a family
physician reduce hospitalizations among older adults? J Health Serv Res Policy. 2006;11(4):196–201.
43. Moorin R. Symposium: measuring the influence of regularity of GP contact on diabetic potentially preventable hospitalisations.”Health services & policy research conference. Melbourne: Health Services Research Association of Australia & New Zealand; 2015.
44. Mundlak Y. On the pooling of time series and cross section data. Econometrica. 1978;46(1):69–85.
45. Pereira Gray DJ, Sidaway-Lee K, White E, Thorne A, Evans PH. Continuity of care with doctors—a matter of life and death? A systematic review of continuity of care and mortality. BMJ Open. 2018;8(6):e021161.
46. Reinartz WJ, Kumar V. The impact of customer relationship characteristics on profitable lifetime duration. J Mark. 2003;67(1):77–99.
47. Sanderson C, Dixon J. Conditions for which onset or hospital admission is potentially preventable by timely and effective ambulatory care. J Health Serv Res Policy. 2000;5(4):222–30.
48. Santoleri F, Sorice P, Lasala R, Rizzo RC, Costantini A. Patient adherence and persistence with Imatinib, Nilotinib, Dasatinib in clinical practice. PLoS One. 2013;8(2):e56813.
49. Saultz JW, Albedaiwi W. Interpersonal continuity of care and patient satisfaction: a critical review. Ann Fam Med. 2004;2(5):445–51.
50. The Department of Health. 2014.“Chronic disease management (formerly enhanced primary care or EPC)—GP services”. Available at:http://www. health.gov.au/internet/main/publishing.nsf/content/mbsprimarycare-chronicdiseasemanagement. Accessed on 2014.
51. The Royal Australian College of General Practitioners. General practice management of type 2 diabetes 2014–2015. Melbourne: The Royal Australian College of General Practitioners; 2014.
52. van Loenen T, van den Berg MJ, Westert GP, Faber MJ. Organizational aspects of primary care related to avoidable hospitalization: a systematic review. Fam Pract. 2014;31(5):502–16.
53. Vuik SI, Fontana G, Mayer E, Darzi A. Do hospitalisations for ambulatory care sensitive conditions reflect low access to primary care? An observational cohort study of primary care usage prior to hospitalisation. BMJ Open. 2017;7(8):e015704. 54. Wooldridge JM. Simple solutions to the initial conditions problem in
55. Youens D, Moorin R. The impact of regular general practitioner visits on diabetic hospitalisation costs. In: International health economics association world congress. Boston: International Health Economics Association; 2017a. 56. Youens D, Moorin R. Regularity of General Practitioner contact–analysis of
methods for measurement using administrative data.”Health Services Research & Policy Conference. Brisbane: Health Services Research Association of Australia & New Zealand; 2017b.
57. Young BA, Lin E, Von Korff M, Simon G, Ciechanowski P, Ludman EJ, Everson-Stewart S, Kinder L, Oliver M, Boyko EJ, Katon WJ. Diabetes complications severity index and risk of mortality, hospitalization, and healthcare utilization. Am J Manag Care. 2008;14(1):15–23.