AEDES AEGYPTI DENSITY AND RISK OF DENGUE VIRUS SEROCONVERSION
Elizabeth A. Cromwell
A dissertation submitted to the faculty of the University of North Carolina at Chapel Hill in partial fulfillment of the requirements of the degree of Doctor of Philosophy in the Department
of Epidemiology in the Gillings School of Global Public Health.
Chapel Hill 2016
Approved by:
Steven Meshnick
Annelies Van Rie
© 2016
ABSTRACT
Elizabeth A. Cromwell: Aedes aegypti Density and Risk of Dengue Virus Seroconversion (Under the direction of Steven Meshnick)
Routine entomological monitoring data are used as a surrogate for overall risk of dengue
virus (DENV) infection and to trigger implementation of control interventions. Indicators that
characterize Aedes aegypti abundance have not consistently been associated with an increased risk of dengue virus (DENV) seroconversion. Using longitudinal entomological and serological
data from Iquitos, Peru, this dissertation estimated the risk of DENV infection for several
entomological indicators to determine if any measure of Ae. aegypti abundance was associated with transmission.
Entomological survey data from two longitudinal cohort studies linked with 8,153 paired
serological observations were analyzed. Indicators of Ae. aegypti density were calculated from entomological. The risk ratios (RR) estimating the association between Ae. aegypti abundance at the household and block levels and the six-month risk of DENV seroconversion were obtained.
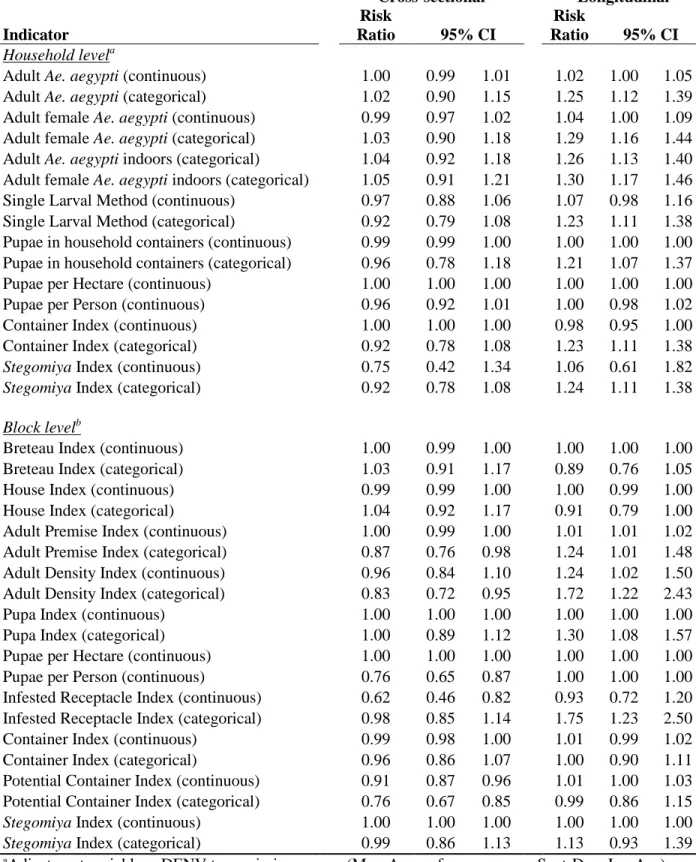
Cross-sectional Ae. aegypti densities were not associated with an increased risk of DENV seroconversion. Longitudinal measures of adult stage density resulted in adjusted RRs ranging
from 1.01 (95% CI: 1.01, 1.02) to 1.30 (95% CI: 1.17, 1.46) and categorical immature indices
risk of DENV infection among densities ranging from 0.005 to 0.01 mosquitoes per m2 (adjusted risk ratio: 1.14; 95% CI: 1.01, 1.28). A multi-level logistic model was used to test for
heterogeneity of the association between DENV risk and longitudinal measures of Ae. aegypti
density. The multi-level model results suggest that the population-level risk ratios are more
appropriate estimates of the Ae. aegypti-DENV seroconversion association.
Ae. aegypti densities calculated from repeat entomological monitoring were associated with DENV seroconversion, whereas estimates of Ae. aegypti abundance measured cross-sectionally were not. It is possible that Ae. aegypti populations exhibit too much variability across space and time for periodic, cross-sectional measurement to adequately characterize
entomological risk, in addition to having no correlation with true infection events due to human
ACKNOWLEDGEMENTS
There are many people I would like to thank for their invaluable help towards completing
this dissertation. First, and foremost, I would like to thank my dissertation chair, Steve
Meshnick, for being so generous with his time and mentorship. I would also like to thank
Annelies Van Rie, who first served as my academic advisor and dissertation chair. Her insights
into developing the specific aims and proposal were invaluable.
I thank the rest of my dissertation committee: Allison Aiello; Marc Serre and Bill Messer
(who first sparked my interest in dengue). I am also grateful to investigators at the University of
California Davis who welcomed me into the world of dengue, and shared generously of their
expertise: Tom Scott, Amy Morrison, Steve Stoddard and Chris Barker. Thanks to my
classmates in the UNC Department of Epidemiology, especially Katie Lesko, Chris Gray,
Melissa Arvay, Nalyn Siripong, Marissa Seamans, Jabulani Ncayiyana, Jaymin Patel, and Dana
Pasquale. I have learned so much from all of them, in and out of the classroom, and I look
forward to long-lived personal and professional relationships.
My wonderful husband, Frank Kreikebaum, has been a source of support and
encouragement ever since we met. Thank you to our parents, for their support and love through
this program, and for the weeks of childcare (without which none of this would have been
completed). Funding is an incredible luxury and completing this program would have been so
much more difficult without it. I am immensely grateful for the NIH Infectious Disease training
TABLE OF CONTENTS
LIST OF TABLES ... x
LIST OF FIGURES ... xi
LIST OF ABBREVIATIONS ... xii
CHAPTER 1: SPECIFIC AIMS ... 1
1.1 Introduction ... 1
1.2 Specific Aims ... 3
CHAPTER 2: DENGUE VIRUS BACKGROUND ... 4
2.1 Introduction ... 4
2.2 Transmission of DENV... 4
2.3 Known Risk Factors for DENV Transmission ... 6
2.4 Interventions to Prevent DENV Transmission ... 7
CHAPTER 3: AEDES AEGYPTI MONITORING INDICATORS ... 10
3.1 Indicators Used to Measure Exposure to Aedes aegypti ... 10
3.2 Life Stage Measured ... 10
3.3 Household v. Group-Level Indicators... 12
3.4 Quantification of Density ... 12
3.5 Limitations of Entomological Monitoring Data ... 14
4.4 Limitations of Prior Studies ... 33
4.5Entomological Data as a Proxy for True DENV Exposure ... 35
4.6 Insights Gained from Prior Studies ... 36
4.7Contribution of Proposed Research ... 37
CHAPTER 5: AIM 2 LITERATURE REVIEW ... 39
5.1Introduction ... 39
5.2Spatial and Temporal Heterogeneity of Aedes aegypti Densities ... 39
5.3Prior studies exploring the role of space ... 41
5.4Contribution of the Proposed Research ... 43
CHAPTER 6: DESCRIPTION OF THE DATA SOURCE ... 45
6.1Background: Dengue Cohort Studies, Iquitos, Peru ... 45
6.2 Study Design: Iquitos Cohorts ... 47
6.3Entomological Surveys ... 49
6.4Assessment of DENV Seroconversion ... 49
6.5Household-level Data... 51
6.6 Ethical Considerations ... 51
CHAPTER 7: AEDES AEGYPTI ABUNDANCE AND DENGUE INFECTION ... 52
7.1 Introduction ... 52
7.2 Methods... 54
7.3Results ... 61
7.4 Discussion ... 68
CHAPTER 8: BAYESIAN MAXIMUM ENTROPY: ADULT AEDES AEGYPTI DENSITY AND DENGUE VIRUS SEROCONVERSION ... 73
8.1Introduction ... 73
8.4 Discussion ... 96
CHAPTER 9: HETEROGENEITY IN THE ASSOCIATION BETWEEN VECTOR DENSITY AND DENV RISK: A MULTI-LEVEL ANALYSIS ... 101
9.1 Introduction ... 101
9.2 Methods... 102
9.3 Results ... 103
9.4 Discussion ... 111
CHAPTER 10: DISCUSSION ... 113
10.1 Summary of Findings ... 113
10.2 Contribution of Findings ... 115
10.3 Future Research Directions ... 116
APPENDIX A: SUPPLEMENTAL MATERIALS TO CHAPTER 7 ... 119
APPENDIX B: SUPPLEMENTAL MATERIALS TO CHAPTER 8 ... 135
LIST OF TABLES
Table 1. Indices Used to Measure Aedes aegypti Density ... 16
Table 2. Studies that measure an association between Ae. aegypti density and apparent dengue ... 22
Table 3. Studies that measure an association between Ae. aegypti density and inapparent dengue ... 31
Table 4. Summary of household-level indicators of Aedes aegypti tested for an association with seroconversion to DENV ... 59
Table 5. Summary of block-level indicators of Aedes aegypti tested for an association with seroconversion to DENV ... 60
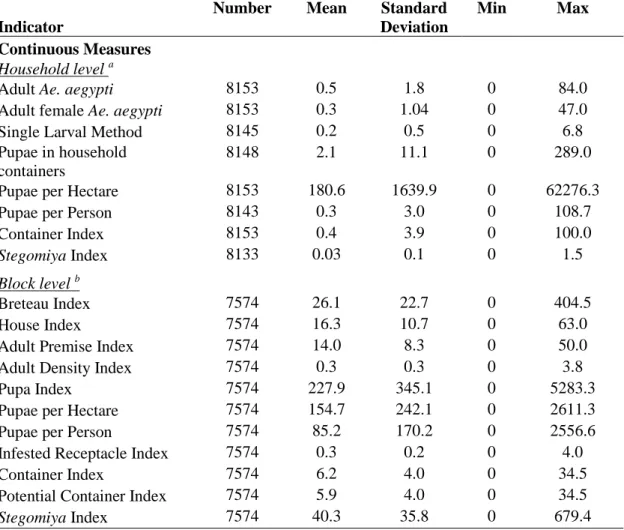
Table 6. Distribution of continuous entomological monitoring indicators for serological observations: cross-sectional densities ... 64
Table 7. Distribution of continuous entomological monitoring indicators for serological observations: longitudinal densities ... 65
Table 8. Distribution of categorical indicators for serological observations ... 66
Table 9. Adjusted risk ratios: association between Ae. aegypti and DENV seroconversion ... 67
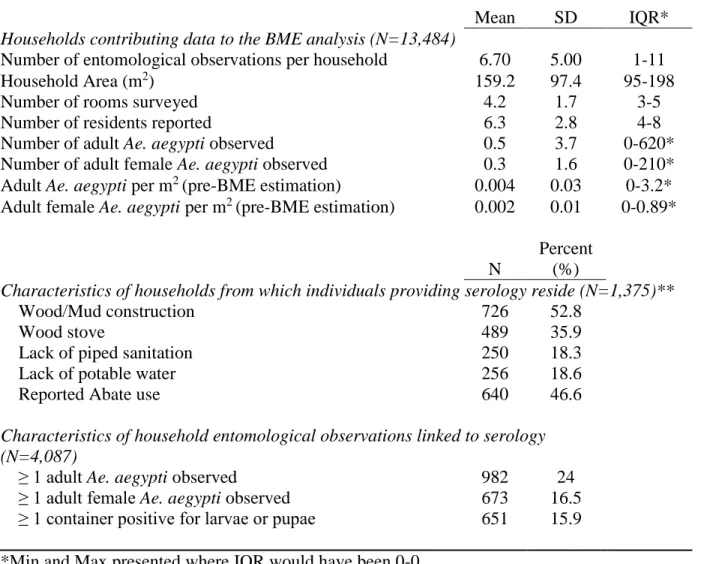
Table 10. Characteristics of the study participants and household ... 85
Table 11. Association between household Ae. aegypti density and 6-month risk of DENV seroconversion: pre-BME Estimation ... 91
Table 12. BME-Estimated Density Uniform Prior ... 92
Table 13. BME-estimated Density Triangular Prior ... 93
Table 14. Block-level Multilevel Model Results ... 105
LIST OF FIGURES
Figure 1. Relationship between observed Ae. aegypti abundance and dengue
outcomes if true association exists ... 19
Figure 2. Possible selection bias mechanism in reported apparent dengue disease as a study outcome ... 20
Figure 3. Bias due to measurement error among studies with DENV seroconversion as a primary outcome ... 35
Figure 4. Map of Peru ... 45
Figure 5. Map of ECDC study zones ... 46
Figure 6. Map of Activity Space study zones ... 48
Figure 7. Study data across space ... 86
Figure 8. Spatial and temporal covariance of Adult Ae. aegypti per household area ... 88
Figure 9. Histogram of Ln (Adult Mosquito Density) Pre and Post BME Estimation ... 88
Figure 10. Mosquito density and risk of DENV seroconversion ... 94
Figure 11. Mosquito Density and Risk of DENV Seroconversion ... 95
Figure 12. Correlation between random intercept and random slope ... 107
Figure 13. Caterpillar plot of random slope estimates ... 108
LIST OF ABBREVIATIONS
AS Activity Space
AIC Akaike Information Criteria
BI Breteau Index
BHK21 Baby Hamster Kidney Cell
BME Bayesian Maximum Entropy
CI Container Index; Confidence Interval
CDC Centers for Disease Control and Prevention
DENV Dengue virus
DENV1 Dengue virus (Serotype 1)
DENV2 Dengue virus (Serotype 2)
DENV3 Dengue virus (Serotype 3)
DENV4 Dengue virus (Serotype 4)
DHF Dengue Hemorrhagic Fever
DSS Dengue Shock Syndrome
ECDC Entomological Correlates of Dengue Control
G-KB General Knowledge Base
GEE Generalized Estimating Equation
GWR Geographically Weighted Regression
HI House Index
IQR Inter-Quartile Range
LRT Likelihood Ratio Test
NAMRU-6 Naval Medical Research Unit
PRNT Plaque Reduction Neutralization Test
RR Risk ratio
S-KB Site-specific knowledge base
SES Socio-economic status
SD Standard Deviation
S/TRF Space/time random field
UCD University of California, Davis
WHO World Health Organization
CHAPTER 1: SPECIFIC AIMS
1.1 Introduction
Dengue virus (DENV), an RNA virus transmitted by the bite of Aedes aegypti
mosquitoes, causes more human morbidity and mortality than any other arthropod-borne virus
worldwide. Since the 1950s, dengue has spread via the globalization of trade and travel, rapid
urbanization and the expansion of vector habitats.1 At least 128 countries are now considered to have endemic transmission, with the highest burden of dengue in the Americas and South-east
Asia. The four serotypes (DENV1, DENV2, DENV3 and DENV4) occur throughout the tropics
and infect approximately 390 million persons per year.2 The most severe manifestation of dengue infection is dengue hemorrhagic fever, which can lead to dengue shock syndrome and
can be fatal.
Ae. aegypti are daytime-biting, domesticated mosquitoes highly adapted to the human urban environment. This human-vector relationship is mediated by social and economic factors
that govern human movement through time and space, as well as environmental factors that
influence fluctuations in Ae. aegypti populations.3, 4 In tropical and subtropical urban areas, the expansion of human habitats via urbanization has generally out-paced improvements in water,
sanitation and housing infrastructure necessary to eliminate mosquito breeding sites and
opportunities for human contact with Ae. aegypti.5 High concentrations of Ae. aegypti within or
Monitoring vector abundance is recommended by the World Health Organization (WHO) for the
deployment and evaluation of vector control interventions.5 The public health utility of these
indicators relies on the assumption that greater mosquito abundance increases the risk of DENV
transmission, and therefore reducing exposure to the vector reduces infection incidence. Further,
by identifying “hot spots” of Ae. aegypti infestation, targeted vector control would be an efficient use of limited intervention resources.6 There is no established threshold of Ae. aegypti density associated with an increased risk of human DENV infection7 and prior studies have shown no
consistent association between various indices and dengue outcomes.8
To help predict risk and direct public health interventions, there is substantial interest in
an improved understanding of the relationship between measures of mosquito density and DENV
infection, according to mosquito life stage and unit of measurement. The objective of this
dissertation was to use longitudinal data on mosquito density and human serology to test for
quantifiable associations between Ae. aegypti indices and an estimated 6-month risk of DENV seroconversion. The analysis is an ancillary study of extant longitudinal data collected from
1999-2003 and 2008-2010 in Iquitos, Peru.9 These longitudinal data offer a unique opportunity to improve understanding of the relationship between vector abundance and household-level
characteristics in an endemic urban DENV transmission setting. While previous work has
described the challenges inherent in monitoring mosquito populations and operational limitations
of these indicators10,11 as well as measuring the association with symptomatic dengue,8 this analysis systematically compares measures of entomological risk with data on human DENV
1.2 Specific Aims
1.2.1 Compare Measures of Exposure to Ae. aegypti Constructed with Data from Routine Entomological Monitoring to Identify if any are Associated with the 6-month Risk of DENV Seroconversion
There are multiple indicators used to characterize exposure to Ae. aegypti and it is unknown which (if any) best correlate with DENV seroconversion. From a dengue control
perspective, there is substantial interest in understanding how measures of mosquito density are
associated with DENV infection, according to mosquito life stage and unit of measurement. In
this Aim, entomological surveillance data will be used to estimate the association between
indicators of Ae. aegypti abundance at the household-level and block-level and the risk of DENV seroconversion. A priori, adult mosquito indicators will be tested as DENV transmission occurs during the adult life stage; larval and pupae measures will be compared to determine which
indicator has the strongest measure of association.
1.2.2 Estimate the association between Ae. aegypti densities and the 6-month risk of DENV seroconversion to determine if (1) their utility can be improved via spatial modeling and (2) if heterogeneities in the association exist within the community
In urban settings such as Iquitos, Peru, socio-economic status, housing quality and
household-level exposure to Ae. aegypti are highly variable at fine spatial scales and may influence transmission at the household and beyond. In this aim, the association between adult
Ae. aegypti per household area (m2) and DENV seroconversion will be estimated using a space/time analysis to account for possible measurement error resulting from data collection. A
multilevel approach will then be used to determine if heterogeneities in the association between
mosquito density and DENV seroconversion exist among different levels of space (block and
CHAPTER 2: DENGUE VIRUS BACKGROUND
2.1 Introduction
Dengue is a viral disease with established endemic and epidemic transmission throughout
Asia, Central and South America, and Africa.2 Dengue disease is characterized by symptoms ranging from a self-limiting fever, often accompanied by headache, arthralgia, myalgia and rash
(dengue fever) to potentially life-threatening dengue hemorrhagic fever and dengue shock
syndrome.1, 12 The majority of individuals infected with DENV experience mild to no symptoms, commonly called “inapparent” dengue. The precise mechanism by which some
individuals present with severe dengue disease is unknown. Treatment of dengue disease
involves supportive care; there is no cure for dengue nor is there a widely-available vaccine.13 A recent review of country case reports and prevalence data suggest that a total of 390
million dengue infections occur annually, of which 50-100 million exhibit any form of apparent
disease, and approximately 10,000 deaths each year result from dengue disease.2,14 The
geographic scope of dengue has expanded since the postwar period,15 due to the globalization of trade and travel16, 17, urbanization18, 19 and the expansion of vector habitats.20 At least 128 countries are now considered to have endemic transmission; approximately 14% of global
homes, such as automobile tires, rainwater collection buckets, trash, and storage containers.21 The Ae. aegypti mosquito experiences aquatic and terrestrial life stages. Eggs are laid on the interior of containers (manmade or natural) and larvae emerge after the eggs are inundated with
water. Larvae feed on organic matter and grow from first to fourth instars over a period of 7-9
days (at 25°C). Once the larvae are large enough (fourth instar), they metamorphose into pupae
(2-3 days). Upon adulthood, the mosquitoes emerge from the water and mate, repeating the
cycle, with female mosquitoes surviving 8-15 days and males 3-6 days.22
Ae. aegypti are daytime-biting mosquitoes and typically do not travel beyond 100 meters in urban settings.23, 24 An infected female Ae. aegypti mosquito can feed on several persons during its gonotrophic cycle (adult stage), resulting in transmission of DENV among members of
a household at approximately the same time. Female mosquitoes feed during daylight hours,
typically 2-3 hours after dawn and in the afternoon for several hours.25 Climatic factors,
primarily temperature and precipitation, affect mosquito feeding and breeding patterns, and can
shorten or lengthen the overall lifecycle.
In the mosquito, the DENV undergoes an extrinsic incubation period of 7-14 days,
dependent on temperature.7, 26 In humans, the virus incubates 3-15 days before symptoms of dengue disease are experienced. Once symptomatic, the acute phase begins and a viremic
individual can infect susceptible mosquitoes, as DENV will circulate in human blood for an
average of five days; individuals experiencing inapparent dengue are also infectious.27, 28 Once the virus is re-introduced into the vector population, it will incubate again and the cycle repeats.
Human dengue transmission generally occurs in the urban setting where there are no
other DENV hosts3, and Ae. aegypti feed preferentially on human blood.29 Using data from
simulation studies, it has been estimated that a minimum population of 10,000 persons is
required to maintain endemic human-to-mosquitoDENV transmission; another model estimates
a population of at least 150,000 persons is required to sustain transmission.30, 31 The Aedes albopictus mosquito is also capable of transmitting DENV and has expanded its geographic range in the past decade. However, differences in human feeding behaviors suggest that Ae. albopictus may be a less competent vector of DENV than Ae. aegypti, and is not currently considered a threat for large-scale dengue outbreaks.32 DENV transmission has also been documented among mosquitoes and primates in forested regions of rural Africa and Asia,33 but this cycle rarely includes human populations; therefore, it is not of great importance in the
establishment of endemic transmission.
The human-vector relationship is mediated by social and economic factors that govern
human movement through time and space, as well as environmental factors that influence
fluctuations in Ae. aegypti populations. In tropical and subtropical urban areas, the expansion of human habitats via urbanization has generally out-paced improvements in water, sanitation and
housing infrastructure necessary to eliminate mosquito breeding sites and opportunities for
human contact with Ae. aegypti.
2.3 Known Risk Factors for DENV Transmission
The primary risk factor for DENV infection is contact with the mosquito vector. Without
as open containers, and lack of vector control strategies such as personal insecticides and
household or neighborhood spraying. Several studies have found an association with lower
socio-economic status (SES)34-36 and DENV infection, but SES is likely a proxy for poorer housing quality and reduced access to environmental sanitation in the urban environment.37, 38 A study comparing the prevalence of dengue in Neuvo Laredo, Mexico, and Laredo, Texas, found a
higher seroprevalence of DENV infection in Neuvo Laredo even though Ae. aegypti were more abundant in Laredo, suggesting better economic conditions (vis-à-vis improved housing quality,
use of air conditioning, etc.) reduced DENV transmission.39 Spatial analysis of DENV infection in Brazil has also demonstrated an association between low SES and infection.36
2.4 Interventions to Prevent DENV Transmission
All current public health efforts to prevent dengue outbreaks are aimed at vector control
to reduce human contact with the mosquito and improve surveillance as the dengue vaccine is
not widely available.5 Interventions designed to reduce human-mosquito contact range from long-term infrastructure improvement at the community-level to household and individual
behavior change. The WHO has adopted a target of reducing dengue incidence by 50% by 2020
through a suite of interventions.40 Among these interventions, the improvement of public infrastructure requires large-scale municipal investment, such as improving public water system
delivery and urban sanitation. Household level interventions include elimination of mosquito
breeding sites through cleaning of water storage containers, gutters, and other sites where
mosquitoes breed such as flower vases and removal of household trash.5 The promotion of breeding site elimination includes removal or closure of containers that collect standing water.
Insecticide-based interventions include indoor residual spraying to reduce interior Aedes
populations and neighborhood-wide fumigation. The WHO recommends incorporating a
monitoring framework to detect insecticide resistance in tandem with these interventions to
ensure efficacy. Other novel approaches are under investigation, such as spatial repellents and
lethal ovitraps.40 Biological controls have also been promoted, including the introduction of fish or copepods to water containers (to digest Aedes larvae), the use of genetically modified
mosquitoes to out-compete the native Aedes population and the introduction of the Wolbachia-infected Aedes to prevent infection of the vector with DENV.41
Some authors suggest that vector control interventions have not adequately reduced the
spread of DENV transmission due to poor management of implementation, limited financial
investment, poor geographic coverage, late deployment and lack of community involvement.42 In some settings, community-led dengue control interventions have shown positive results.43-46
Integration of dengue surveillance and interventions has also been shown effective.47 The timing of vector control implementation may also play a role in their efficacy, with some researchers suggesting a “proactive” approach to break transmission before an epidemic occurs, rather than
intervening after febrile cases have been detected.48 Vector control interventions have been demonstrated to reduce the population of Ae. aegypti.49 The impact of vector control is based on the hypothesis that reducing human contact with Ae. aegypti will reduce the likelihood of exposure to the virus, and therefore prevent transmission. Evidence of long-term efficacy of
vector control interventions is varied. It is plausible that if vector control (in its various forms) is
Targeting vector control interventions to households with high Ae. aegypti abundance would be beneficial given limited public health resources, or where large-scale interventions
such as mass spraying of insecticides may have limited long-term efficacy due to the
development of insecticide resistance.6 Household level interventions may appeal to individuals in settings where public services may be limited or unreliable. However, as Ae. aegypti is a day-time biting mosquito, the relationship between exposure ascertainment at the household level via
routine entomological monitoring, primarily of domestic premises, and risk of dengue infection
is not clear-cut. Human movement and environmental factors may modify the relationship
CHAPTER 3: AEDES AEGYPTI MONITORING INDICATORS
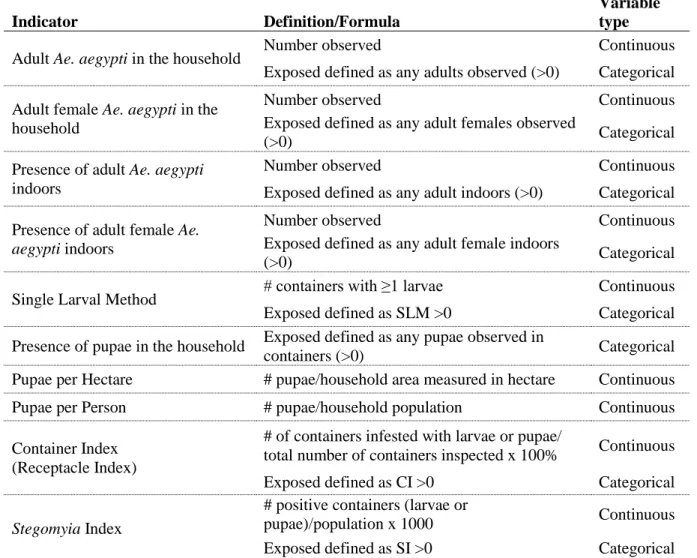
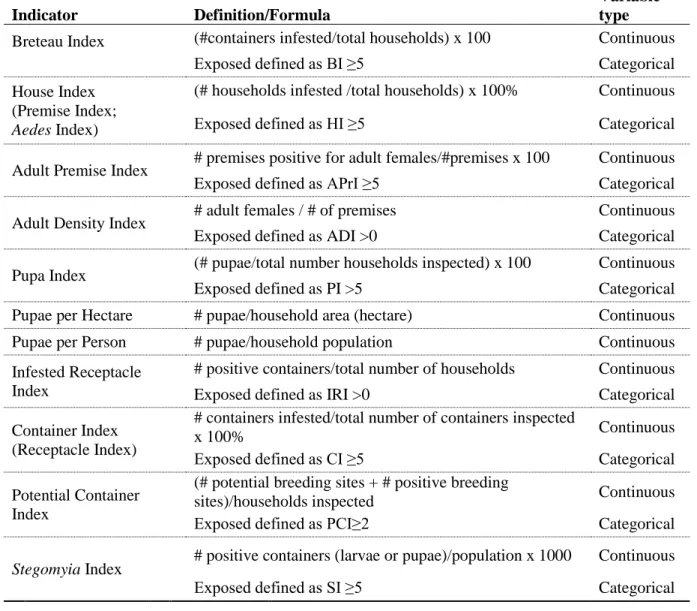
3.1 Indicators Used to Measure Exposure to Aedes aegypti
Use of Ae. aegypti monitoring indicators grew out of yellow fever control programs in the first half of the 20th century.50 Since then, over twenty indicators have been proposed to quantify abundance of Ae. aegypti. Entomological data are typically collected from households over spatial units such as the neighborhood or block on a regular or ad hoc basis. Monitoring
data vary by mosquito life stage (adults, larvae and/or pupae) and process of collection (ovitrap
v. aspirator, identification of breeding sites, etc.).51 Since it would be prohibitively expensive and logistically impossible to track individual human-mosquito contact over a large population, over
the entire period of a dengue outbreak, entomological surveys are currently the only method
available to generate data with which to quantify possible exposure to Ae. aegypti. Table 1 presents monitoring indicators that have appeared in the literature. These indicators vary by three primary characteristics: the life stage of mosquito measured (larval, pupal, adult); the level
of measurement (household or community); and quantification of exposure (rates, proportions or
scales).
3.2 Life Stage Measured
identify larvae and pupae by examining natural and man-made containers for their presence.51 Among the indices used to measure the population of immature Ae. aegypti, the Breteau Index (BI), House Index (HI) and Container Index (CI) are among the most widely used.
Quantification of the adult female Ae. aegypti population is likely the most important in terms of measuring risk of DENV infection as adult females are responsible for transmission.
Adult mosquitoes are capable of flight (albeit short distances); therefore, adult mosquitoes must
be identified and counted within household interior and exterior spaces. Counting the number of
adult mosquitoes requires equipment such as aspirators or ovitraps to capture adults and trained
data collection personnel to ensure consistency of field measurements. The measurement of adult
Aedes populations is also difficult to achieve under operational conditions and over a large geographic sample due to variability in mosquito behavior. Adult mosquitoes can move between
households, hide in ceilings and interior spaces, so measurement on any given day reflects a
spectrum of exposure, possibly from ranging from the true population of mosquitoes to one
downwardly or upwardly biased due to factors such as time of day, season and adult mosquito
behavior.10 The potential for measurement error is therefore real.52 Since adult mosquito
measurement is difficult, most dengue surveillance and research rely on indices of larvae and/or
pupae quantities as a proxy for adult measures.6
Pupal indicators have been proposed as proxy measures of future adult populations as
pupal mortality is low compared to larval mortality and pupae are easier to count as well as
identify from other species.53, 54 However, pupal, larval and adult indices may not always
correlate. A study in Trinidad observed a statistically significant negative correlation between the
3.3 Household v. Group-Level Indicators
The level of measurement varies across these indicators as well, primarily at the
household or block level. Most entomological surveys are conducted at residential locations.
These data are then aggregated to describe block or neighborhood abundance in an attempt to
account for entomological risk that might be shared across units of space. Non-residential sites
have been proposed as a method to better describe neighborhood vector density but such sites are
less commonly surveyed.56 Aggregated measures of vector abundance are often used to compare
one neighborhood to another to determine if differences in entomological patterns (and therefore
DENV transmission) exist.
3.4 Quantification of Density
Exposure to Ae. aegypti is quantified as either a rate, a proportion or a scale. Mosquito densities are predominantly expressed in rates, either per geographic or population units. Note
that some of these rate measures could be converted to a proportion; here they are listed as they
have been described in the literature. Pupae per Hectare uses raw count data in the numerator to
compare the magnitude of exposure at a specific spatial unit. Rates that employ population data
in the denominator include the Pupa Index and Larval Density Index (households in the
denominator); Pupae per Person; Stegomiya Larval Density Index; Larval Density Index; Pupae per hectare; Pupae per Person; and Pupa Index and the Single Larval Method. Mean Egg
Density and Mean Adult Density calculate the rate of mosquito presence per trap. An important
Therefore, an indicator such as the BI may capture the spatial distribution of Ae. aegypti as it accounts for the presence of the vector across multiple households, but it may fail to capture the
risk of dengue transmission because it does not account for container productivity.55 The following indicators measure the proportion of exposure: the HI; the CI; and the
Block Index. These three measures also use a binary classification of mosquito exposure in the numerator (“positive” or “infested”). Finally, two of the indicators used to characterize Ae. aegypti can be classified as “scales”: the Density Index and the Adult Productivity Index. The
Density Index classifies exposure discretely, on a scale of one to nine. The Adult Productivity
Index places a value on the container type multiplied by the mean number of larvae observed,
which is then summed across all container types found at the household (or premise). These
indicators attempt to characterize the magnitude of mosquito infection by incorporating multiple
measures of density.
Regardless of whether indicators are presented as a rate or a proportion, if a classification of “infestated” is used in the numerator, the indicator may not account for the productivity of
single containers or the magnitude of infestation in a given household. For example, a container
with one Ae. aegypti larva is given the same weight as a container with several. If the
contribution of highly productive breeding sites is more important than the absolute number of
positive containers, indicators that capture the variability of exposure may be more appropriate.
For example, an indicator such as the Potential Container Index may more accurately represent
risk compared to the BI or the CI. Although they are more difficult to estimate, indicators that
do not rely on a classification of the numerator may better capture the productivity of different
breeding sites and their contribution to risk of dengue transmission. Nevertheless, as a single
3.5 Limitations of Entomological Monitoring Data
Measuring Ae. aegypti densities requires large scale entomological data collection that is subject to a variety of limitations. Entomological survey techniques may not capture the fine
spatial and temporal variability in an urban setting due to the dynamics of mosquito biology.
Indices are effectively prevalence measures, calculated from cross-sectional vector surveillance,
not derived from continuous monitoring. Entomological survey data do not capture the daily
productivity of individual containers or the activity of individual mosquitoes over their
lifespan.10 Measurement error is also possible due to operational constraints and collection procedures such as skill of collection staff, time available per premise, size of premise, and
degree of access permitted by residents.51
Adequate sampling of immature and adult populations requires consideration of vector
dynamics53 and spatial relationships.57 Sampling techniques have been demonstrated to limit the power of longitudinal studies of DENV transmission, as household-level sample sizes used for
entomological monitoring often do not exceed 100 households, which may result in bias due to
sampling error.57 A multi-country study of entomological surveys found sample size requirements varied by levels of vector dispersion, suggesting that spatial dynamics affect
statistical power.53 Per person measures may be unreliable due to inaccurate population data, which may vary by location at any given day or season, as humans move across time and
space.57 Rates that capture mosquito populations over a geographic area rather than per person
Despite these limitations, entomological surveillance data are promoted as proxies for
exposure to Ae. aegypti.40 Entomological survey measures are also a critical process indicator
used to evaluate the effectiveness of vector control interventions in terms of reducing dengue
disease, in order to compare pre- and post-intervention mosquito populations. Given these
limitations, it is important to determine the potential use of entomological indicators of vector
exposure calculated from both observed data as well as using methods to account for possible
Table 1. Indices Used to Measure Aedes aegypti Density
Index Formula Mosquito
Life Stage* House Index/Premise
Index/Aedes Index50
# 𝑜𝑓 ℎ𝑜𝑢𝑠𝑒ℎ𝑜𝑙𝑑𝑠 𝑖𝑛𝑓𝑒𝑠𝑡𝑒𝑑 𝑤𝑖𝑡ℎ 𝑙𝑎𝑟𝑣𝑎𝑒 𝑜𝑟 𝑝𝑢𝑝𝑎𝑒
𝑡𝑜𝑡𝑎𝑙 𝑛𝑢𝑚𝑏𝑒𝑟 𝑜𝑓 ℎ𝑜𝑢𝑠𝑒ℎ𝑜𝑙𝑑𝑠 ∙ 100%
Larvae or Pupae Container
Index50/Receptacle Index
# 𝑜𝑓 𝑐𝑜𝑛𝑡𝑎𝑖𝑛𝑒𝑟𝑠 𝑖𝑛𝑓𝑒𝑠𝑡𝑒𝑑 𝑤𝑖𝑡ℎ 𝑙𝑎𝑟𝑣𝑎𝑒 𝑜𝑟 𝑝𝑢𝑝𝑎𝑒
𝑡𝑜𝑡𝑎𝑙 𝑛𝑢𝑚𝑏𝑒𝑟 𝑜𝑓 𝑐𝑜𝑛𝑡𝑎𝑖𝑛𝑒𝑟𝑠 𝑖𝑛𝑠𝑝𝑒𝑐𝑡𝑒𝑑 ∙ 100%
Larvae or Pupae
Infested Receptacle Index59
# 𝑜𝑓 𝑝𝑜𝑠𝑖𝑡𝑖𝑣𝑒 𝑐𝑜𝑛𝑡𝑎𝑖𝑛𝑒𝑟𝑠
𝑡𝑜𝑡𝑎𝑙 𝑛𝑢𝑚𝑏𝑒𝑟 𝑜𝑓 ℎ𝑜𝑢𝑠𝑒ℎ𝑜𝑙𝑑𝑠 (𝑝𝑟𝑒𝑚𝑖𝑠𝑒𝑠)
Larvae or Pupae Stegomyia Index60 # 𝑜𝑓 𝑝𝑜𝑠𝑖𝑡𝑖𝑣𝑒 𝑐𝑜𝑛𝑡𝑎𝑖𝑛𝑒𝑟𝑠
𝑝𝑜𝑝𝑢𝑙𝑎𝑡𝑖𝑜𝑛 ∙ 1000 𝑝𝑒𝑟𝑠𝑜𝑛𝑠
Larvae
Breteau Index61 # 𝑜𝑓 𝑝𝑜𝑠𝑖𝑡𝑖𝑣𝑒 𝑐𝑜𝑛𝑡𝑎𝑖𝑛𝑒𝑟𝑠
𝑡𝑜𝑡𝑎𝑙 ℎ𝑜𝑢𝑠𝑒ℎ𝑜𝑙𝑑𝑠 ∙ 100 ℎ𝑜𝑢𝑠𝑒ℎ𝑜𝑙𝑑𝑠
Larvae
Density Index62 Nine degrees of infestation derived from multi-country assessments of the House Index, Breteau Index and Container Index; use a reference table to match either the Breteau Index, House Index or Container Index to its corresponding value of 1 to 9*
Larvae or Pupae
Stegomyia Larval Density Index63
# 𝑜𝑓 𝑙𝑎𝑟𝑣𝑎𝑒
𝑝𝑜𝑝𝑢𝑙𝑎𝑡𝑖𝑜𝑛 ∙ 1000 𝑝𝑒𝑟𝑠𝑜𝑛𝑠
Larvae
Larval Density Index64
# 𝑜𝑓 𝑙𝑎𝑟𝑣𝑎𝑒 𝑡𝑜𝑡𝑎𝑙 ℎ𝑜𝑢𝑠𝑒ℎ𝑜𝑙𝑑𝑠
Larvae
Single Larval Method65
# 𝑜𝑓𝑐𝑜𝑛𝑡𝑎𝑖𝑛𝑒𝑟𝑠 𝑤𝑖𝑡ℎ ≥ 1 𝐴𝑒𝑑𝑒𝑠 𝑙𝑎𝑟𝑣𝑎 Larvae
Pupae per Hectare55 # 𝑜𝑓 𝑝𝑢𝑝𝑎𝑒 ℎ𝑒𝑐𝑡𝑎𝑟𝑒
Pupae
Pupae per Person55 # 𝑜𝑓 𝑝𝑢𝑝𝑎𝑒
𝑝𝑜𝑝𝑢𝑙𝑎𝑡𝑖𝑜𝑛
Pupae
Pupa Index/Pupal Density Index66
# 𝑜𝑓 𝑝𝑢𝑝𝑎𝑒
𝑡𝑜𝑡𝑎𝑙 # ℎ𝑜𝑢𝑠𝑒ℎ𝑜𝑙𝑑𝑠 𝑖𝑛𝑠𝑝𝑒𝑐𝑡𝑒𝑑∙ 100
Pupae
Potential Container Index94
# 𝑜𝑓 𝑝𝑜𝑡𝑒𝑛𝑡𝑖𝑎𝑙 𝑏𝑟𝑒𝑒𝑑𝑖𝑛𝑔 𝑠𝑖𝑡𝑒𝑠 + # 𝑝𝑜𝑠𝑖𝑡𝑖𝑣𝑒 𝑏𝑟𝑒𝑒𝑑𝑖𝑛𝑔 𝑠𝑖𝑡𝑒𝑠 𝑡𝑜𝑡𝑎𝑙 # ℎ𝑜𝑢𝑠𝑒ℎ𝑜𝑙𝑑𝑠 (𝑝𝑟𝑒𝑚𝑖𝑠𝑒𝑠) 𝑖𝑛𝑠𝑝𝑒𝑐𝑡𝑒𝑑
Table 1 (Continued)
Index Formula Mosquito
Life Stage* Block Index87 # 𝑜𝑓 𝑏𝑙𝑜𝑐𝑘𝑠 𝑤ℎ𝑒𝑟𝑒 ℎ𝑜𝑢𝑠𝑒𝑠 𝑠ℎ𝑜𝑤 𝑒𝑣𝑖𝑑𝑒𝑛𝑐𝑒 𝑜𝑓 𝑏𝑟𝑒𝑒𝑑𝑖𝑛𝑔
𝑡𝑜𝑡𝑎𝑙 # 𝑜𝑓 𝑏𝑙𝑜𝑐𝑘𝑠 𝑠𝑢𝑟𝑣𝑒𝑦𝑒𝑑
Larvae and Pupae Mean Adult Density # 𝑜𝑓 𝑡𝑟𝑎𝑝𝑝𝑒𝑑 𝑎𝑑𝑢𝑙𝑡𝑠
𝑡𝑜𝑡𝑎𝑙 # 𝑎𝑑𝑢𝑙𝑡 𝑡𝑟𝑎𝑝𝑠
Adult Mean Egg Density # 𝑜𝑓 𝑒𝑔𝑔𝑠 𝑐𝑜𝑙𝑙𝑒𝑐𝑡𝑒𝑑
𝑡𝑜𝑡𝑎𝑙 # 𝑒𝑔𝑔 𝑡𝑟𝑎𝑝𝑠
Egg Adult Premise Index51 # 𝑜𝑓𝑝𝑟𝑒𝑚𝑖𝑠𝑒𝑠 𝑤𝑖𝑡ℎ 𝑓𝑒𝑚𝑎𝑙𝑒 𝐴𝑒. 𝑎𝑒𝑔𝑦𝑝𝑡𝑖
𝑡𝑜𝑡𝑎𝑙 # 𝑝𝑟𝑒𝑚𝑖𝑠𝑒𝑠 𝑠𝑢𝑟𝑣𝑒𝑦𝑒𝑑
Adult
Adult Density Index51 # 𝑜𝑓 𝑓𝑒𝑚𝑎𝑙𝑒 𝐴𝑒. 𝑎𝑒𝑔𝑦𝑝𝑡𝑖 𝑡𝑜𝑡𝑎𝑙 # 𝑝𝑟𝑒𝑚𝑖𝑠𝑒𝑠 𝑠𝑢𝑟𝑣𝑒𝑦𝑒𝑑
Adult
Premise Condition Index67
Exposed defined as at least three infested containers Larvae and Pupae Ovitrap density
index51
# 𝑜𝑓 𝑒𝑔𝑔𝑠 𝑓𝑜𝑢𝑛𝑑 𝑖𝑛 4 𝑤𝑒𝑒𝑘𝑠 𝑡𝑜𝑡𝑎𝑙 # 𝑝𝑟𝑒𝑚𝑖𝑠𝑒𝑠
Egg Ovitrap premise
index68
# 𝑜𝑓 𝑝𝑟𝑒𝑚𝑖𝑠𝑒𝑠 𝑝𝑜𝑠𝑖𝑖𝑡𝑣𝑒 𝑓𝑜𝑟 𝑒𝑔𝑔𝑠 𝑡𝑜𝑡𝑎𝑙 # 𝑝𝑟𝑒𝑚𝑖𝑠𝑒𝑠 𝑖𝑛𝑠𝑝𝑒𝑐𝑡𝑒𝑑 ∙ 100
Egg
Index Index Index
Larval Premise Index66
# 𝑜𝑓 𝑝𝑟𝑒𝑚𝑖𝑒𝑠 𝑝𝑜𝑠𝑖𝑡𝑖𝑣𝑒 𝑤𝑖𝑡ℎ 𝑙𝑎𝑟𝑣𝑎𝑒 𝑡𝑜𝑡𝑎𝑙 𝑝𝑟𝑒𝑚𝑖𝑠𝑒𝑠 ∙ 100
Larval Free Larval Index69 # 𝑜𝑓 𝑝𝑟𝑒𝑚𝑖𝑒𝑠 𝑝𝑜𝑠𝑖𝑡𝑖𝑣𝑒 𝑤𝑖𝑡ℎ𝑜𝑢𝑡 𝑙𝑎𝑟𝑣𝑎𝑒
𝑡𝑜𝑡𝑎𝑙 𝑝𝑟𝑒𝑚𝑖𝑠𝑒𝑠 ∙ 100
Larval
CHAPTER 4: AIM 1 LITERATURE REVIEW
4.1Introduction
If Ae. aegypti abundance and dengue outcomes were well-correlated or served as an adequate proxy for a substantial proportion of transmission events, then a strong positive
association would be expected. Rather than demonstrating a consistently positive association
between observed density and dengue outcomes, observational studies of the association between
Ae. aegypti abundance and dengue outcomes have been inconclusive. A 2014 literature review identified 18 publications, of which most associations were inconclusive and the analytical
methods were not robust.8 An additional 14 studies not included in that review have also attempted to quantify this association; those results were also generally inconclusive. Of these
studies, 26 estimated an association between vector abundance and apparent dengue only, while
the remaining 6 studies included DENV seroconversion as an outcome. Since apparent dengue
cases represent a fraction of all transmission events, these two outcomes warrant discussion
separately.
4.2 Ae. aegypti Density and Apparent Dengue
vector population measured at a given time and location is the same as the true value at that time
and location, which is equal to or well-correlated with actual DENV virus exposure, which
happens at a different time and likely a different location. Once exposed to DENV,
seroconversion occurs, followed by apparent disease and presentation to a health facility. The
relationship presented in Figure 1 assumes that all infections lead to apparent disease, and that all
individuals with apparent illness seek treatment. These assumptions are violated in dengue
endemic settings.
Figure 1. Relationship between observed Ae. aegypti abundance and dengue outcomes if true association exists
Table 2 presents a summary of publications quantifying an association between Ae. aegypti density and apparent dengue cases. Since only a fraction of dengue infections present as apparent illness, studies that use apparent dengue fail to capture the true distribution of dengue
virus infection.1 Apparent dengue is more likely the result of unmeasured individual host factors and may not follow the same distribution as DENV infection throughout the community.
Twelve of these studies suggested positive associations between indicators of mosquito
abundance and dengue disease using different indicators, data collection and analytical methods.
Figure 2 illustrates a possible selection bias mechanism when apparent dengue is used as
a study outcome. The association of interest is the arrow from the measured value of Ae. aegypti
to dengue disease. Only a subset of all cases will be captured by the health system, represented
association between entomological monitoring data and dengue disease because presentation to
health centers and entomological exposure are likely associated with various demographic,
economic and household factors. Conditioning on 𝐶𝑡𝑙 introduces bias through the backdoor path
from 𝑀𝑠𝑖𝑡𝑖
∗ to W to 𝐶
𝑡𝑙 to 𝐷𝑡𝑘.
Figure 2. Possible selection bias mechanism in reported apparent dengue disease as a study outcome
Variability in case detection methods could further bias associations with entomological
data. Febrile dengue disease data are either obtained retrospectively through health system
records or identified via prospectively recruited febrile patients from the community. Apparent
dengue is classified by symptoms, which generally include fever, myalgia and headache as well
febrile illness could result in other febrile illnesses being misclassified as dengue, especially in
settings where Japanese Encephalitis Virus, malaria, chikungunya, influenza or yellow fever
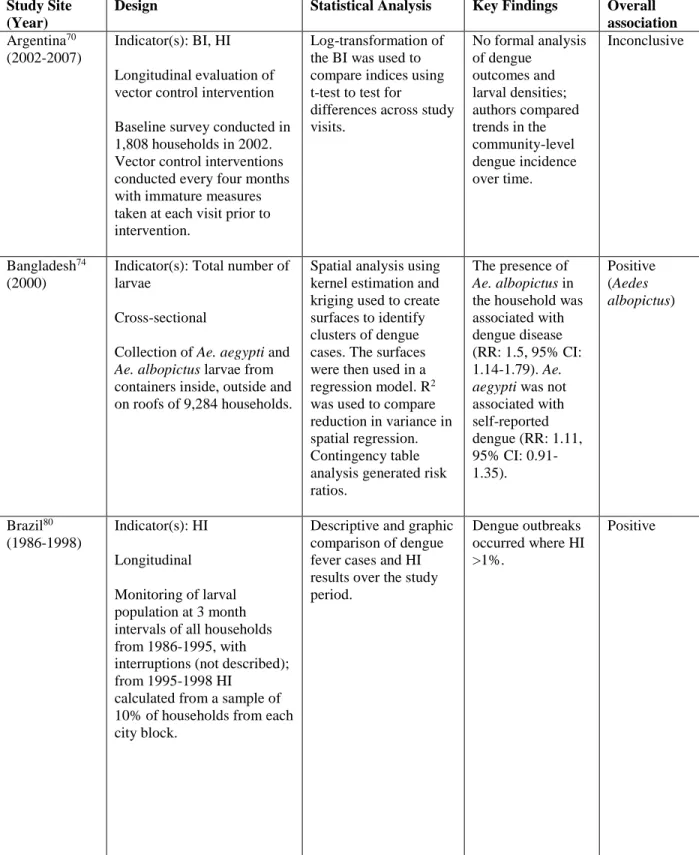
Table 2. Studies that measure an association between Ae. aegypti density and apparent dengue
Study Site (Year)
Design Statistical Analysis Key Findings Overall association Argentina70
(2002-2007)
Indicator(s): BI, HI Longitudinal evaluation of vector control intervention Baseline survey conducted in 1,808 households in 2002. Vector control interventions conducted every four months with immature measures taken at each visit prior to intervention.
Log-transformation of the BI was used to compare indices using t-test to test for
differences across study visits.
No formal analysis of dengue
outcomes and larval densities; authors compared trends in the community-level dengue incidence over time. Inconclusive Bangladesh74 (2000)
Indicator(s): Total number of larvae
Cross-sectional
Collection of Ae. aegypti and
Ae. albopictus larvae from containers inside, outside and on roofs of 9,284 households.
Spatial analysis using kernel estimation and kriging used to create surfaces to identify clusters of dengue cases. The surfaces were then used in a regression model. R2 was used to compare reduction in variance in spatial regression. Contingency table analysis generated risk ratios.
The presence of
Ae. albopictus in the household was associated with dengue disease (RR: 1.5, 95% CI: 1.14-1.79). Ae. aegypti was not associated with self-reported dengue (RR: 1.11, 95% CI: 0.91-1.35). Positive (Aedes albopictus) Brazil80 (1986-1998) Indicator(s): HI Longitudinal Monitoring of larval population at 3 month intervals of all households from 1986-1995, with interruptions (not described); from 1995-1998 HI
calculated from a sample of 10% of households from each city block.
Descriptive and graphic comparison of dengue fever cases and HI results over the study period.
Dengue outbreaks occurred where HI >1%.
Table 2 (Continued) Study Site
(Year)
Design Statistical Analysis Key Findings Overall association Brazil75
(1996-2001)
Indicator(s): HI Longitudinal
Infestation index calculated as the proportion of positive (larvae or pupae) properties among the total surveyed properties. Data from 13 surveys conducted during study period were analyzed.
Pearson correlation to measure association between monthly incident rate and HI; ANOVA to test four quantiles of the HI distribution.
Weak correlations (0.25, 0.21, 0.14) between various aggregated monthly incidence rates.
No association found in ANOVA analysis.
Inconclusive
Brazil81 (2007-2010)
Indicator(s): Average mosquito density per neighborhood Longitudinal
Weekly monitoring of mosquito traps placed throughout the entire city.
A hierarchical Poisson regression used to predict weekly case data by average mosquito density, with a random effect term for neighborhood.
Models showed a weak association between weekly cases and adult mosquito densities; model fit statistics suggest limited predictive power even when accounting for space. Neighborhood effects improved model fit. Inconclusive Colombia66 (1996-1997)
Indicator(s): Geometric mean of eggs, larvae, pupae, adults Longitudinal
Monthly entomological data collected from 120 premises over a 7-month period.
Correlation statistics No correlation between indices and incidence of dengue disease. None Colombia82 (2002-2008) Indicator(s): BI Longitudinal
Entomological surveys were carried out by local health authority 2-3 times per year.
Ecological model constructed to generate predicted areas of Ae. aegypti infestation. Linear regression then used to test for association between apparent case rates and the proportion of neighborhood area predicted to have mosquito breeding.
Table 2 (Continued) Study Site
(Year)
Design Statistical Analysis Key Findings Overall association Cuba83
(2001)
Indicator(s): BI Longitudinal
All household inspected monthly from May-July among 50 households and surrounding blocks; BI calculated at block level and neighborhood level.
A BI ≥4 in a
neighborhood was used to classify exposure to mosquitoes.
Sensitivity and specificity were calculated using the exposure definition.
A BI ≥4 predicted dengue cases with a sensitivity of 81.8% and a specificity of 73.3%. Inconclusive India78 (1970-1989) Indicator(s): HI
Cross-sectional analysis of nine different dengue outbreaks.
Entomological methods not adequately described.
Correlation of HI and apparent dengue cases.
When HI exceeds 20%, a higher dengue fever attack rate was observed.
Positive
India77 (1996-2001)
Indicator(s): BI, CI, HI Longitudinal
Entomological indicators calculated monthly at sentinel site locations.
Descriptive analysis in which case numbers and annual HI measures are visually compared over time.
Overall HI decline was observed from 1996-2001 but apparent dengue cases were did not decline from 1997-2001.
None
India76 (2012)
Indicator(s): BI, CI, HI Longitudinal
Weekly surveillance of entomological data and anti-larval and anti-adult mosquito interventions implemented.
Descriptive comparison of proportion of febrile cases and HI, BI and CI results.
Reduction in mosquito population across all indices after interventions; no clear trend in reduction of dengue cases.
None
Indonesia69 Indicator(s): BI, CI, HI, Pupa Index, Free Larval Index Longitudinal
4 villages (2 identified as endemic and 2 identified as
Chi-square test, t-test to compare differences in indices values
comparing endemic to non-endemic villages.
No association observed between immature indices.
Table 2 (Continued) Study Site
(Year)
Design Statistical Analysis Key Findings Overall association Malaysia84 Indicator(s): BI, HI
Longitudinal 12 monthly container inspections of a 80-100 randomly selected households per month.
Correlation statistics to measure the association between number of incident cases and BI and HI.
Positive correlation (HI, r=0.432; BI, r=0.351)
Positive
Malaysia85 (1994)
Indicator(s): BI, HI Longitudinal
Monthly entomological surveys (unclear if they occurred at the same sites).
Correlation statistics to measure association between dengue cases and mosquito indicators. Correlation statistics were generally statistically insignificant; only one of the six study sites demonstrated significant correlation between mosquito exposure and apparent dengue (r=0.60). None Peru86 (2002-2004)
Indicator(s): Aedes Index, BI, CI
Periodic entomological surveys conducted from 2002-2004 (months surveyed varied by year).
Correlation statistics to measure association between indices and dengue cases
Regression analysis to use Aedes Index to predict number of dengue cases.
Correlation statistics between total and monthly cases of dengue (with intervention) and AI, BI, CI were >0.9. Linear regression of density indicators were statistically significant predictors of monthly dengue cases. Positive Thailand87 (2007)
Indicator(s): BI, CI, HI Cross-sectional Dengue indices were collected from a total of 10 villages (one per province); febrile rates were derived from existing provincial data.
Descriptive GIS analysis, no statistical methodology. Visual comparison of BI, HI and CI for each village for low and high epidemic periods.
Substantial variability in village-level indices for low and high periods limits interpretation.
Table 2 (Continued) Study Site
(Year)
Design Statistical Analysis Key Findings Overall association Taiwan88
(1987-1988)
Indicator(s): Presence of breeding sites
Case-control matched on age and sex
Participant self-report of mosquito presence and breeding sites at household.
Univariable odds ratios. No association, presence of breeding sites had an OR of 0.84 (95% CI: 0.47-1.50) None Taiwan89 (2002) Indicator(s): BI Longitudinal Monthly entomological surveys of 50 households.
Geographically weighted regression using ordinary least squares to determine spatial heterogeneity in the association between the BI and rate of dengue cases per 100,000. Spatial heterogeneity for dengue-mosquito relationship was observed. BI correlates dengue incidence but not uniformly throughout study area.
Inconclusive
Taiwan90 (2005-2012)
Indicator(s): Aedes Index, BI, CI, HI
Longitudinal
Weekly, monthly or bi-monthly entomological inspection carried out in one district for 50-100 randomly sample households per city neighborhood, collected May-December of each year. Frequency of inspection was determined by prior
entomological data (high, medium or low risk).
A separate predictive Poisson regression model was fit for each indicator and climate variables, stratified by density status.
Table 2 (Continued) Study Site
(Year)
Design Statistical Analysis Key Findings Overall association Taiwan91
(2005-2012)
Indicator(s): Aedes Index, BI, CI, HI
Case-crossover
Cases were defined upon presentation with apparent dengue and their prior-weekly exposure was selected as a control at weeks 3, 6 and 9 before diagnosis. Entomological exposure derived from weekly surveillance data.
Conditional logistic regression to estimate the odds of becoming a dengue case controlling for vector indices and meteorological
variables. Analysis was stratified by low, medium and high density status.
AI was significantly associated across density levels (OR: 1.29, 95% CI: 1.24-1.35; OR: 1.45, 95% CI: 1.36-1.55; OR: 1.32, 95% CI: 1.24-1.39). Positive Trinidad92 (1998) Indicator(s): BI Case-Control
Larval collections at 87 case households (positive for apparent dengue) and 87 control households matched by age and sex.
G-test to compare differences in BI values.
Lower BI observed among control households.
Positive
Trinidad93 (2002-2004)
Indicator(s): BI, HI
Monthly household visits for container inspection.
Spearman rank, Chi-square and G-tests to compare BI values.
Higher range of density among case households.
Inconclusive
Trinidad71 (2003)
Indicator(s): BI, HI Case-Control
Larval collections at 30 case households (positive for apparent dengue) and 120 control households selected based on cardinal direction adjacent from case household (north, south, east, west).
Chi-square tests of association, G-test.
Primary finding that households to east and west of index cases were more likely to be positive for Ae. aegypti compared to households north and south.
Table 2 (Continued) Study Site
(Year)
Design Statistical Analysis Key Findings Overall association Trinidad72
(2003-2004)
Indicator(s): HI, BI, Pupa Index, CI, Pupae per Hectare
Case-Control
Larval collections at 33 case households (positive for apparent dengue) and 132 control households selected based on cardinal direction adjacent from case household (north, south, east, west) taken within 48 hours of case detection.
Retrospective entomological survey data reviewed from previous year (4 visits).
G-test to compare location of case households with measures of infestation Prior densities
compared with the measures taken within 48 hours of case detection.
Primary finding that households to east and west of index cases were more likely to be positive for Ae. aegypti compared to households north and south.
Densities measured during case investigation higher than those reported through routine entomological surveillance. Positive Venezuela94 (2000-2001)
Indicator(s): Adult measures Longitudinal
Entomological measures taken by backpack aspirator among households and neighboring households where dengue cases were identified.
Pearson correlation Positive correlation between abundance of Ae. aegypti
(r=0.677, p=0.0078).
Positive
Vietnam79 (2004-2008)
Indicator(s): BI, CI, HI, presence of adult mosquito Monthly larval data were collected from 100 households randomly selected from 8 districts. Households were randomly selected at each monthly visit.
Poisson regression model used to determine association between counts of dengue disease and mosquito density.
Rate ratios were statistically significant for: Per 5% increase: HI: 1.66 (1.62-1.70)
Mosquito: 1.16 (1.14-1.18) CI: 1.78 (1.73-1.83).
Per 5-unit increase: BI: 1.57 (1.53-1.60).
4.3 Ae. aegypti Density and Inapparent Dengue
Of the total 32 studies reviewed, only six evaluated an association between DENV
infection and mosquito abundance, either by measuring seroconversion or seroprevalence.
Instead of febrile outcomes, seroconversion to DENV should be used as the primary outcome as
prevention of DENV transmission by vector control is the primary rationale for the use of
entomological monitoring data. This outcome is more relevant for DENV control, increases
sample size and is more representative of patterns of vector-human interaction. Furthermore,
inapparent dengue is an outcome of additional public health importance, as there is some
evidence that subsequent infections with DENV may increase the likelihood an individual
experiences severe dengue disease.1 Table 3 presents a summary of the studies in which
inapparent DENV infection was the primary outcome of interest.
In terms of subject enrollment, inapparent dengue is more difficult to measure than
apparent as it requires recruitment of subjects for serological sample collection, as opposed to
reviewing dengue disease case reports or identifying individuals with febrile disease as they
present at hospitals or clinics. Studies of seroincidence require longitudinal follow-up, which
poses challenges with respect to subject retention. DENV serological evaluation procedures
have been demonstrated to have variable performance depending on serotype and assay.95, 96
Interpretation of longitudinal serological data could result in outcome misclassification if
serotype-specific associations are of interest due to cross-reactivity between serotypes as a result
of prior exposure, as well as possible cross-reaction with other flaviviruses.95 If the outcome of interest is any DENV seroconversion, this misclassification is less of a concern.
Serologically-identified DENV infections are less likely than apparent dengue cases to be
quality, access to sanitation, age and sex. These individual and household characteristics likely
influence health-seeking behavior, which may introduce selection bias when identifying febrile
disease through passive surveillance. By including infection events, it is possible to avoid
Table 3. Studies that measure an association between Ae. aegypti density and inapparent dengue
Study Site (Year)
Design Statistical Analysis Key Findings Overall association Brazil97
(2006-2008)
Indicator(s): Mean Adult Density
Mean Egg Density Longitudinal Weekly collection of eggs and adults from randomly sampled households.
Generalized Additive Model (allows for non-linearity of age to be included in a regression model). Spatial analysis employed household coordinates to generate a surface of dengue infections and mosquito densities.
Due to small sample size, only used visual
inspection of contour maps to determine if greater numbers of mosquitoes were associated with dengue infection; No strong pattern observed. None Cuba98 (2000) Indicator(s): BI Case-control BI measured every 2 months in every household.
Analysis conducted at block and neighborhood level. Case blocks defined as any block with at least one confirmed dengue case; control blocks sampled from blocks with no dengue case; serology collected among all persons with history of a fever. Logistic
regression to estimate odds ratio for BI measures.
Maximum BI ever reported found to be strongly associated with positive dengue case blocks (OR: 3.4, 95% CI: 1.2-9.6). Association varied at different time periods.
Positive
Mexico99 (1980)
Indicator(s): CI, BI, HI Longitudinal
Two areas in two separate cities selected for entomological surveillance in February and September 1980; every other house surveyed for larvae; CI data only collected in September.
Pearson correlation statistics (percentage of individuals infected with CI, BI, and HI).
No correlation in
February between Breteau and House Index;
Correlation coefficient of 0.95 (House Index and Container Index) and 0.90 (Breteau Index) in September.
Table 3 (Continued) Study Site
(Year)
Design Statistical Analysis Key Findings Overall association Puerto
Rico100 (1991)
Indicator(s): Number of female Aedes aegypti per person
Cross-sectional Random sample of 98 households in a single neighborhood, adult mosquitoes collected in occupied bedrooms using backpack aspirators.
Forward selection to build predictive model based on personal and household risk factors, only included
households with confirmed recent infections or households never infected.
An OR of 2.77 found for households with >1.5
Aedes aegypti per person (95% CI: 0.70-13.33).
None
Sudan101 (2008-2009)
Indicator(s): BI, CI, HI, Pupae per person, Pupae per children Longitudinal
Pupae, larvae and adult mosquitoes collected monthly from a sample of households (different households sampled each time).
Chi-square tests of association and ANOVA
Temporal and spatial pattern of dengue outcomes and entomological indices generally correlated; study did not include households for which no
Ae. aegypti were observed in sampling for
serological status.
Inconclusive
Thailand102 (2004-2005)
Indicator(s): BI, CI, HI, Pupal and adult densities Case-control (febrile dengue cases were used to identify groups of households as either “positive” or “negative” dengue clusters). Adult female Ae. aegypti
were collected at the time of case and control identification; larvae and pupae were collected from containers.
Independent t-tests to compare positive and negative clusters.
No statistically significant differences observed, but all mosquito indices were higher in positive clusters compared to negative clusters.
4.4 Limitations of Prior Studies
In addition to the choice of dengue outcome (apparent or inapparent), there is a wide
range of other analytical limitations that could have introduced bias in the studies presented in
Table 2 and Table 3. First, several studies employ small sample sizes of dengue-related
outcomes. For example, a study in Brazil only had 28 infections97; one in India76 included 79 apparent cases. Most studies recruited a larger sample of households for entomological data,
although in Trinidad72,92, Puerto Rico100 and Taiwan89 the number of households providing
entomological data was less than 100 (the minimum sample size recommended103).
Second, study design methods were reported that may have biased results or limited
generalizability. In Venezuela82 and Sudan101, entomological measures were only taken among
households contributing dengue cases or DENV seroconversions. In the Venezuela study, the
positive association observed may have been biased due to an inclusion of individuals with
higher densities than those in the general population. The Sudan study, which generated
extremely detailed data on immature population over time and space, provides evidence to
support a dose-response relationship among those where Ae. aegypti were observed. The
exclusion of outcome information from households with no exposure, however, does not account
for dengue outcomes across the full distribution of Ae. aegypti. In Taiwan88, participants
self-reported household breeding sites and mosquito presence. Self-self-reported data on mosquito
infestation are likely subject to recall and response bias, especially among individuals who
experienced disease. In Sanchez 200698, only individuals with a history of fever were asked to provide serological samples; this excludes the proportion of individuals who were not febrile but
Third, many of these studies employed statistical analysis methods that provide limited
inference. Most notably are studies that relied on Pearson correlation coefficients, g-tests or
t-tests to ascertain an association between density and either number of cases or percentage of
individuals positive for a dengue outcome.66, 69-73, 75, 78, 80, 84-87, 92, 94, 99 Correlation coefficients can be misused to describe associations, particularly among cases in which a purely linear
relationship may not exist, if there is heterogeneity of effect among subgroups within the dataset,
or extreme outliers exist in the data that inflate coefficients.104 Other inadequate statistical
techniques include failure to account for dependency in regression analysis and use of linear
instead of Poisson regression to model rates of dengue disease. Finally, four studies essentially
presented visual or descriptive comparisons of vector density instead of formal statistical
comparisons.76, 77, 80, 97 The most robust statistical analyses used predictive modeling studies in Taiwan90, and Brazil81 and epidemiologic designs in Thailand102, and Taiwan.91
Finally, several studies69, 76, 79, 86, 87 used aggregated disease outcomes such as district-level incidence which can induce bias due to the modifiable areal unit problem (MAUP). MAUP
introduces statistical error when point-based events are aggregated into district or regional
estimates.105 This is similar to the ecological fallacy, which might also operate in these
examples, in which inference on individuals is construed from group-level findings.106 In these
examples (notably, Argentina70, Vietnam79, Taiwan89), aggregated outcome data such as district incidence was compared to overall trends in entomological survey results to make statements
about the role of entomological exposure on dengue outcomes. While these comparisons are
entomological data may not relate to the exposure of individuals contributing to incidence rate or
prevalence of dengue disease.
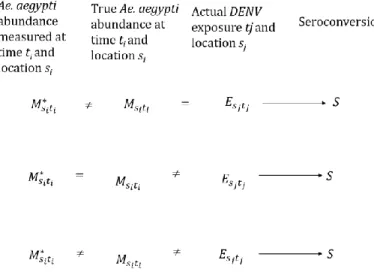
4.5Entomological Data as a Proxy for True DENV Exposure
Failure to detect an association between inapparent DENV infection and mosquito
abundance likely results from three scenarios, illustrated graphically in Figure 3. The first
scenario exists when measured density is subject to error and does not reflect true density at a
given location and time, but that true density is well-correlated with actual DENV exposure. Ae. aegypti indicators force cross-sectional measurement upon a highly time-varying, dynamic exposure. It is possible that current entomological survey techniques may not capture the fine
spatial and temporal variability of vector populations in an urban setting, mainly due to
operational limitations, differences in time of collection, and skill of study collection staff.10 Figure 3. Bias due to measurement error among studies with DENV seroconversion as a
primary outcome
The second scenario posits that measurement is accurate, but that there is no equivalence
or correlation between true density at the location and time of survey and true DENV exposure,