BREAST CANCER RISK AFTER METFORMIN INITIATION IN OLDER WOMEN: THE ROLE OF STUDY DESIGN, POTENTIAL CONFOUNDING BY BODY MASS INDEX,
AND DIFFERENTIAL DETECTION
Jin-Liern Hong
A dissertation submitted to the faculty at the University of North Carolina at Chapel Hill in partial fulfillment of the requirements for the degree of Doctor of Philosophy in the Department
of Epidemiology in the Gillings School of Global Public Health.
Chapel Hill 2015
Approved by: Til Stürmer
Michele Jonsson Funk John Buse
ABSTRACT
Jin-Liern Hong: Breast Cancer Risk after Metformin Initiation in Older Women: the Role of Study Design, Potential Confounding by Body Mass Index, and Differential Detection
(Under the direction of Til Stürmer)
Several observational studies reported that metformin may reduce breast cancer risk; however, many of these studies were affected by time-related biases. Additionally, confounding by unmeasured body mass index (BMI) and differential detection for breast cancer have not been examined in metformin-breast cancer studies. The dissertation aimed to examine the relative risk of breast cancer for older women initiating metformin versus sulfonylureas, avoiding time-related bias and accounting for potential bias due to unmeasured confounding and differential screening mammography.
Metformin initiators did not have reduced risks of breast cancer compared with sulfonylureas initiators (Hazard Ratio: 1.08; 95% Confidence Interval: 0.81 to 1.44). Externally controlling for BMI and smoking did not affect the estimate, indicating a little independent effect of BMI and smoking on metformin relative to sulfonylureas prescribing. Metformin initiators were not only more frequently screened for breast cancer than sulfonylureas initiators, but they also had higher probabilities of screen-detected breast cancer both in 12 months before and after initiation. The results indicate possible detection bias due to differential screening mammography, but the absolute difference in screen-detected breast cancer is too small to explain observing no metformin-breast cancer association assuming a real protective effect of metformin.
To my dear family.
ACKNOWLEDGEMENTS
I would like to express my sincere gratitude to my advisor, Dr. Til Stürmer, who has been a tremendous mentor to me. I very much appreciate his guidance, expertise, patience, and support throughout my studies at UNC, especially in development and completion of this dissertation work. Thank you for keeping the office door open and available for all the times when I needed the advice. I would like to thank my committee members, Drs. Michele Jonsson Funk, John Buse, Louise Henderson, Jennifer Lund, for their expertise and valuable suggestions throughout this work.
I would also like to thank Drs. Cynthia Girman and Annie McNeill at Merck, Inc., for the opportunity to work as a graduate research assistant. Funding support was truly helpful for the last several years of my studies, but I am far more grateful for our collaboration on these interesting projects. My grateful thanks are also extended to Mrs. Virginia Pate for her help and knowledge in database and statistical programming techniques. Special thanks go to Mrs. Nancy Colvin for her kindness and administrative assistance.
TABLES OF CONTENTS
CHAPTER 1. STATEMENT OF SPECIFIC AIMS... 1
CHAPTER 2. REVIEW OF LITERATURE ... 4
CHAPTER 3. METHODS ... 13
LIST OF TABLES ... ix
LIST OF FIGURES ... xi
LIST OF ABBREVIATIONS ... xii
I. Metformin ... 4
II. Plausible mechanism for antitumor action of metformin ... 5
III. Clinical Studies of the effect of metformin on the risk of breast cancer ... 5
IV. Methodological concerns on available literature ... 8
V. Significance ... 10
VI. Tables ... 12
I. Overall Strategy ... 13
II. Data Source ... 14
III. Study Population ... 15
IV. Variables of Interests ... 17
V. Confounding Control ... 20
CHAPTER 4. BREAST CANCER RISK IN OLDER WOMEN INITIATING
METFORMIN VERSUS SULFONYLUREAS ... 27
CHAPTER 5. DIFFERENTIAL USE OF SCREENING MAMMOGRAPHY IN OLDER WOMEN INITIATING METFORMIN VERSUS SULFONYLUREAS... 50
CHAPTER 6. CONCLUSIONS... 82
REFERENCES ... 89
I. Introduction ... 27
II. Methods ... 28
III. Results... 32
IV. Discussion and Conclusions ... 34
V. Tables and Figures ... 38
I. Introduction ... 50
II. Methods ... 51
III. Results... 54
IV. Discussion and Conclusions ... 57
V. Tables and Figures ... 62
I. Summary of Findings ... 82
II. Strengths ... 84
III. Limitations ... 84
IV. Public Health Implications ... 86
V. Future Research ... 87
LIST OF TABLES
TABLE 2.1. Methodological concerns in previous metformin-cancer studies ... 12
TABLE 4.1. Characteristics in New Users of Metformin and Sulfonylureas at Baseline ... 38
TABLE 4.2. Incidence Rates and Hazard Ratios for Breast Cancer by Treatment Cohort ... 40
TABLE 4.3. Sensitivity Analyses ... 41
TABLE 4.4. Sensitivity Analyses for Induction and Latency Periods in As-Treated Analysis ... 43
TABLE 4.5. Sensitivity Analyses for Induction Periods in Intention-to-Treat Analysis ... 44
TABLE 4.6. Characteristics in Metformin and Sulfonylureas at Baseline in the MCBS 2006-2009 ... 45
TABLE 5.1. Characteristics at baseline among metformin and sulfonylureas initiators in the new user cohort ... 62
TABLE 5.2. Proportions of women receiving at least one screening test within 2-year window of 12 months before and after initiation. ... 64
TABLE 5.3. Frequency of screening mammograms and screen-detected breast cancer over 2 years in the new user cohort, by treatment group ... 66
TABLE 5.4. Frequency of screening mammograms and screen-detected breast cancer over 2 years in the new user cohort, stratified by time interval before and after initiation ... 67
TABLE 5.5. Characteristics at baseline among metformin and sulfonylureas initiators in the cancer-free cohort. ... 68
TABLE 5.6. Proportions of women receiving at least one screening test within 2-year window of 12 months before and after initiation. ... 70
TABLE 5.8. Frequency of screening mammograms and screen-detected breast cancer over 12 months after initiation in the cancer-free cohort, stratified by receipt of screening mammography within 12 months prior to initiation. ... 73 TABLE 5.9. Frequency of total breast cancer over 12 months after initiation in the
LIST OF FIGURES
FIGURE 4.1. The flowchart of the study population ... 46 FIGURE 4.2. Cumulative Incidence of Breast Cancer by Treatment Cohort. ... 47 FIGURE 4.3. PS weighted hazard ratios (95% CI) over time comparing metformin
initiators vs sulfonylureas initiators since follow-up, in as treated and
intention to treat analyses. ... 48 FIGURE 4.4. Propensity Score weighted hazard ratios (95% CIs) comparing metformin
initiators vs sulfonylureas initiators, stratified by age group, race, and baseline use of statins, in as treated and intention to treat analyses. ... 49 FIGURE 5.1. The flowchart of study cohort. ... 75 FIGURE 5.2. Allocation of mammograms by screening versus diagnostic purpose in the
new user cohort. ... 76 FIGURE 5.3. Allocation of mammograms by screening versus diagnostic purpose in
the cancer-free cohort. ... 77 FIGURE 5.4. Algorithm for identifying incident breast cancer detected at screening
mammography in the new user cohort. ... 78 FIGURE 5.5. Algorithm for identifying incident breast cancer detected at screening
mammography in the cancer-free cohort. ... 79 FIGURE 5.6. Proportions of women receiving a screening mammogram over time
by treatment group, in the new user cohort. ... 80 FIGURE 5.7. Proportions of women receiving a screening mammogram over time
LIST OF ABBREVIATIONS
ACEI Angiotensin-Converting-Enzyme Inhibitor ADOPT Diabetes Outcome Progression Trial
AMPK Adenosine Monophosphate-Activated Protein Kinase-Activated Protein Kinase
AT As-Treated Analysis
BMI Body Mass Index
CI Confidence Interval
CPRD Clinical Practice Research Datalink
HR Hazard Ratio
IQR Interquartile Range
ITT Intention-To-Treated Analysis
MCBS Medicare Current Beneficiary Survey
MET Metformin
mTOR Mammalian Target 0f Rapamycin
OR Odds Ratio
PS Propensity Score
PSC Propensity Score Calibration PSEP Error-Prone Propensity Score PSGP Gold-Standard Propensity Score
RD Risk Difference
RECORD Rosiglitazone Evaluated For Cardiovascular Outcomes and Regulation Of Glycaemia in Diabetes Trial
SMR Standardized Morbidity Ratio
THIN The Health Improvement Network Database TNBC Triple Receptor-Negative Breast Cancer
TZD Thiazolidinediones
CHAPTER 1. STATEMENT OF SPECIFIC AIMS
Several observational studies have shown the beneficial effect of metformin on the risk of breast cancer [1-5]. A meta-analysis of seven observational studies found a decreased risk of breast cancer with metformin [Odds Ratio (OR): 0.83; 95% Confidence Interval (CI): 0.71-0.97)] and a slightly stronger association with longer metformin use (>3 years) (OR: 0.75; 95% CI: 0.62-0.91) [6]. However, methodological flaws exist in most studies, including the lack of well-defined active comparator group, bias from immortal-time in cohort studies, and from time-window bias in case-control studies [7]. Furthermore, little is known about unmeasured confounding by body mass index (BMI) and smoking status and whether there is differential detection for breast cancer between metformin and sulfonylureas initiators in metformin-breast cancer studies.
The following specific aims were addressed in this research:
Aim 1a: To estimate the relative risk for breast cancer in metformin initiators, compared with sulfonylureas initiators, using data from Medicare Beneficiaries.
Hypothesis: We hypothesize that metformin does not affect the risk of breast cancer among older women.
Rationale: Among several observational studies indicating benefits of metformin on breast cancer, most were affected by time-related bias (i.e., immortal time bias, time window bias, and lag-time bias). These biases would lead to an apparent protective effect in the absence of a real effect or magnify any potential beneficial effect of metformin on cancer incidence [7]. Thus, the observed reduction in the risk of breast cancer associated with metformin is likely attributed to time-related bias.
Aim 1b: To examine the impact of BMI and smoking status on physicians’ choice of metformin versus sulfonylureas, using data from the Medicare Current Beneficiary Survey, and to quantify unmeasured confounding by BMI and smoking status on metformin-breast cancer association.
Hypothesis: We hypothesize that BMI and smoking status affect physician decision to prescribe metformin versus sulfonylureas to diabetic patients.
receive metformin than a clinical alternative, sulfonylureas. Therefore, given that both factors are associated with increased risks of breast cancer in postmenopausal women [23, 25, 45], unmeasured BMI and smoking status may confound the association between metformin and breast cancer risk.
Aim 2: To compare the probability of receiving screening mammography and the incidence of screen-detected breast cancer between metformin and sulfonylureas initiators in the 12 months before and after initiation, using data from Medicare Beneficiaries
Hypothesis: We hypothesize that metformin initiators are more likely to receive screening mammography than sulfonylureas initiators in the 12 months pre- and post-initiation.
CHAPTER 2. REVIEW OF LITERATURE
I. Metformin
Metformin is an oral anti-hyperglycemic agent of the biguanides class and is the first line treatment for type 2 diabetes mellitus [10]. Metformin can lower hyperglycemia by inhibiting glucose production in the liver (hepatic gluconeogenesis), decreasing the absorption of glucose in the intestine, and increasing insulin sensitivity [11]. Compared with other anti-hyperglycemic drugs, metformin has low risks of hypoglycemia and minor side effects. The common side effects of metformin include stomach or abdominal discomfort, diarrhea, muscle pain or weakness, and decreased appetite. Additionally, metformin may induce lactic acidosis, which is a rare but severe adverse effect and usually occurs in diabetic patients with impaired renal function [12].
Metformin has been shown to help facilitate weight loss [8, 9] and to effectively delay or prevent developing diabetes in patients with pre-diabetes [8, 9, 13, 14], identified by impaired fasting glucose, impaired glucose tolerance, or elevated HbA1c according to American Diabetes Association [10]. In addition to treatment of hyperglycemia, metformin is also used to treat polycystic ovary syndrome [15, 16]. Some studies also suggest that metformin may have beneficial effect on prevent the cardiovascular disease [17-19].
preclinical and clinical studies has suggested that metformin has anti-tumor ability and may reduce incidence and mortality of breast cancer [23, 24].
II. Plausible mechanism for antitumor action of metformin
The mechanism of metformin action on breast cancer is unclear but it is generally believed to involve both direct and indirect action through mediating adenosine monophosphate-activated protein kinase-monophosphate-activated protein kinase (AMPK). AMPK is an enzyme which plays an important role in cellular energy homeostasis. Metformin can activate AMPK to directly inhibit cellular protein synthesis and cell proliferations in both normal and cancer cells, through suppression of the mammalian target of rapamycin (mTOR) pathway. mTOR is a type of protein which regulates protein synthesis and cell growth/proliferation. On the other hand, activation of AMPK also can inhibit transcription of key gluconeogenesis genes in the liver and stimulate glucose uptake in muscle; as a result, metformin can reduce the levels of circulating glucose and insulin and can increase the insulin sensitivity, thus indirectly inhibiting carcinogenesis and cancer prognosis [25, 26].
III.Clinical Studies of the effect of metformin on the risk of breast cancer
cancer, compared with no use of metformin [Odds Ratio (OR): 0.42; 95% Confidence Interval (CI): 0.21-0.87]. A similar but weaker beneficial effect was observed in one Danish case-control study and one UK cohort study [2, 4]. The case-control study nested in women with type 2 diabetes in Danish Medical Registries found that metformin use was associated with a reduced risk of breast cancer (OR: 0.81; 95% CI: 0.63-0.96) [2]. In a cohort study of the Diabetes Audit and Research in Tayside Study, Scotland, metformin user had a decreased risk of breast cancer compared with nonusers of metformin matched on the year of diabetes diagnosis [Hazard Ratio (HR): 0.60; 95% CI: 0.32-1.10] [4]. However, among older women with diabetes and receiving treatment of glargine or nonglargine insulin enrolled in Medicare, metformin was shown to increase the risk of breast cancer compared with no use of metformin (HR: 1.28; 95% CI: 1.05-1.57) [28].
with a median treatment and follow-up time of 4.0 years, six (1.0%) and six (0.9%) patients developed breast cancers among 590 patients randomized to metformin compared with 645 patients randomized to rosiglitazone, with a HR of 1.09 (95% CI: 0.35-3.41). In the RECORD study patients on sulfonylureas were randomized to metformin or Rosiglitazone and treated and followed over 5.5-years. Of the 554 patients randomized to metformin, 8 (1.4%) developed breast cancer compared with 4 (0.7%) among 562 patients randomized to rosiglitazone, resulting in a HR of 2.04 (95% CI: 0.61-6.83).
Additionally, one study examined the risk of breast cancer associated with metformin use among postmenopausal women from Women Health Initiative (WHI) clinical trials with an average of 11.8 years follow-up [3]. Diabetic women initiating metformin had a decreased risk of breast cancer compared with non-diabetic women (HR: 0.75; 95% CI: 0.57-0.99). The breast cancer risk in metformin users has been also examined over time [32]. Metformin users showed a pattern of decreasing breast cancer over time. The incidence rate ratio was 0.73 (95% CI: 0.56-0.96) during months 6-24, 0.91 (95% CI: 0.70-1.17) during months 25-60, and 0.82 (95% CI: 0.61-1.10) during months 60+, compared with the initial 6 months after starting treatment.
with no use of metformin suggest more beneficial effect than those comparing metformin with other anti-diabetics drugs.
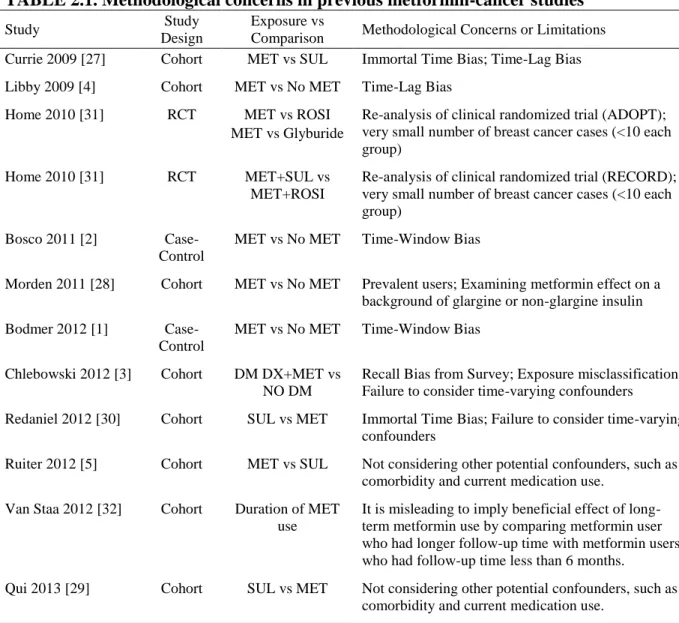
IV.Methodological concerns on available literature
beneficial effects of long-term metformin use by comparing metformin user who had longer follow-up time with metformin users who had follow-up time less than 6 months [32]. Characteristics between patients with long follow-up time and those with short follow-up time might be different. For example, healthier patients are likely to have longer follow-up times and maybe less likely develop cancer. Lastly, confounding is not well controlled for in some studies, even in the studies with active comparison groups [5, 29]. Although both metformin and sulfonylureas are used for diabetes treatment, patient characteristics for these two drugs may differ, such as comorbidity and concurrent medication use.
Apart from the methodological flaws and limitation described above, unmeasured confounding by body mass index (BMI) and smoking status and detection bias are another problem which has not been addressed in metformin-cancer studies. BMI and smoking are positively associated with the risk of several types of cancers. For breast cancer, obese women after menopause have about 20% higher risk of developing breast cancer than women with normal weight [34], but it remains controversial whether smoking affects breast cancer incidence [35-37]. Given the beneficial effect of metformin on weight loss and a heated discussion about benefits of metformin on cancer, physicians may preferably prescribe metformin to overweight or obese patients, as well as smokers [10]. Thus, the association between metformin and breast cancer could be confounded by BMI and smoking status. Some studies controlled for BMI and smoking status. The potential magnitude of confounding by BMI and smoking has not been evaluated in any study, however.
recommended as the first line treatment for diabetes, except for patients with chronic kidney disease [10]. Therefore, physicians who prescribe metformin as initial treatment rather than any other anti-diabetic drug follow the guidelines and might also be more likely to perform regular examinations or recommended cancer screening tests for older patients who are at high risk for several types of cancers compared with their peers who do not. Differential detection before initiation could reduce cancer incidence by early diagnosis and removal of (asymptomatic or pre-clinical) cancer. On the other hand, differential detection after initiation may lead to an increased risk immediately following treatment initiation. This speculation could be supported in breast cancer by the UK study [32]. Among metformin users aged 40 or over in the CPRD, the breast cancer risk is higher in the first 6 months than later. Unfortunately, no study has attempted to address this issue.
Due to concerns about the important time-related bias and potential confounding in metformin-breast cancer studies, the effect of metformin on the risk of breast cancer remains unresolved [7]. Thus, we conducted a cohort study to investigate the effect of metformin on the risk of breast cancer in postmenopausal women using a state of the art nonexperimental study design, and to assess the impact from unmeasured confounding by BMI and smoking status as well as detection bias, using data from a US wide sample of Medicare beneficiaries.
V. Significance
VI.Tables
TABLE 2.1. Methodological concerns in previous metformin-cancer studies
Study Study
Design
Exposure vs
Comparison Methodological Concerns or Limitations Currie 2009 [27] Cohort MET vs SUL Immortal Time Bias; Time-Lag Bias
Libby 2009 [4] Cohort MET vs No MET Time-Lag Bias
Home 2010 [31] RCT MET vs ROSI MET vs Glyburide
Re-analysis of clinical randomized trial (ADOPT); very small number of breast cancer cases (<10 each group)
Home 2010 [31] RCT MET+SUL vs MET+ROSI
Re-analysis of clinical randomized trial (RECORD); very small number of breast cancer cases (<10 each group)
Bosco 2011 [2] Case-Control
MET vs No MET Time-Window Bias
Morden 2011 [28] Cohort MET vs No MET Prevalent users; Examining metformin effect on a background of glargine or non-glargine insulin
Bodmer 2012 [1] Case-Control
MET vs No MET Time-Window Bias
Chlebowski 2012 [3] Cohort DM DX+MET vs NO DM
Recall Bias from Survey; Exposure misclassification; Failure to consider time-varying confounders
Redaniel 2012 [30] Cohort SUL vs MET Immortal Time Bias; Failure to consider time-varying confounders
Ruiter 2012 [5] Cohort MET vs SUL Not considering other potential confounders, such as comorbidity and current medication use.
Van Staa 2012 [32] Cohort Duration of MET use
It is misleading to imply beneficial effect of long-term metformin use by comparing metformin user who had longer follow-up time with metformin users who had follow-up time less than 6 months.
Qui 2013 [29] Cohort SUL vs MET Not considering other potential confounders, such as comorbidity and current medication use.
CHAPTER 3. METHODS
I. Overall Strategy
II. Data Source
1. Medicare Beneficiaries
Medicare is funded by United States (US) federal government and is administered by the Center of Medicare and Medicaid Services. Medicare provides medical coverage for citizens aged 65 years and older, with certain disabilities, or with End-Stage Renal Disease (ESRD). In 2010, 47 million persons were enrolled in Medicare, of whom 8 million were disabled persons or persons with ESRD under age 65 [40]. The Medicare database is composed of three types of data files: Part A (hospital claims), Part B (outpatient physician services), and Part D (dispensed prescription claims), capturing patient information including demographics, diagnosis and procedure codes, along with claims for dispensed prescriptions. All clinical data are recorded by the Classification of Disease 9th Revision (ICD-9), Current Procedural Terminology-4 (CPT-4) codes, and the Healthcare Common Procedure Coding System (HCPCS). Dispensed prescriptions are coded using National Drug Codes (NDCs). In this study, we identified our study cohort from twenty percent of the entire fee-for-service Medicare population.
2. Medicare Current Beneficiary Survey (MCBS)
of data completeness [41-43]. The MCBS includes two modules: Access to Care, and Cost and Use Files, and we used the module of Cost &Use Files in this study.
III.Study Population
1. Study Cohort from Medicare Beneficiaries
Study cohort for Aim 1a (Breast Cancer Risk)
Eligibility requirements for women to be included in this study were: (1) continuous enrollment in Medicare Part A, B, and D for at least 6 months prior to treatment initiation during the period from 2007 to 2011, (2) age of 65 years or more at treatment initiation, (3) new users of metformin or sulfonylureas with at least 1 refill within 90 days after end supply of the index prescription, and (3) free of kidney disease and any type of cancers except for non-melanoma skin cancer within 6 months prior to treatment initiation. New use was defined as not receiving any anti-diabetic treatment within 6 months prior to initiation of metformin or sulfonylureas, including oral and injection anti-diabetic drugs and insulin or its analogues. Patients were categorized into the cohorts of metformin or sulfonylureas according to the first prescription (index prescription). To increase the likelihood that patients are actually exposed to the drug, eligible new users were required to have at least one refill of index prescription within 90 days after end of drug supply of index prescription. The date of the first refill was defined as the index date.
rarely. Thus, given our study cohort consisting of women aged 65 and over, all initiators of metformin or sulfonylureas can be considered as truly having type 2 diabetes mellitus.
Study cohort for Aim 2 (Screening Mammography)
To address different effects due to differential detection pre- and post-initiation, we included two study cohorts in the study of Aim 2. One was the new user cohort which was used to examine use of screening mammography over a two-year window of 12 months pre- and post-initiation, primarily focusing on the period of 12 months prior to initiation. The other study cohort was the cancer-free cohort mimicking a cohort study on breast cancer incidence, which only examined use of screening mammography in 12 months after initiation.
A study examining cancer incidence commonly requires a cancer-free study population. Thus, we had the cancer-free cohort to correctly assess receipt of screening mammography within 12 months following treatment initiation. This cancer-free cohort was a subgroup of the new user cohort, which included eligible initiators without a diagnosis of any cancer except for non-melanoma skin cancer within 12 months prior to initiation.
2. Study Cohort from Medicare Current Beneficiary Survey (MCBS)
To address the specific aim 1b (Unmeasured Variables), we conducted an external validation study using data from MCBS 2006-2009 panels. We identified new users of metformin or sulfonylureas of both genders from all MCBS participants, using data from the file of Prescribed Medicine Events in MCBS Cost & Use files (equivalent to Medicare Part D prescription files). The number of eligible patients in MCBS was expected small, thus initiation was defined by requiring only one prescription and new use was defined as no prescription for metformin or sulfonylureas in 6 month prior to initiation of monotherapy of metformin or sulfonylureas.
IV.Variables of Interests
1. Variables of Interests for Specific Aim 1a (Breast Cancer Risk)
Exposure and Follow-up
Exposure was defined as metformin or sulfonylureas according to dispensed prescription and its refill claims in Medicare Part D.
cancer which has a long preclinical phase, we incorporated the assumptions of induction and latency periods of 180 days each in the analysis. In AT approach, follow-up started on 180 days after the index date, and ended with the earliest of the following events: 180 days after augmentation or discontinuation of treatment, any cancer diagnosis except for non-melanoma skin cancer, death, end of enrollment in Medicare part D for greater than 1 month, or end of study (December 31st, 2011). Augmentation was defined as a subsequent addition of other anti-diabetic drugs to index prescription. Treatment discontinuation was defined as no further refill within the days of supply plus a 90-day grace period. Secondly, ITT analysis would follow-up patients from 180 days after the index date and until the date of any cancer diagnosis except for non-melanoma skin cancer, death, or end of study, irrespective of any treatment discontinuation or treatment change.
Outcome
The outcome was diagnosis of incident breast cancer during follow-up, including both
in situ and invasive breast cancer. The definition for cancer event was at least two diagnoses of breast cancer on different dates within 60 days. The date of the first diagnosis was defined as outcome date. This algorithm has been validated in the Medicare data [44].
2. Variables of Interests for Specific Aim 1b (Unmeasured Variables)
Exposure
<30 as overweight; (3) ≥30 as obese, according to WHO criteria [45]. Smoking status was considered as a binary variable (never and ever smoker). Missing data on weight, height, and smoking status are possible in MCBS data, but was uncommon (< 5%).
Outcome
In the validation study of MCBS, the outcome was initiation of metformin, compared with initiation of sulfonylureas. Definition has been described above.
3. Variables of Interests for Specific Aim 2 (Screening Mammography)
Screening Mammography
We used the following the Healthcare Common Procedure Coding System (HCPCS) codes to select all mammograms for the study cohort: G0202-G0205, 76091-76092, 77051-77052, and 77056-77057. Mammograms were further classified as screening versus diagnostic test based on a claims-based algorithm [67]. Briefly, mammograms were considered as screening test if they were coded as screening mammography without a previous mammogram within prior 9 months and without any breast cancer diagnosis in the prior year. This algorithm has been validated in Medicare claims with a high positive predictive value (PPV) of 94.9% [67].
Screen-Detected Breast Cancer
diagnosis within 123 days post-mammogram and a breast-directed surgery within a year following the diagnosis, or by a diagnosis of carcinoma in-situ within 286 days post-mammogram with a subsequent post-mammogram within 82 days following the diagnosis. The detail of this algorithm and the results were shown in Supplemental Figures S4-S5. To evaluate the performance of screening mammography in our cohorts, we calculated the screening detection rate for breast cancer by dividing the number of screen-detected breast cancers by the number of screening mammograms.
Incident Breast Cancer
In the cancer-free cohort, any incident breast cancer during 12-month follow-up was another outcome of interest, irrespective of whether it was detected by screening or due to symptoms. To be similar to the Fenton algorithm, we required a breast-directed surgery within a year following a breast cancer diagnosis code, including invasive and carcinoma in situ, to ascertain the breast cancer case.
V. Confounding Control
Relevant to Specific Aims 1a (Breast Cancer Risk) and 1b (Unmeasured Variables) of the proposed study, all covariates were defined based on available information within the 6-month period prior to and on the index date. Covariates of interest include:
(1) Demographics: Age in years (continuous variable), Gender (female or male), Race (White, Black, Others).
Kidney Disease (CKD), Acute Kidney Injury (AKI), Ischemic Heart Disease, Hypertension, Osteoporosis. All co-morbidity variables were categorized into binary variables (Yes or No), defined as at least one diagnosis code.
(3) Medications: Estrogen, Progestin, Statins, Bisphosphonates, ACE inhibitors, ARBs, Beta Blockers, Antidepressant, Digoxin, Oral Contraceptives, Calcium Channel Blockers, Cholesterol Absorption Inhibitor, Loop Diuretics, non-Loop Diuretics. All medication variables were categorized into binary variables (Yes or No), defined as at least one prescription or refill records.
(4) Healthcare System Use: Number of Hospitalization, Days of Hospitalization, Number of Physician Visit, Number of Emergency Room Visit, Number of Mammography Exams, Number of Lipid Tests. All healthcare system use variable were treated as both continuous variables and categorical variables.
We applied propensity score (PS) methods to control potential confounding [46]. For each patient, the probability of receiving metformin versus sulfonylureas was estimated by using a logistic regression model which included all covariates as independent variables, as known as estimated propensity score (EPS). We implemented the standardized mortality or morbidity ratio (SMR) weighting method to balance two cohorts on covariates at baseline. In SMR weighting method, we controlled for all these covariates by standardizing to their distribution in the metformin initiators using weights of 1 for metformin initiators and the odds of propensity score for sulfonylureas initiators [47].
VI.Statistical Analysis
All analyses were performed with the SAS software, 9.3 version.
1. Analyses to address Specific Aim 1a (Breast Cancer Risk)
We began with descriptive analyses of study cohorts by variables listed in confounding control, and repeated with adjustment of SMR weighting to examine the balance between two cohorts after controlling confounders.
The relative risk of breast cancer comparing metformin initiators to sulfonylureas initiators was initially examined with AT approach as the primary analyses, and then repeated with ITT approach as the secondary analyses. For each cohort, we calculated incidence rates of breast cancer per 100,000 person-years and use Kaplan-Meier methods to plot cumulative incidence of breast cancer. A Cox proportional regression models was used to estimate the crude and adjusted hazard ratios (HRs) of breast cancer and their corresponding 95% confidence intervals (CIs). The proportional hazard assumption was assessed by an addition of an interaction term between cohort and log survival time and by plotting –ln(ln(estimated survivor function)) as a function of time on the logarithmic scale. To explore the trend of hazard ratio over time, we further estimated hazard ratios for sequential 6-month intervals since treatment initiation.
affect the incidence of breast cancer, a recent observational study of a large national cohort showed that statins may significantly improve cancer mortality after diagnosis of breast cancer [52]. Given the possible chemopreventive effect from statin on breast cancer, we evaluated the risk of breast cancer associated with metformin in strata based on presence or absence of statin prescription at baseline (i.e., defined in 6 months prior to treatment initiation).
Several sensitivity analyses were pre-planned.
(1) To evaluate the robustness of the assumptions of induction and latency periods made in the study, the main analysis was repeated with various lengths of time for the induction period ranging from 0 to 365 days and for the latency period ranging from 0 to 730 days.
(2) Six-month washout period may not be long enough to successfully capture new users and to accurately assess covariates at baseline. Thus, we repeated the study in which increases the washout period for new use and covariate assessment to 12 months.
(3) Carcinoma in situ is an early form of cancer and is highly possible to transform into invasive cancer but not necessarily. Given greater clinical interests in invasive carcinoma than carcinoma in situ, we further restricted the outcome of interest to invasive breast cancer only.
(5) Due to under-coding of renal disease, we conducted the analyses including prior renal disease and excluding only those patients with severe renal disease (i.e., chronic kidney disease stage 4 and 5).
(6) Given the unresolved concerns that sulfonylureas may increase the risk of breast cancer, we also conducted sensitivity analyses of using two comparator groups: (1) new users of Thiazolidinediones (TZDs) or Incretins; (2) diabetic patients who started treatment of angiotensin-converting-enzyme inhibitors (ACE inhibitors) and did not receive any prescription of anti-diabetic drugs. ACE inhibitors were chosen because of the following reasons. First, the older persons have a high prevalence of hypertension. Secondly, ACE inhibitors are considered as one of the first line treatment in hypertension. Patients starting treatments with ACE inhibitors are less likely to have severe hypertension, thus patient characteristics may not be heavily weighted in cardiovascular diseases, compared with metformin initiators. Lastly, hypertension is not a risk factor for breast cancer and no evidence shows that ACE inhibitors are associated with an altered risk of breast cancer.
2. Analyses to address Specific Aim 1b (Unmeasured Variables)
In this cross-sectional study, we calculated the prevalence of variables of interest by study cohort, and used a logistic regression model to estimate odds ratio (OR) of receiving metformin versus sulfonylureas and their corresponding 95% confidence intervals. Analysis was adjusted in a multivariable model, as described in the section of Confounding Control.
to further correct the effect estimates in the main study using propensity score calibration (PSC).[53] In line with our main study (female cohort), we use data from women only in the validation study. We quantified these associations independent of other covariates, fitting propensity score model equivalent to the one in the main study as far as possible (the number of initiators may limit the number of covariates that can be included in PS models in the validation study).
To implement PSC, two PSs were estimated within the MCBS data: (1) the error-prone PS (PSEP, MCBS) based on the same variables used in the main study, and (2) the gold-standard PS
(PSGS, MCBS) based on not only the same variables in the main study but also additional
unmeasured variables (i.e., BMI and smoking status). We fit a model for the simple linear regression of PSGS, MCBS on PSEP, MCBS and treatment (Equation 3.1). Then, based on the estimated parameters from this model, we imputed a new PS (considered as “Gold-standard”,
PSGS, main) with the original PS (considered as “error-prone”, PSEP, main) in the main study. The
association of metformin-breast cancer was estimated in a Cox model, adjusted by SMR weighting.
𝑃𝑆𝐺𝑆 = 𝛽0+ 𝛽1(𝑃𝑆𝐸𝑃) + 𝛽2(𝑇𝑟𝑒𝑎𝑡𝑚𝑒𝑛𝑡) (Equation 3.1)
3. Analyses to address Specific Aim 2 (Screening Mammography)
to Month 12 (after initiation), respectively. Plots of frequency by time interval were used to visually compare the temporal trends of each event by treatment. Incident breast cancer detected at screening was calculated over 12-monthly intervals, given expected small numbers. We estimated risks and risk differences (RDs) and their 95% CIs of each event during each time interval comparing metformin to sulfonylureas initiators.
CHAPTER 4. BREAST CANCER RISK IN OLDER WOMEN INITIATING METFORMIN VERSUS SULFONYLUREAS
I. Introduction
Breast cancer is the most common cancer and is the second leading cause of cancer death for women in the United States . The cost of breast cancer care in 2010 was estimated at 16.5 billion dollars in US, the highest among all cancer sites [55]. Diabetes increases breast cancer risk by 20-40% in women [56]. As the first-line treatment for type 2 diabetes [10], metformin has received much attention due to its potential beneficial effect on cancer incidence and outcomes, in particular, on breast cancer [20-22].
Body mass index (BMI) and smoking may confound the metformin-breast cancer association, but were rarely assessed in previous studies. BMI and smoking are risk factors forbreast cancer in postmenopausal women [34, 36, 58]. Given weight loss and potential anti-cancer benefits of metformin, physicians may preferably prescribe metformin to overweight or obese patients, as well as smokers. Thus, unmeasured confounding by BMI and smoking is of concern and merits investigation although it would not lead to a spurious protective effect.
Observational studies are useful to evaluate drug safety and effectiveness in real world setting, as well as for hypothesis generation [59, 60]. If incorrectly designed, however, they can suffer from various types of biases leading to spurious results. For example, observational findings on benefits of statins in patients with COPD were recently disproved by a randomized trial [61]. The discordance between observational studies and randomized trials is often portrayed as being the results of a fatal flaw inherent to observational studies, but such a view ignores the fact that not all observational studies are created equal. Observational studies need to be designed using rigorous methods to reduce the potential for bias. Our objective was to investigate whether metformin reduces the risk of breast cancer in a large, nationally representative older population in the US, by conducting a state-of-the art new user cohort study with an active comparator.
II. Methods
Study Population
Initiation was defined as not receiving any anti-diabetic treatment within 6 months prior to initiation of monotherapy with metformin or sulfonylureas and having ≥1 refill within 90 days after the end of days-supply of the first prescription. The date of the first refill was defined as the index date. Patients were excluded if they had a prior diagnosis of renal disease or cancer during the 6 months before the index date. Patients with renal disease were excluded because metformin is contraindicated in these patients [10]. The flowchart of study population is shown in Figure 4.1.
Follow-up for Breast Cancer
The outcome of interest was a diagnosis of incident breast cancer during follow-up, including both in situ and invasive breast cancer, identified by having at least two ICD-9 diagnosis codes for breast cancer on different dates within 60 days. The date of the first diagnosis was used to define the outcome date. This algorithm has been previously validated in a Medicare population [44].
within the days of supply plus a 90-day grace period. Secondly, the ITT analysis followed patients from 180 days after the index date and until the date of any cancer diagnosis except for non-melanoma skin cancer, death, or end of study, irrespective of any treatment change or discontinuation.
Confounding control
We used propensity scores (PSs) to control measured confounding [46]. For each patient, the probability of receiving metformin vs sulfonylureas was estimated using a logistic regression model, which included demographic and clinical variables that we identified as potential confounders or risk factors for breast cancer. All covariates were defined based on available information during the 6-month period prior to initiation. We standardized the distribution of these covariates to that of the metformin initiators using weights of 1 for metformin initiators and the odds of PS for sulfonylureas initiators [47].
Statistical Analysis
Several sensitivity analyses were pre-planned. First, given the unresolved concerns whether sulfonylureas have effect on breast cancer risk, we compared the risk of breast cancer in new users of metformin vs two different active comparator groups: (1) new users of thiazolidinediones (TZDs) or incretins, both of which are also oral hypoglycemic agents; (2) diabetic patients who initiated angiotensin-converting-enzyme inhibitors (ACEI) without prior use of any anti-diabetic drugs. Secondly, to minimize the potential misclassification in defining treatment use during follow-up and diabetic patients, we repeated the main study with a longer grace period of 180 days and restricting to new users who had a diagnosis code for diabetes within 6 months before initiation, respectively. Due to undercoding of renal disease, we conducted the analyses including prior renal disease and excluding only those patients with severe renal disease (i.e., chronic kidney disease stage 4 and 5). Additionally, we restricted the outcome of interest to invasive breast cancer only. Lastly, to evaluate the robustness of the assumptions of induction and latency periods, the main analysis was repeated while varying the induction period from 0 to 365 days (for both AT and ITT analysis) and the latency period from 0 to 730 days (for AT analysis).
External Validation Study
height, weight, and self-reported smoking status from the MCBS Cost & Use module in the same year of initiation. BMI was calculated by weight (kilogram) divided by height (meter) squared, and was treated as a continuous variable as well as a categorical variable (<25 as normal; ≥25 and <30 as overweight; and ≥30 as obese) . Individual smoking status was grouped into never and ever smoker. History of comorbidity and co-medication at baseline were retrieved from the linked Medicare claims data.
We used multivariable logistic regression models to estimate odds ratios (ORs) for the association of BMI and smoking with the initiation of metformin vs sulfonylureas, controlling for those covariates also controlled for in the main study. We then implemented propensity score calibration (PSC) to correct the effect estimates in the Medicare study for confounding by BMI and smoking [53, 62].
III.Results
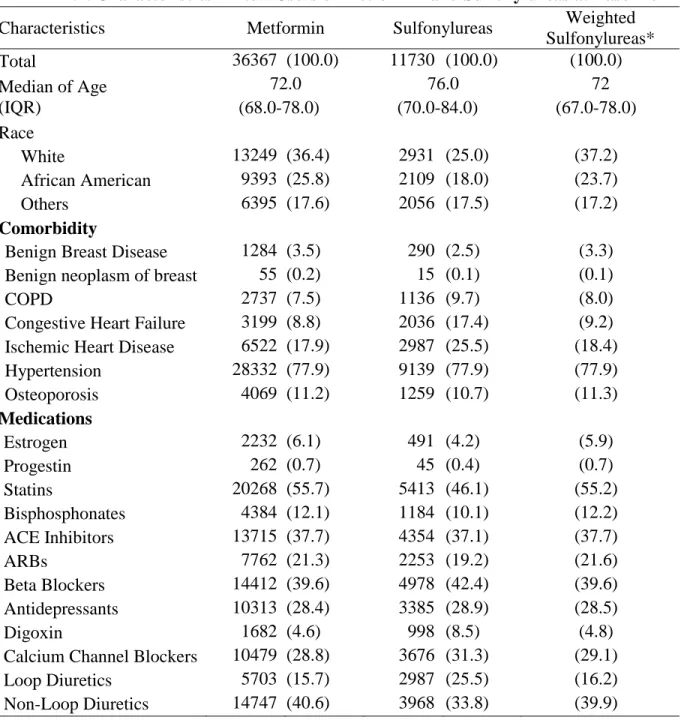
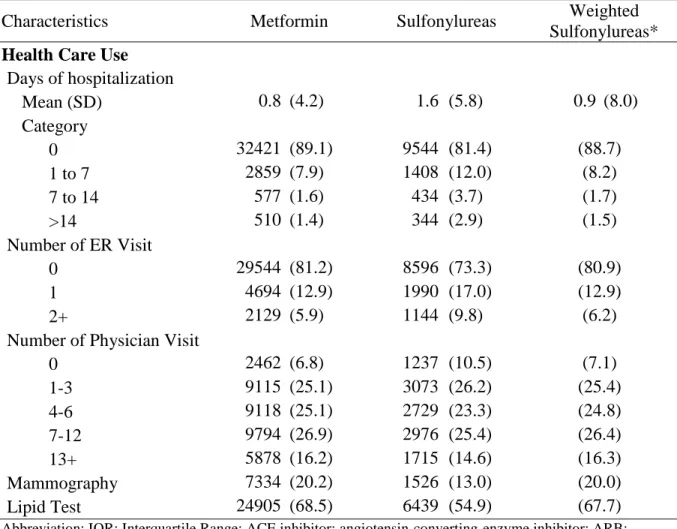
We identified 36,367 and 11,730 women who initiated metformin or sulfonylureas who met our inclusion criteria, respectively. Compared with metformin initiators, sulfonylureas initiators were older, had more cardiovascular disease (i.e., congestive heart failure and ischemic heart disease), and were more likely to have been admitted to a hospital and visited an emergency room in the 6 months prior to the index date (Table 4.1). Metformin initiators were more likely to have received a prescription for statins, a mammogram or a lipid test compared with sulfonylureas initiators. The characteristics of the women initiating sulfonylureas became very similar to those initiating metformin after PS weighting.
sulfonylureas initiators (Table 4.2). The crude incidence rates of breast cancer per 100,000 person-years were 640 (95% CI: 567 to 723) and 615 (95% CI: 491 to 771) in metformin and sulfonylureas initiators, respectively. After PS weighting, the incidence rate was 607 (95% CI: 549 to 670) in sulfonylureas initiators and stayed the same in metformin initiators. The weighted HR comparing metformin with sulfonylureas initiators was 1.08 (95% CI: 0.81 to 1.44) (Table 2). The effect estimate from the ITT analysis was unchanged (adjusted HR: 1.08; 95% CI: 0.86 to 1.35). There was no difference in the cumulative incidence of developing breast cancer by treatment group (Figure 4.2). In Figure 4.3, we examined the risk of breast cancer associated with metformin stratified by duration of treatment after initiation. No decreasing trend was observed after initiation and HR estimates were all close to the null.
Figure 4.4 shows the breast cancer risk for metformin vs sulfonylureas initiators across several subgroups. There was no indication of a protective effect across the age groups and in either subgroup defined by prior statin use. However, we observed a possibly reduced risk for breast cancer associated with metformin in African American women (HR: 0.61; 95% CI: 0.30 to 1.25, for AT) but the confidence interval is wide due to the small number of events. The results were similar in the AT and ITT analyses. We also conducted several sensitivity analyses, showing that metformin was not associated with a lower risk of breast cancer consistently through all scenarios (Tables 4.3, 4.4 and 4.5).
other differences. After PSC, the HR for breast cancer comparing metformin vs sulfonylureas was 1.05 (95% CI: 0.80 to 1.39) and 1.05 (95% CI: 0.84 to 1.30) based on AT and ITT analyses, respectively.
IV.Discussion and Conclusions
In this large, population-based study using a state-of-the art new user, active comparator cohort design we found that older women initiating metformin did not have a lower risk for breast cancer than women initiating a therapeutic alternative. Similar results were observed when comparing metformin initiators to initiators of TZD/incretin or to diabetic initiators of ACEI. Despite our observation of a possible tendency towards a lower risk of breast cancer associated with metformin in African American women, our result of no effect was consistent across several subgroup and sensitivity analyses.
cases and controls to define exposure because cases and controls were not matched on time since onset of diabetes or since the first antidiabetic prescription in this study [63]. Among those studies not affected by time-related bias, the findings were controversial: two studies reported protective effects [3, 5] while two reported no effects [29, 30]. In a cohort study from the Netherlands, the risk of breast cancer slightly decreased in new users of metformin compared with new users of sulfonylureas (HR: 0.95; 95% CI: 0.91 to 0.98) [5]. This study included women age 18 or older, a younger study population than ours. Metformin might act differently on breast cancer between pre- and post-menopausal women. The Women Health Initiative (WHI) study found a reduced risk of invasive breast cancer associated with metformin in post-menopausal women (HR: 0.75; 95% CI: 0.57 to 0.99) [3]. Drug exposure in the WHI study was self-reported and collected through questionnaire with unequal intervals whereas our study used data on pharmacy dispensed prescriptions that provide more accurate drug exposure information. Two cohort studies showed evidence of no effect of metformin versus sulfonylureas risk of breast cancer in the UK CPRD (HR: 1.04; 95% CI: 0.79 to 1.37 [30], HR: 1.04; 95% CI: 0.83 to 1.31 [29]).
cancer negative for HER2 overexpression (HR: 0.58; 95% CI: 0.40 to 0.84), compared with overall invasive breast cancer (HR: 0.75; 95% CI: 0.57 to 0.99), despite the fact that the two CIs overlapped [3]. Our subgroup analysis is limited by the small number of breast cancers in African American women observed, thus chance is a plausible alternative explanation.
We used external information from the MCBS to quantify the unmeasured confounding by BMI and smoking on the association between metformin and breast cancer incidence. Obesity and smoking were associated with higher odds of receiving metformin vs sulfonylureas. However, these associations became weak after adjusting for other variables in the PS model, indicating a little independent effect of BMI and smoking of metformin prescribing relative to sulfonylureas and little residual confounding by BMI and smoking on the association between metformin and breast cancer incidence. This lack of effect on relative prescribing given the indication to initiate treatment with oral anti-diabetics is a direct result of the state-of-the art new user, active comparator cohort design [67]. We consistently observed no metformin-breast cancer associations after implementing PSC.
breast cancer, but we would not expect this to be differential between metformin and sulfonylureas groups. In addition, confounding by unmeasured variables may still exist. We examined the impact of two major unmeasured confounders, BMI and smoking, however, suggesting little residual confounding. Unmeasured confounding by e.g., alcohol consumption or family history of breast cancer would need to be independent of the other covariates that we controlled for. Lastly, we did not independently validate the diagnoses of breast cancer, but our algorithm based on ICD-9 codes has been validated with cancer registry data in an, albeit selected, Medicare population [44].
V. Tables and Figures
TABLE 4.1. Characteristics in New Users of Metformin and Sulfonylureas at Baseline
Characteristics Metformin Sulfonylureas Weighted
Sulfonylureas*
Total 36367 (100.0) 11730 (100.0) (100.0)
Median of Age (IQR) 72.0 (68.0-78.0) 76.0 (70.0-84.0) 72 (67.0-78.0) Race
White 13249 (36.4) 2931 (25.0) (37.2)
African American 9393 (25.8) 2109 (18.0) (23.7)
Others 6395 (17.6) 2056 (17.5) (17.2)
Comorbidity
Benign Breast Disease 1284 (3.5) 290 (2.5) (3.3) Benign neoplasm of breast 55 (0.2) 15 (0.1) (0.1)
COPD 2737 (7.5) 1136 (9.7) (8.0)
Congestive Heart Failure 3199 (8.8) 2036 (17.4) (9.2) Ischemic Heart Disease 6522 (17.9) 2987 (25.5) (18.4) Hypertension 28332 (77.9) 9139 (77.9) (77.9) Osteoporosis 4069 (11.2) 1259 (10.7) (11.3)
Medications
Estrogen 2232 (6.1) 491 (4.2) (5.9)
Progestin 262 (0.7) 45 (0.4) (0.7)
Statins 20268 (55.7) 5413 (46.1) (55.2)
Bisphosphonates 4384 (12.1) 1184 (10.1) (12.2) ACE Inhibitors 13715 (37.7) 4354 (37.1) (37.7)
ARBs 7762 (21.3) 2253 (19.2) (21.6)
Beta Blockers 14412 (39.6) 4978 (42.4) (39.6) Antidepressants 10313 (28.4) 3385 (28.9) (28.5)
Digoxin 1682 (4.6) 998 (8.5) (4.8)
TABLE 4.1. (Continued) Characteristics in New Users of Metformin and Sulfonylureas at Baseline
Characteristics Metformin Sulfonylureas Weighted
Sulfonylureas*
Health Care Use
Days of hospitalization
Mean (SD) 0.8 (4.2) 1.6 (5.8) 0.9 (8.0)
Category
0 32421 (89.1) 9544 (81.4) (88.7)
1 to 7 2859 (7.9) 1408 (12.0) (8.2)
7 to 14 577 (1.6) 434 (3.7) (1.7)
>14 510 (1.4) 344 (2.9) (1.5)
Number of ER Visit
0 29544 (81.2) 8596 (73.3) (80.9)
1 4694 (12.9) 1990 (17.0) (12.9)
2+ 2129 (5.9) 1144 (9.8) (6.2)
Number of Physician Visit
0 2462 (6.8) 1237 (10.5) (7.1)
1-3 9115 (25.1) 3073 (26.2) (25.4)
4-6 9118 (25.1) 2729 (23.3) (24.8)
7-12 9794 (26.9) 2976 (25.4) (26.4)
13+ 5878 (16.2) 1715 (14.6) (16.3)
Mammography 7334 (20.2) 1526 (13.0) (20.0)
Lipid Test 24905 (68.5) 6439 (54.9) (67.7)
Abbreviation: IQR: Interquartile Range; ACE inhibitor: angiotensin-converting-enzyme inhibitor; ARB: angiotensin receptor blockers; COPD: Chronic Obstructive Pulmonary Disease; ER: Emergency Room. * Weighted by standardizing to their distribution in metformin initiators by using weights of 1 for metformin
initiators and the odds of the estimated PS for sulfonylureas initiators. PS model includes age in years (continuous variable), race (white, black, and others), comorbidity (Yes/No; benign breast disease, benign neoplasma of breast, chronic obstructive pulmonary disease, chronic heart failure, chronic kidney disease, acute kidney injury, ischemic heart disease, hypertension, and osteoporosis), medication use (Yes/No; estrogen, progestin, statins, bisphosphonates, ACE inhibitors, ARBs, beta blockers, antidepressant, digoxin, calcium channel clockers, loop diuretics, and non-loop diuretics), and healthcare utilization (days of
40
TABLE 4.2. Incidence Rates and Hazard Ratios for Breast Cancer by Treatment Cohort
Cohort N BC
event
Follow-up Time (years) Rate per 100,000 pyrs† HR (95% CI)
Sum Median (IQR) Crude PS Weighted* Crude PS Weighted*
As-Treated Analysis
MET 36367 262 40921 0.80 (0.36-1.68) 640 (567-723) 640 (567-723) 1.04 (0.81-1.34) 1.08 (0.81-1.44) SUL 11730 76 12350 0.73 (0.33-1.55) 615 (491-771) 607 (549-670) 1.00 1.00
Intention-to-Treat Analysis
MET 36367 395 60311 1.51 (0.68-2.54) 655 (593-723) 655 (593-723) 1.04 (0.85-1.27) 1.08 (0.86-1.35) SUL 11730 127 20154 1.60 (0.70-2.63) 630 (530-750) 592 (519-675) 1.00 1.00 Abbreviation: MET: metformin; SUL: sulfonylureas; BC: breast cancer; IQR: Interquartile Range; pyrs: person-years; PS: propensity score.
*PS weighted HR were standardized to the distribution of baseline covariates in metformin initiators
41
TABLE 4.3. Sensitivity Analyses
Sensitivity Analysis Analysis Cohort N BC event
Median of Follow-up years
(IQR)
Rate per 100,000 person-years
PS Weighted HR (95% CI)*
Using initiators of
TZD/Incretin as reference
ITT MET 36397 395 1.51 (0.68-2.54) 655 (593-722) 1.08 (0.78-1.49)
TZD/DPP 4533 48 1.72 (0.75-2.77) 592 (446-786) 1.00
AT MET 36397 262 0.80 (0.36-1.68) 640 (567-722) 0.91 (0.60-1.38)
TZD/DPP 4533 27 0.61 (0.33-1.33) 629 (431-917) 1.00
Using diabetic initiators of ACEI as reference
ITT MET 18913 201 1.52 (0.69-2.55) 639 (557-734) 1.00 (0.79-1.26) ACEI 20583 209 1.58 (0.73-2.57) 598 (522-685) 1.00 AT MET 18913 114 0.68 (0.33-1.43) 608 (506-731) 0.96 (0.69-1.32)
ACEI 20583 117 0.70 (0.34-1.48) 549 (458-657) 1.00
Initiators with a prior DM diagnosis
ITT MET 32450 335 1.53 (0.70-2.56) 619 (556-689) 1.03 (0.81-1.29)
SUL 10925 119 1.63 (0.72-2.66) 629 (525-753) 1.00
AT
MET 32450 222 0.81 (0.36-1.69) 604 (530-689) 1.03 (0.77-1.39)
SUL 10925 72 0.74 (0.33-1.57) 622 (493-783) 1.00
Outcome including invasive breast cancer only
ITT MET 36442 390 1.52 (0.69-2.55) 643 (583-711) 1.05 (0.84-1.32)
SUL 11761 128 1.61 (0.71-2.64) 632 (531-751) 1.00
AT MET 36442 260 0.81 (0.36-1.68) 632 (560-714) 1.05 (0.79-1.40)
42
TABLE 4.3. (Continued) Sensitivity Analyses
Sensitivity Analysis Analysis Cohort N BC event
Median of Follow-up years
(IQR)
Rate per 100,000 person-years
PS Weighted HR (95% CI)*
Including patients with or without history of renal disease
ITT MET 38435 405 1.51 (0.68-2.53) 638 (578-703) 1.06 (0.86-1.31)
SUL 14558 149 1.53 (0.66-2.57) 611 (520-718) 1.00
AT MET 38435 269 0.80 (0.35-1.66) 627 (557-707) 1.12 (0.85-1.47)
SUL 14558 87 0.70 (0.33-1.50) 581 (471-717) 1.00
Excluding patients with history of chronic kidney disease stage 4-5
ITT MET 38251 404 1.51 (0.68-2.54) 639 (579-704) 1.05 (0.85-1.30)
SUL 13803 144 1.54 (0.67-2.59) 619 (526-729) 1.00
AT MET 38251 269 0.80 (0.35-1.66) 629 (558-709) 1.09 (0.83-1.43)
SUL 13803 85 0.71 (0.33-1.51) 595 (481-736) 1.00
Grace Period of 180 days
ITT MET 36387 397 1.51 (0.68-2.55) 657 (595-725) 1.09 (0.87-1.37)
SUL 11460 123 1.62 (0.71-2.66) 621 (520-741) 1.00
AT MET 36387 301 0.96 (0.44-1.87) 667 (596-747) 1.20 (0.90-1.59)
SUL 11460 79 0.86 (0.38-1.75) 594 (477-741) 1.00
Abbreviation: AT: as-treated; ITT: intention-to-treat; MET: metformin; SUL: sulfonylureas; TZD: Thiazolidinediones; ACEI: angiotensin-converting-enzyme inhibitors; BC: breast cancer; IQR: Interquartile Range; pyrs: person-years; PS: propensity score.
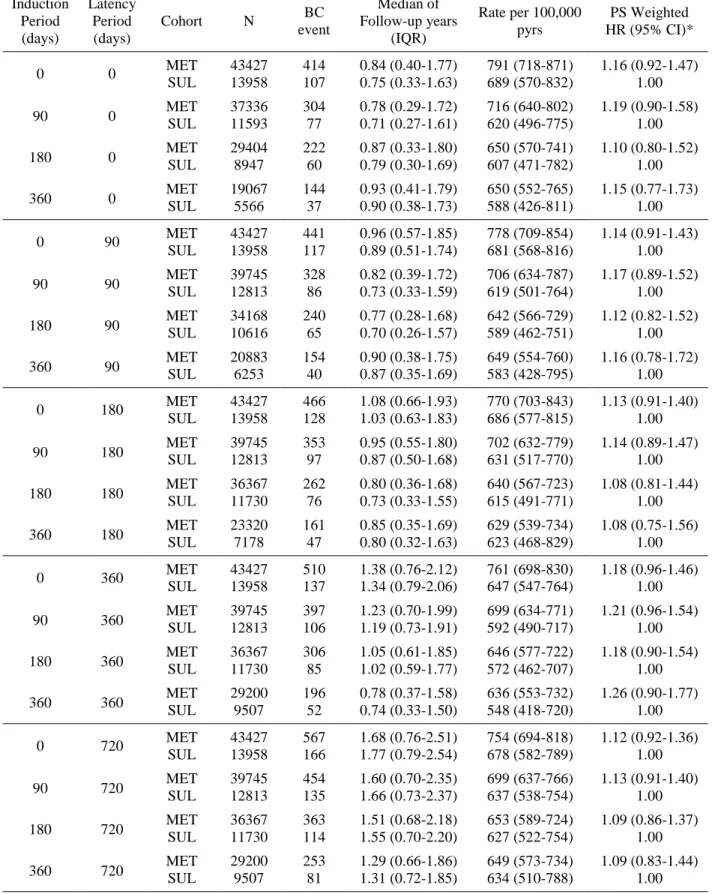
TABLE 4.4. Sensitivity Analyses for Induction and Latency Periods in As-Treated Analysis Induction Period (days) Latency Period (days)
Cohort N BC event
Median of Follow-up years
(IQR)
Rate per 100,000 pyrs
PS Weighted HR (95% CI)*
0 0 MET 43427 414 0.84 (0.40-1.77) 791 (718-871) 1.16 (0.92-1.47) SUL 13958 107 0.75 (0.33-1.63) 689 (570-832) 1.00
90 0 MET 37336 304 0.78 (0.29-1.72) 716 (640-802) 1.19 (0.90-1.58) SUL 11593 77 0.71 (0.27-1.61) 620 (496-775) 1.00
180 0 MET SUL 29404 8947 222 60 0.87 (0.33-1.80) 0.79 (0.30-1.69) 650 (570-741) 607 (471-782) 1.10 (0.80-1.52) 1.00
360 0 MET SUL 19067 5566 144 37 0.93 (0.41-1.79) 0.90 (0.38-1.73) 650 (552-765) 588 (426-811) 1.15 (0.77-1.73) 1.00
0 90 MET 43427 441 0.96 (0.57-1.85) 778 (709-854) 1.14 (0.91-1.43) SUL 13958 117 0.89 (0.51-1.74) 681 (568-816) 1.00
90 90 MET 39745 328 0.82 (0.39-1.72) 706 (634-787) 1.17 (0.89-1.52) SUL 12813 86 0.73 (0.33-1.59) 619 (501-764) 1.00
180 90 MET SUL 34168 10616 240 65 0.77 (0.28-1.68) 0.70 (0.26-1.57) 642 (566-729) 589 (462-751) 1.12 (0.82-1.52) 1.00
360 90 MET SUL 20883 6253 154 40 0.90 (0.38-1.75) 0.87 (0.35-1.69) 649 (554-760) 583 (428-795) 1.16 (0.78-1.72) 1.00
0 180 MET 43427 466 1.08 (0.66-1.93) 770 (703-843) 1.13 (0.91-1.40) SUL 13958 128 1.03 (0.63-1.83) 686 (577-815) 1.00
90 180 MET SUL 39745 12813 353 97 0.95 (0.55-1.80) 0.87 (0.50-1.68) 702 (632-779) 631 (517-770) 1.14 (0.89-1.47) 1.00
180 180 MET SUL 36367 11730 262 76 0.80 (0.36-1.68) 0.73 (0.33-1.55) 640 (567-723) 615 (491-771) 1.08 (0.81-1.44) 1.00
360 180 MET 23320 161 0.85 (0.35-1.69) 629 (539-734) 1.08 (0.75-1.56) SUL 7178 47 0.80 (0.32-1.63) 623 (468-829) 1.00
0 360 MET 43427 510 1.38 (0.76-2.12) 761 (698-830) 1.18 (0.96-1.46) SUL 13958 137 1.34 (0.79-2.06) 647 (547-764) 1.00
90 360 MET SUL 39745 12813 397 106 1.23 (0.70-1.99) 1.19 (0.73-1.91) 699 (634-771) 592 (490-717) 1.21 (0.96-1.54) 1.00
180 360 MET SUL 36367 11730 306 85 1.05 (0.61-1.85) 1.02 (0.59-1.77) 646 (577-722) 572 (462-707) 1.18 (0.90-1.54) 1.00
360 360 MET 29200 196 0.78 (0.37-1.58) 636 (553-732) 1.26 (0.90-1.77) SUL 9507 52 0.74 (0.33-1.50) 548 (418-720) 1.00
0 720 MET 43427 567 1.68 (0.76-2.51) 754 (694-818) 1.12 (0.92-1.36) SUL 13958 166 1.77 (0.79-2.54) 678 (582-789) 1.00
90 720 MET SUL 39745 12813 454 135 1.60 (0.70-2.35) 1.66 (0.73-2.37) 699 (637-766) 637 (538-754) 1.13 (0.91-1.40) 1.00
180 720 MET SUL 36367 11730 363 114 1.51 (0.68-2.18) 1.55 (0.70-2.20) 653 (589-724) 627 (522-754) 1.09 (0.86-1.37) 1.00
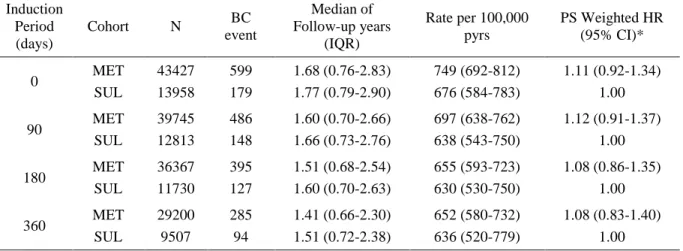
TABLE 4.5. Sensitivity Analyses for Induction Periods in Intention-to-Treat Analysis
Induction Period (days)
Cohort N BC event
Median of Follow-up years
(IQR)
Rate per 100,000 pyrs
PS Weighted HR (95% CI)*
0 MET 43427 599 1.68 (0.76-2.83) 749 (692-812) 1.11 (0.92-1.34) SUL 13958 179 1.77 (0.79-2.90) 676 (584-783) 1.00
90 MET 39745 486 1.60 (0.70-2.66) 697 (638-762) 1.12 (0.91-1.37) SUL 12813 148 1.66 (0.73-2.76) 638 (543-750) 1.00
180 MET 36367 395 1.51 (0.68-2.54) 655 (593-723) 1.08 (0.86-1.35) SUL 11730 127 1.60 (0.70-2.63) 630 (530-750) 1.00
360 MET 29200 285 1.41 (0.66-2.30) 652 (580-732) 1.08 (0.83-1.40) SUL 9507 94 1.51 (0.72-2.38) 636 (520-779) 1.00
Abbreviation: MET: metformin; SUL: sulfonylureas; BC: breast cancer; IQR: Interquartile Range; pyrs: person-years; PS: propensity score.
45
TABLE 4.6. Characteristics in Metformin and Sulfonylureas at Baseline in the MCBS 2006-2009
Characteristics MET SUL Crude OR (95% CI) Adjusted OR (95% CI)#
Total 118 (100.0) 79 (100.0)
Median Age (IQR) 74.0 (70.0-80.0) 78.0 (75.0-84.0) 0.92 (0.88-0.96)$ 0.94 (0.89, 0.99) Race
White 89 (75.4) 59 (74.7) 1.04 (0.54-2.01) 0.85 (0.40, 1.82)
Other 29 (24.6) 20 (25.3) 1.00 1.00
Median of BMI (IQR) 29.9 (25.6-34.0) 28.6 (25.1-33.1)
1.01 (0.97-1.06)$ --
Mean of BMI (SD) 30.5 (6.5) 29.9 (6.9)
BMI Category*
<25 24 (20.3) 18 (22.8) 1.00 1.00
25 to <30 35 (29.7) 30 (38.0) 0.87 (0.40-1.91) 0.84 (0.34, 2.06)
≥30 58 (49.2) 29 (36.7) 1.50 (0.70-3.20) 1.27 (0.52, 3.10)
Smoking Status*
Never 61 (51.7) 48 (60.8) 1.00 1.00
Ever Smoking 57 (48.3) 28 (35.4) 1.60 (0.89-2.89) 1.41 (0.72, 2.74)
Abbreviation: MET: metformin initiators; SUL: sulfonylureas initiators; IQR: interquartile range; SD: standard deviation
* Missing data on BMI and Smoking status were less than 5%. Our DUA does not allow us to present cell sizes <11, so the number of missing was not presented on this table.
$ OR for 1 unit increase
# Adjusted OR was controlled for BMI (categorical), smoking status (never and ever), age, race (white and others), congestive heart failure, ischemic heart disease, beta blocker, anti-hypertensive drugs, loop diuretics, mammogram, admission to hospital, and physician visit in the PS model, as known as gold-standard PS in PSC method.
† To implement PSC, two PSs were estimated within the MCBS data: the error-prone PS (PSEP, MCBS) based on covariates available in claims, and the
gold-standard PS (PSGS, MCBS) based on BMI and smoking status in addition to the variables available in claims. We fit a model for the simple linear regression
of PSGS, MCBS on PSEP, MCBS and treatment. Then, based on the estimated parameters from this model, we imputed a new PS (considered as
“Gold-standard”, PSGS, Medicare) with the original PS (considered as “error-prone”, PSEP, Medicare) and treatment in the main study. The association of
metformin-breast cancer was estimated in a Cox model, weighted by imputed PSGS, Medicare. We acknowledge that the surrogacy assumption for PSC may be violated
Medicare enrollee’s with at least 6-month Part A, B, and D fee-for-service coverage
between 2007 and 2011
Patients who initiated metformin with prior 6-month washout period
(N=148,855)
Patients who initiated sulfonylureas with prior 6-month washout period
(N=100,237)
Excluded patients without a refill or with prior use of any other anti-diabetic drugs
Eligible New Users of Metformin (N=53,558)
* Date of the first refill was defined as the index date
New Users of Metformin (N=43,462)
Final Cohort: New Users of Metformin (N=36,367)
Eligible New Users of Sulfonylureas (N=21,237)
* Date of the first refill was defined as the index date
New Users of Sulfonylureas (N=14,081)
Final Cohort: New Users of Sulfonylureas
(N=11,730) Excluded patients aged <65 years or with
prior mastectomy, prior cancer diagnosis, or prior renal disease diagnosis.
Deleted observations†
Excluded 7,095 patients who were censored within 180 days after the index
date due to developing cancer, death, or end of study (Induction Period)
† One patient can contribute to multiple observations of new use, if applicable. Only the first observation for each patient was included in the final study cohort
FIGURE 4.2. Cumulative Incidence of Breast Cancer by Treatment Cohort.
49
FIGURE 4.4. Propensity Score weighted hazard ratios (95% CIs) comparing metformin initiators vs sulfonylureas initiators, stratified by age group, race, and baseline use of statins, in as treated (top) and intention to treat (bottom) analyses.