U
NCONVENTIONALM
ONETARYP
OLICY: S
PILLOVERS ANDP
OLICYE
FFECTIVENESSKarlye Dilts Stedman
A dissertation submitted to the faculty of the University of North Carolina at Chapel Hill in par-tial fulfillment of the requirements for the degree of Doctor of Philosophy in the Department of
Economics.
Chapel Hill 2019
Approved by:
Anusha Chari
Christian Lundblad
Neville Francis
Eric Ghysels
c
2019
ABSTRACT
KARLYE DILTS STEDMAN: Unconventional Monetary Policy: Spillovers and Policy Effectiveness.
(Under the direction of Anusha Chari and Christian Lundblad)
ACKNOWLEDGMENTS
TABLE OF CONTENTS
LIST OF TABLES . . . viii
LIST OF FIGURES . . . x
1 Monetary Policy and Global Capital Flows: A Critical Literature Review . . . . 1
1.1 Introduction . . . 1
1.2 Unconventional Monetary Policy and Capital Flows: What Do We Know, Why Do We Care? . . . 3
1.2.1 Envisioning the benefits of capital flows . . . 3
1.2.2 The costs of financial liberalization . . . 5
1.3 Capital Flows: Push and Pull, Gross and Net . . . 7
1.3.1 Push factors: Global growth, global interest rates, and global risk . . . . 8
1.3.2 Pull factors: Domestic growth, domestic asset returns, and domestic credit risk . . . 12
1.3.3 Measurement matters . . . 15
1.3.4 This time is different? The global financial cycle and unconventional mon-etary policy . . . 17
1.4 US Monetary Policy and Capital Flows to Emerging Markets: Spillovers at the Zero Lower Bound . . . 18
1.4.1 Identifying Monetary Policy Shocks at the Zero Lower Bound . . . 20
1.4.2 UMP: A Big Push? . . . 25
2 Taper Tantrums: QE, its Aftermath and Emerging Market Capital Flows . . . . 37
2.1 Introduction . . . 37
2.1.1 Related Literature . . . 42
2.2 U.S. Monetary Policy and Capital Flows to Emerging Markets: Spillovers at the Zero Lower Bound . . . 44
2.3 Extracting Monetary Policy Surprise Measures Using High-Frequency Identifica-tion . . . 46
2.3.1 Decomposing the Monetary Surprise Measures . . . 48
2.3.2 Monetary Policy Shocks and Asset Returns in Emerging Markets: A First Look . . . 53
2.4 Data . . . 57
2.4.1 Bertaut and Tryon (2007) . . . 59
2.4.2 Bertaut and Judson (2014) . . . 61
2.4.3 Control Variables . . . 62
2.4.4 Summary Statistics . . . 63
2.5 Benchmark Specification and Regression Results . . . 63
2.5.1 Monetary Surprises and Capital Flows . . . 64
2.5.2 Push and Pull Factors and Capital Flows . . . 67
2.5.3 Economic Significance: Quantifying the Impact of US Monetary Policy Shocks . . . 69
2.5.4 Alternative Specifications and Robustness . . . 70
2.6 Conclusion . . . 76
3 Unconventional Monetary Policy, (A)Synchronicity and the Yield Curve . . . 78
3.1 Introduction . . . 78
3.2 Motivation: Spillovers at the Zero Lower Bound . . . 83
3.2.2 Mechanisms of Transmission: Conventional versus Unconventional
Mon-etary Policy . . . 84
3.3 Stylized Facts: Inference via Heteroskedasticity . . . 88
3.3.1 Methodology . . . 88
3.3.2 Data, Announcements and Timing Conventions . . . 90
3.3.3 Results . . . 91
3.4 Baseline Regressions . . . 92
3.4.1 Monetary Policy Surprises . . . 92
3.4.2 Yield Curve Measures . . . 94
3.4.3 Control variables . . . 95
3.4.4 Methodology . . . 96
3.4.5 Results . . . 98
3.5 Persistence of Monetary Policy Surprises . . . 108
3.6 Concluding Remarks and Directions for Future Research . . . 110
A Chapter 1 Appendix . . . 112
B Chapter 2 Appendix . . . 123
B.1 Determinants of Capital Flows: Pull and Push Factors . . . 123
B.2 Tables and Figures . . . 125
C Chapter 3 Appendix . . . 143
C.1 Shadow Rate Term Structure Model (Wu and Xia 2016) . . . 143
C.2 Tables and Figures . . . 145
LIST OF TABLES
A.1 List of countries in dataset . . . 114
B.1 Description of Variables . . . 126
B.2 Monetary Policy Shocks: Descriptive Statistics and Correlations . . . 128
B.3a Response of Yield Changes to a Monetary Policy Shock . . . 129
B.3b Response of Yield Changes to a Monetary Policy Shock (Con’t) . . . 130
B.4 Response of EME Returns to a Monetary Policy Shock . . . 131
B.5a Response of EME Returns to a Monetary Policy Shock (Con’t) . . . 132
B.5b Response of EME Returns to a One Standard Deviation Change in Fitted Values 132 B.6a Emerging Market Capital Flows: Summary Statistics . . . 133
B.6b Emerging Market Capital Flows: Summary Statistics (Continued) . . . 134
B.7a Impact of US Monetary Policy Shocks on Emerging Market Portfolio Flows . . 135
B.7b Impact of US Monetary Policy Shocks on Emerging Market Portfolio Flows . . 136
B.7c Impact of US Monetary Policy Shocks on Emerging Market Portfolio Flows . . 137
B.7d Wald Test for Equality of Coefficients . . . 138
B.8 Quantitative Impact of Monetary Policy on Capital Flows . . . 139
B.9a Alternative Monetary Measures: One- & Two-Month Fed Funds Futures . . . . 140
B.9b Robustness: Surprises Extracted from Intradaily Data . . . 141
B.9c Robustness: Dependent Variables Scaled by Lagged Positions . . . 142
C.1 Count of Announcement Days . . . 145
C.2 Overlapping Monetary Policy Dates . . . 146
C.3 Timing of Asset Price Changes . . . 147
C.4 Inference via Heteroskedasticity . . . 148
C.6 Summary Statistics: 2-Year Yield Measure . . . 149
C.7 Summary Statistics on Dependent Variables, US and UK . . . 150
C.8 Summary Statistics on Dependent Variables, Euro area and Japan . . . 151
C.9 Subsample Dates . . . 154
C.10 Impact of Monetary Policy on Yields, Full Sample . . . 155
C.11 Impact of Domestic Monetary Policy on Yield Decomposition . . . 156
C.12 Spillovers from FOMC Policy on Yields & Decomposition . . . 157
C.13 Spillovers from ECB Policy on Yields & Decomposition . . . 158
C.14 Spillovers from BOE Policy on Yields & Decomposition . . . 159
C.15 Spillovers from BOJ Policy on Yields & Decomposition . . . 160
C.16 Test for Equality of Coefficients between Break Points (US Yields) . . . 161
C.17 Test for Equality of Coefficients between Break Points (Euro area Yields) . . . 162
C.18 Test for Equality of Coefficients between Break Points (UK Yields) . . . 163
C.19 Test for Equality of Coefficients between Break Points (Japan Yields) . . . 164
C.20 Spillovers to US Yields & Decomposition, Full Sample . . . 165
C.21 Spillovers to Euro Area Yields & Decomposition, Full Sample . . . 166
C.22 Spillovers to UK Yields & Decomposition, Full Sample . . . 167
C.23 Spillovers to Japanese Yields & Decomposition, Full Sample . . . 168
C.24 Spillovers from FOMC Policy on Yields & Decomposition: Robustness . . . . 175
C.25 Spillovers from ECB Policy on Yields & Decomposition: Robustness . . . 176
C.26 Spillovers from BoE Policy on Yields & Decomposition: Robustness . . . 177
LIST OF FIGURES
A.1 Emerging Market Portfolio Flows . . . 112
A.2 Emerging Markets Financial Account: Other Flows . . . 113
A.3 Emerging Market Financial Account Liabilities . . . 113
A.4 Real Effective Exchange Rate . . . 114
A.5 Nominal Effective Exchange Rate . . . 115
A.6 Emerging Market Total Return Indices . . . 116
A.7 Cumulative Capital Flows Beginning in Jan. 1994 . . . 117
A.8 Interquartile Range of Net Debt Flows to EMs . . . 118
A.9 Interquartile Range of Net Portfolio Flows to EMs . . . 119
A.10 Net Equity Flows as a Percent of Period Holdings . . . 120
A.11 Net Bond Flows as a Percent of Period Holdings . . . 121
A.12 Brazilian and US Bond Yields . . . 122
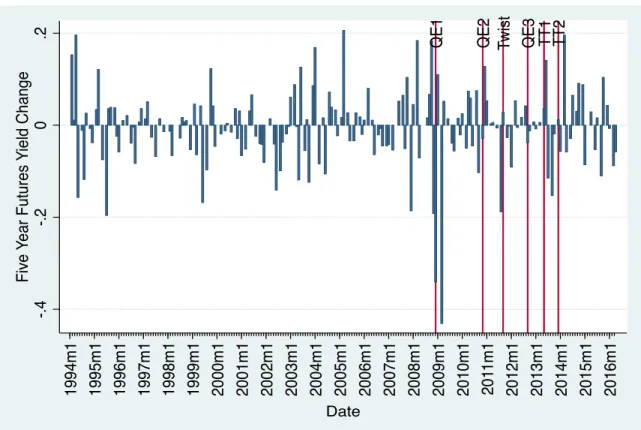
B.1 Five-Year Treasury Futures Yield Changes on FOMC Event Dates . . . 125
B.2 Five-Year Treasury Futures Yield Changes on FOMC Event Dates . . . 127
C.1 Central Bank Assets to GDP . . . 147
C.2 Central Bank Assets (Billions USD) . . . 149
C.3 US Interest Rate Futures . . . 152
C.4 US Monetary Policy Surprises: Interbank Futures Measure . . . 152
C.5 Euro area Monetary Policy Surprises: Interbank Futures Measure . . . 153
C.6 UK Monetary Policy Surprises: Interbank Futures Measure . . . 153
C.7 Japanese Monetary Policy Surprises: Interbank Futures Measure . . . 154
C.10 Effect of a 25BP Expansionary FOMC Surprise on 10 Year Bond Yields . . . . 171
C.11 Effect of a 25BP Expansionary ECB Surprise on 10 Year Bond Yields . . . 172
C.12 Effect of a 25BP Expansionary BoE Surprise on 10 Year Bond Yields . . . 173
CHAPTER 1
MONETARY POLICY AND GLOBAL CAPITAL FLOWS: A CRITICAL LITERATURE REVIEW
1.1 Introduction
Following the onset of the global financial crisis (GFC) in 2007, the Federal Reserve responded aggressively to support the functioning of financial markets in the United States by lowering in-terest rates from514 per cent to effectively zero in an extraordinarily rapid easing in the stance of monetary policy. In addition, the Federal Reserve implemented a number of programs designed to support the liquidity of financial institutions and foster improved conditions in financial markets. Beyond the so-called zero lower bound (ZLB) of interest rates, the Fed policy menu has consisted of direct lending, intended to address limited availability of credit in short-term lending markets, liquidity provision to key credit markets to reduce funding pressures, and large-scale asset pur-chases (LSAPs). This latter facet, rounds of which have come to be known as quantitative easing (QE), has consisted of a mortgage-backed securities (MBS) purchase program with explicit aim of reducing mortgage interest rates and stabilizing housing markets, along with treasury purchases to stimulate economic activity by lowering long-term interest rates to support investment and stim-ulate demand. Monetary policy decisions such as these were also undertaken by the European Central Bank, Bank of England, and Bank of Japan, and had a primarily domestic objective to stimulate and restore growth in the wake of the crisis. Nevertheless, these policy actions appear to have led to substantial spillover effects for emerging-market economies. As interest rates in developed economies remained low, investors were attracted to the higher rates in Brazil, Chile, Taiwan, Thailand, and South Korea and many other emerging economies (Fratzscher 2012).
world increased from $192B to $598B (see Figures A.1 - A.3). This is more than twice the rate of the four-year period ending in 2006Q1, and capital flows into emerging markets more than doubled as a percent of GDP. The massive surge of foreign capital to emerging markets in the aftermath of the global financial crisis (GFC) of 2008-2009 has led to a contentious debate about the international spillover effects of developed-market monetary policy with particular emphasis on the United States (Fratzscher, Lo Duca, and Straub 2013, Rey 2014). These foreign capital inflows led Brazilian President Dilma Rousseff to evocatively claim that advanced economy (AE) monetary policy had unleashed a “monetary tsunami” in the developing world. The governor of Taiwans central bank, Perng Fai-Nan, echoed this sentiment, stating that “the US printed a lot of money, so theres a lot of hot money flowing around. We see hot money in Taiwan and elsewhere in Asia. These short-term capital flows are disturbing emerging economies.”
Then, a remark in May of 2013 (by then-chairman Ben Bernanke) that the Feds purchase of bonds using central-bank money might soon tail off seemingly triggered a selloff in emerging mar-kets. 1 The questions arise: If spillovers to emerging economies indeed manifested in capital
inflows during the recent period of unconventional monetary policy (UMP), will normalization of monetary policy cause destabilizing outflows? How can we think about the various channels of monetary policy transmission to determine whether this will be the case and to what extent? Fur-ther tapering of asset market purchases by advanced economy central banks or forward guidance indicating a departure from the zero lower bound could mean increases in borrowing costs, as well as other financial market disruptions due to the unwinding of speculative positions.
crisis. Section 3 discusses the literature on capital flow determinants, which discusses the explana-tory power of “push”, or common, versus “pull” (country-specific) factors in driving capital flows to emerging markets. Section 4 reviews the literature regarding monetary policy spillovers, includ-ing discussion of the more recent literature on unconventional monetary policy spillovers, some of which estimates the potential effect of Fed tapering on capital flows. Finally, section 5 provides preliminary analysis of a data set that so far remains to be exploited in testing the effect of UMP on capital flows to emerging markets. Section 6 concludes.
1.2 Unconventional Monetary Policy and Capital Flows: What Do We Know, Why Do We Care?
The subject of UMP straddles two main strands of the macroeconomics literature: that on deter-minants of capital flows to emerging markets, and that on the international spillovers of monetary policy in advanced economies. This line of inquiry has substantial real-world consequences in the sense that capital flows appear to offer difficult-to-identify benefits but clear costs to emerging markets. Both emerging markets and advanced economies have increasingly opened their borders to financial flows, and the scope for international capital flows to provide welfare gains or to do harm has widened considerably since the 1990s. To better understand the consternation which UMP and increased capital flows has engendered, let us consider briefly the costs and benefits to inviting capital flows via financial liberalization.
1.2.1 Envisioning the benefits of capital flows
intermediation and financial sector development, potentially enhancing the the efficiency of capi-tal accumulation. Furthermore, foreign investors may also demand better corporate governance to protect their investments, reducing the wedge between the costs of external and internal financial capital, and further increasing investment. In a seminal series of papers on the links between cial sector development and economic growth, King and Levine (1993) find that measures of finan-cial sector development have a strong, significant relationship to long-run real per-capita growth, capital accumulation and productivity growth. Of course, composition matters substantially for explaining the effect and desirability of capital flows; for example, foreign direct investment (FDI) is a more stable form of investment for the recipient economy than either bank loans or portfolio flows, and has more potential for positive economic spillovers. The bulk of this paper is focused on portfolio flows.
the neoclassical stochastic growth model. In particular, for the typical emerging country financial integration yields at most a permanent increase in consumption of 0.5 per cent in a calibration with a moderate degree of risk aversion. The authors find that convergence-based gains in risk sharing for risky, capital scarce economies are dampened by reallocation of precautionary savings across countries. In most studies, gains are of second order as financial integration allows a reduction of consumption volatility but does not affect output. For a more complete review of this literature, see Kose et al (2009).
In the literature utilizing panel data and event studies methods, there is evidence connecting financial integration with the theoretical benefits that should improve growth outcomes. Bekaert and Harvey (2000), for example, show that the cost of capital goes down after major regulatory reforms, while Bekaert, Harvey and Lumsdaine (2002) and Henry (2000) indicate that capital in-flows lead to a permanent positive effect on equity prices following reforms. The resultant increase in investment, if efficient, should increase economic growth. However, evidence for effects of in-ternational capital flows on growth, consumption volatility or risk sharing is hard to find—only the intermediate improvements are visible in the literature (Eichengreen 2002; Jeanne et al 2012; Kose et al. 2009; Obstfeld 2009). Thus, the evidence on ultimate growth dividends from integration is mixed. As we shall see, however, evidence on the costs of financial integration is more unified. 1.2.2 The costs of financial liberalization
asset price bubbles—forces which are the best predictors of financial crises (Gourinchas and Obst-feld 2012). Furthermore, high volumes of capital flows may cause currencies to appreciate, hurting export and GDP growth (Calvo et al 1993). Finally, large inflows can complicate macroeconomic policies to maintain growth while managing inflation—increased interest rates to fight inflation may attract even more capital. These types of disruptions have led many emerging market pol-icy makers to seek to suppress surges in capital flows with capital controls and macroprudential policies.
The degree to which flows are ultimately beneficial or destabilizing depends in no small part on the quality of the flow, which encompasses characteristics such as component of flows (portfolio, FDI, or bank lending), currency of issuance, term of investment and type of investor. 2 Thus, ex-amining how different types of flows are determined is arguably more informative than measuring the determinants of overall flows. Since portfolio flows and bank lending have the greatest po-tential for destabilizing reversals (Milesi-Ferretti and Tille 2011), I focus here on portfolio flows, excluding FDI and bank lending unless otherwise noted.3 To this end, the literature on capital
flows emphasizes the relative importance of “push vs. pull” factors in determining the magnitude and composition of capital flows. The notion that (expansionary) monetary policy plays a role in driving capital flows goes back to Calvo et al (1993) who find that, while domestic factors were undoubtedly important in attracting inflows, the substantial co-movement among key macroeco-nomic variables such as the real exchange rate and reserve flows in Latin America during the early 1990s suggested the influence of a common variable. To the theme of this paper, monetary policy in advanced economies appears to constitute a driving force behind many such push factors, gen-erating macroeconomic and financial outcomes in emerging economies during conventional and unconventional periods of policy, which will be addressed in later sections.
2While the latter three divisions are of importance, they are beyond the scope of this paperhere I consider the
different components of capital flows as the principal distinguishing feature.
3Data on bank lending by nationality of recipient is not plentiful, which explains the paucity of results for such
1.3 Capital Flows: Push and Pull, Gross and Net
As aforementioned, the literature on portfolio and banking capital flows separates determinants into push factors, which are common, global factors associated with external shocks, and pull fac-tors, which are country-specific. ‘Push’ factors operate by reducing the attractiveness of lending to industrial-country borrowers. Global risk (often proxied by the VIX), global liquidity, global inter-est rates and global growth are considered push factors—such occurrences drive phenomena such as search for yield or flight to safety which may affect emerging economies. Overall, the literature suggests that portfolio debt and equity flows appear to be dominated by push factors, although this is not to say that domestic factors lack relevance completely. Among the former, there is strong evidence in the literature for the impact of global risk aversion and mature economy interest rates, and there is some evidence for the effect of mature economy output growth. ‘Pull’ factors, on the other hand, are those that operate through improvements in the risk-return characteristics of assets issued by developing-country debtors, such as would result from productivity-enhancing economic reforms. These include country characteristics such as financial sector development, domestic in-terest rates and asset returns, integration with global financial markets, fiscal position and domestic growth shocks. While the balance of evidence suggests that push factors are a more powerful de-terminant of capital flows, there is some evidence that domestic output growth, domestic interest rates or asset returns and indicators of country risk have an impact on capital flows, as well. Re-turning to our earlier distinction regarding the quality of flows, capital flows driven by pull factors may be more desirable because when investors are pushed into risky assets, as opposed to being attracted to the intrinsic qualities of these assets, they may be less committed to these positions as such and thus more likely to unwind them when the tide turns. A third set of factors that falls partially under each of the previous two are related to contagiontrade linkages, financial linkages and location may also play a role in driving portfolio and banking flows. These are addressed in a separate literature on financial contagion, which is beyond the scope of this paper.
predominantly by a strong domestic economy, a combination of fiscal tightening and exchange rate appreciation might be warranted. If, on the other hand, flows are primarily driven by a temporary decline in interest rates, this may warrant additional reserve accumulation as a buffer for when favorable external conditions reverse. Below I will present the literature supporting the importance of each of these factors in determining capital flows to EMs, addressing as well the measurement practices that are commonly debated and tested in the literature.
1.3.1 Push factors: Global growth, global interest rates, and global risk
Conditional on country characteristics, many authors find that push factors matter more for determining capital flows more than pull factors, although pull factors do appear to have some relevance. Some simple yet compelling evidence comes from Forbes and Warnock (2012) who use gross flows to find that the correlation between stops (a sharp decrease in gross inflows driven by foreigners) and retrenchment (a sharp decrease in gross capital outflows driven by locals) is 0.47, while the correlation between surges (a sharp increase in gross capital inflows driven by foreign-ers) and flight (a sharp increase in gross capital outflows driven by locals) is 0.37. These positive correlations are both consistent with a large role for global factors. On the other hand, correla-tions for other types of episodes are low and do not support an important role for country-specific factors. If pull factors dominated push factors, we would observe a positive correlation between stops and flights and between surges and retrenchments; instead, these are negative. Regarding contagion, which is at least non-domestic in nature, countries are more likely to experience stops or retrenchment if a major trade or financial partner just experienced the same type of episode, and they are more likely to experience stops and flight if their neighbors had the same episode.
case. While it has a shorter-term focus than FDI, it is not as vulnerable to liquidity and counter-party concerns as bank lending, which the authors consider to be the most volatile component. Second, a perceived increase in global risk can lead investors to take a more critical look of the various countries where they invest. Any such reassessment implies that countries with the weak-est fundamentals, such as pre-crisis credit booms, large current account deficits, and large external liabilities arguably face more substantial flight. Finally, with capital flows being forward-looking, one would expect their changes to be related to revisions in expected future economic prospects across countries.
To this point, measuring global risk using the VIX and the VXO, respectively, Ghosh et al. (2012) and Forbes and Warnock (2012) find a variety of factors to be important in increasing the likelihood of a surge to EMEs including lower global risk. In fact, Forbes and Warnock find that global risk is the only variable that consistently predicts each type of capital flow episode under consideration—an increase in global risk is associated with more stops and retrenchments and fewer surges and flights. Fratzscher (2012) examines sustained flows, rather than outsized movements, and finds that higher risk (in particular during the crisis) is associated with net portfolio outflows from emerging market funds. The effect is heterogeneous over time—an increase in the VIX leads to net outflows from advanced economies to EMs before the crisis, but this trend reverses after the crisis. This result is particularly interesting, as it implies that the pricing of risk changed fundamentally during the crisis.
historic volatility of the return of each market), Baek (2006) finds that net portfolio investment is unaffected by risk appetite in Latin American countries but strongly pushes net inflows into Asian emerging economies.
As for global interest rates, in theory, interest rate differentials may drive capital inflows based on carry-trade—in a financial market with frictions (i.e., in which no arbitrage and uncovered in-terest parity do not hold), an investor may borrow money at a low inin-terest rate in an advanced country in order to invest in an asset with a higher yield in an emerging market. There is strong evidence to support the existence of a carry trade that drives capital flows to emerging markets, with most authors finding a negative relationship between capital inflows and advanced economy interest rates. Early in the literature, Calvo et al (1993) showed that movements of US interest rates tended to explain much of the common variation driving capital flows to Latin America, and concluded that external variables have been dominant in driving capital inflows to the region. Like-wise, Fernandez-Arias (1996) finds that capital inflows in the typical country are largely dependent on favorable international interest rates. While the latter author finds that country creditworthiness is a principal contributor to capital inflows, he also finds that, to a large extent, developing country creditworthiness has been in turn driven by external factors, especially international interest rates. In total, when account is taken of the role of external interest rates in determining the secondary-market debt price, fully 86 per cent of the surge in inflows can be attributed to movements in external interest rates.
international interest rates, and a proxy for capital market depth. They show, in a panel of 15 coun-tries from 1990 - 1996 that international interest rates significantly influenced the overall volume of flows. The estimated coefficient is negative, suggesting a carry trade. According to the authors, US interest rates have the most significant effect on bond and equity portfolio flows, compared to FDI flows and overall flows. Finally, Chuhan, Claessens and Mamingi (1998), using data obtained from the US Treasury Department in a panel regression with principal components and a time trend, find that the first principal component of US interest rates and US industrial production is almost always significant and exerts a negative influence on flows, controlling for domestic returns, domestic credit rating and price-to-equity ratios.
There is some qualification to be made, however. For example, Ahmed and Zlate (2014) make the point that if speculative carry trade positions are being undertaken, the underlying force could be high domestic interest rates, low international interest rates, or both. They find that such interest rate differentials drive net portfolio flows, but make little economic difference for net total flows—a distinction to be addressed in the following section. Forbes and Warnock (2012) on the other hand, in a repudiation of the bulk of results, find no significant role for changes in global interest rates or in global liquidity for capital surges or flight (although high global interest rates are associated with a higher probability of retrenchment). In another result that goes against the majority of available evidence, De Vita and Kyaw (2008b) find a positive relationship between foreign interest rates and portfolio and FDI flows using annual data on 32 emerging and developing countries from IFS (1990 - 2004). In an SVAR specification examining five emerging markets, the same authors (2008a) find that foreign interest rate and domestic money shocks have a positive, but statistically insignificant effect on portfolio flows, and that the effect diminishes very quickly, such as it is.
above). In their cross-sectional study, they find that strong global growth is associated with a higher probability of surges and a lower probability of stops and retrenchment. De Vita and Kyaw (2008a) find that shocks to real variables of economic activity such as foreign output and domestic productivity are the most important forces explaining the variations in capital flows to developing countries. In particular, variations in portfolio flows are explained primarily by shocks to foreign output and domestic productivity in the medium- to longer-term horizons. Curiously, in panel cointegrating FMOLS estimates, the same authors (2008b) find that foreign output is not significant for driving portfolio flows, but negatively affects FDI flows.
Using pooled OLS on a panel of five Latin American and four Asian countries from 1989 to 2002, Baek (2006) finds a positive, significant relationship between global growth and capital flows for EM Asia, but no such significant relationship for Latin America. Ahmed and Zlate (2014), examining on emerging market (EM) portfolio flows from quarterly BOP data for a panel of 12 EM economies with fixed effects, find a significant and positive relationship between the growth differential of advanced economies vis-`a-vis emerging markets and capital flows. Interestingly, for the crisis period, the interaction coefficient on the growth rate differential is negative and about the same magnitude as the same in the pre-crisis period. The authors claim that this implies that growth rate differentials ceased to determine capital flows during the crisis. Fratzscher (2012) finds that, in the non-crisis period, a positive US macro shock induces capital outflows from emerging market funds from EPFR data (presumably as capital is repatriated to the US).4
1.3.2 Pull factors: Domestic growth, domestic asset returns, and domestic credit risk
The literature suggests some role for domestic factors, however. Many studies find evidence that domestic economic performance is an important driver of portfolio flows, although not all find-ings are consistently significant. For example, Ghosh et al. (2012) find that a particular emerging markets own attractiveness as an investment destination increases the likelihood of a capital surge to a particular EME. While Baek (2006) finds that domestic output growth is positively related to
4Data on capital flows from Emerging Portfolio Fund Research (EPFR) database represents less than 20 per cent
net portfolio inflows in a panel of all countries and of Latin American countries, the author also finds the effect to be statistically insignificant for Asian countries. Interestingly, when the data is whittled down to net portfolio inflows from foreigners, the effect of real output growth is not sta-tistically significant for any subsample. Similarly, Fratzscher (2012) does not find a consistent role for domestic economic performance in driving portfolio equity flows—only in the post-crisis pe-riod does he find a statistically significant relationship between private capital flows and economic growth. In the full sample, the author finds a significant, negative relationship between portfolio debt flows and economic growth during non-crisis times, only to have the sign reversed during the crisis. For developing and emerging markets, the relationship between portfolio debt flows and growth is statistically insignificant during the non-crisis period, but positive and significant during the crisis.
Curiously, De Vita and Kyaw (2008a) find that a domestic productivity shock (as proxied by an increased in real GDP growth) seems to cause an increase in foreign direct investment flows and, although portfolio flows increase initially, the overall tendency is to cause a reduction in the latter—evidence that pull factors attract more stable capital flows. Their estimates with panel data (2008b) partially corroborate this finding. In this latter paper, an increase in real GDP growth is a associated with increases in both FDI inflows and portfolio inflows, although the effect on the former is larger. Forbes and Warnock (2012) find that few domestic factors are consistently associated with the increased probability of an episode. However, regarding domestic economic performance, stops are found to be more likely with negative growth shocks, while surges are found to be more likely with positive growth shocks.
America—it is some times significant for Asia and carries the expected sign, but it is wrongly signed and insignificant for Latin America. According to the authors, the lack of significance of this variable is mainly explained by the fact that these rates of return are ex-post measured rates of return and tend to be volatile. Alternatively, Lo Duca (2012) specifically investigates the extent to which push and pull factors vary over time using a time varying coefficient model which studies the determinants of daily portfolio equity flows to EMEs over the period April 2007 - March 2012. In a baseline model with time-invariant coefficients, the author finds that the part of equity returns in emerging market economies which is orthogonal to the three shocks and to the US equity market returns has some explanatory power, but is overshadowed by push factors such as the return on US equity markets.
Some authors’ findings do not come down clearly on the side of push or pull on the subject of “returns chasing”. As aforementioned, Ahmed and Zlate (2014) find that the differential between advanced country and emerging market interest rates has a positive impact on portfolio flows; this effect clearly could result from either low advanced economy returns or high emerging market returns. Relatedly, Forbes and Warnock (2012) find that positive US equity returns and domestic equity returns both lead to more capital flows into all economies.
be clearly established, but not for equity flows. The credit rating is significant for equity flows in Asia.
1.3.3 Measurement matters
The measure of capital flows is important from the standpoint of identification, but it is also important in the sense that different flow concepts have different consequences in the real and financial economies of recipient countries. While net inflows may be more relevant for exchange rate appreciation and other overheating concerns, gross inflows may be more directly relevant for the effects of capital controls that specifically target foreign investments, for the effects of inflows due to global shocks, as well as for financial stability issues. Which set of issues is most relevant from a stability point of view is specific to region and level of development, among other probable characteristics. For example, issues such as here real effective exchange rate (REER) appreciation, UMP spillovers and the effectiveness of capital controls apply with particular force to emerging Asia and Latin America; a structurally different set of issues applied to, say, emerging Europe. In this section, I will briefly address some of the distinct effects to be found using net or gross flows, and consider how the effects of global and domestic characteristics might change over time.
Comparing the number of episodes identified based on using gross flows versus net flows, Forbes and Warnock (2012) find that, during the heart of the global financial crisis, net flows iden-tify more surge episodes and fewer stop episodes. Because many countries residents retrenched from foreign markets, each country with a surge in the net flow data also had a retrenchment episode according to the gross flow data. Additionally, most of the countries identified as having a stop in the gross data also experienced a retrenchment, which may not register as a sudden stop with net flows. Beyond identification of capital flow events, the analysis of push versus pull factors in this framework are sensitive to the gross/net distinction. As aforementioned, global risk is the most consistent predictor of all episodes, strong global growth is associated with a higher proba-bility of surges, lower probaproba-bility of retrenchment, and higher global interest rates are correlated with retrenchment. However, the authors get very different results with net flows. For example, global risk is not significantly related to either surges or stops based on net flows, perhaps because a decrease in the VXO causes capital inflows from abroad, plus outflows from home that outweigh each other. Additionally, global interest rates have no statistically significant relationship to any episode type, and global growth is negatively related only to stops in a statistically significant fashion.
Therefore, the authors estimate the model irrespective of the size of the flows and test for structural breaks instead. Graphically, Ahmed and Zlate’s baseline model under-predicts capital flows in the post-crisis period comparing a projection to the realized outcome as described above. A structural break test interacting explanatory variables with a post-crisis dummy indicates that sensitivities to the explanatory variables have changed from before to after the crisis. In particular, the results suggest the presence of a structural break with respect to the AE - EME policy rate differential.
Looking at the crisis itself, Milesi-Ferretti and Tille (2011), find that, in the collapse stage of the GFC (2006Q1 - 2007Q2 and 2008Q4 - 2009Q1), emerging economies with larger gross bank debt positions and more negative net bank debt positions suffered sharper declines in gross and net capital inflows. In the recovery period (post 2009Q1), the decline in inflows is larger for countries with larger gross debt positions and slower growth in trading partners. Consistent with this con-clusion, Lo Duca (2012) finds that pull factors are more important when risk aversion is elevated (as it would be during a crisis), although extreme risk aversion generates panics where local de-velopments play only a small role in shaping capital flows. The nature of such differential impacts and the existence of structural breaks around the time of the crisis may fundamentally change our thinking about how independent monetary policy is for emerging and developing economies. In the next section, I would like to explore just such a claim explicitly and by expounding on the lit-erature on UMP and on address briefly what H`el´ene Rey (2014) calls ”the global financial cycle” (GFC).
(2014). First, there appears to be a clear pattern of co-movement of gross capital flows, the leverage of the banking sector and of risky asset prices across countries. Second, indices of market fear (e.g. VIX, VSTOXX, VFTSE) tend to move negatively with gross cross-border flows, and also to co-move negatively with credit and leverage growth. Finally, risky asset prices (equities, corporate bonds) around the world are largely driven by one global factor, which is closely related to the VIX. Tellingly, Rey finds that one of the determinants of the global financial cycle is monetary policy in a center country, which affects leverage of global banks, capital flows and credit growth in the international financial system. To clearly motivate the GFC and its connection with capital flows worldwide to the exclusion of domestic factors, I will explore the literature on these.
1.4 US Monetary Policy and Capital Flows to Emerging Markets: Spillovers at the Zero Lower Bound
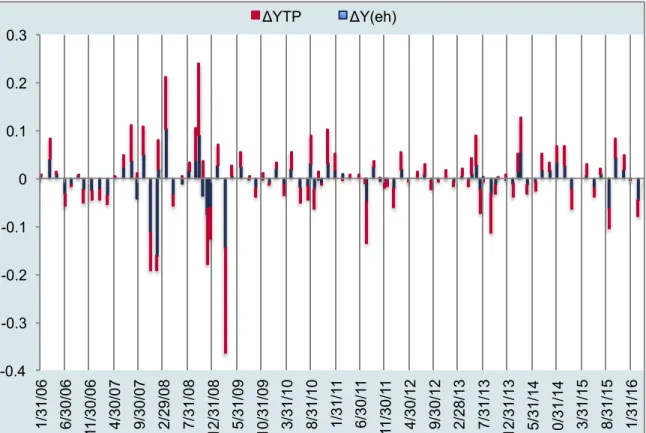
As discussed above, global or advanced country interest rates and perceived global risk ap-pear to be major push factors influencing capital flows to EMEs. During normal times, monetary policy might operate through conventional channels such as trade balances, changes in the real interest rate (and thus cost of capital), and currency management. However, because the period of unconventional monetary policy has involved heavier management of expectations and efforts to exert direct control further along the yield curve, additional channels of transmission are in the mix. These are the portfolio balance, signaling, confidence and liquidity channels of monetary transmission. Based on the usual decomposition of yields on safe long-term government bonds, there are two potential elements of the yield curve that central bank bond purchases could affect: the term premium and the average level of short-term interest rates over the maturity of the bond, also known as the risk-neutral rate. The n-year yield on a bond is the sum of expected overnight rates and a term premium:
WhereYt,t¯ +nis the average short term rate expected over the periodttot+n, andY T Pt,nis a term premium.
QE involves the purchase of longer-duration assets, which implies reduced supply of such assets to private investors, and affects the term premium in long-term interest rates due to im-perfect substitutability between securities of different maturities or asset classes. The result is an increased demand for substitute assets. This is what is known as the portfolio balance effect— models of portfolio balancing are usually motivated by citing frictions (e.g., preferred habitat or market segmentation) that preclude perfect arbitrage between long and short expected rates. These frictions permit official purchases of long term debt to decrease yields by removing duration risk from the market. Investors demand less compensation for risk, which implies a decrease in the term premium,Y T Pt,n.
QE can also affect portfolio decisions and asset prices by altering the liquidity premium and thus the functioning of markets. In practice, LSAPs are credited as increased reserves on the bal-ance sheet of private banks. Since such reserves are more easily traded in secondary markets than are long term securities, the liquidity premium decreases. Thus, liquidity constrained banks can extend credit to investors. The result is decreased borrowing costs, along with increased lending. However, before we can identify the various channels through which UMP operates, we must first identify UMP itself. I endeavor now to review, briefly, some strategies for achieving identification, addressing more creating methods for identifying specific channels in the following section. 1.4.1 Identifying Monetary Policy Shocks at the Zero Lower Bound
In order to test for the presence and nature of the effect of UMP on EM capital flows, it is first incumbent on the researcher to identify monetary policy shocks at the zero lower bound. This is an exercise that would not be without controversy absent forward guidance and LSAPs—in general, the literature has not converged on a particular set of identifying assumptions for identifying an exogenous shock to monetary policy—measuring the response of real and financial variables to changes in the monetary policy requires certain timing restrictions that guarantee monetary policy shocks affect the dependent variables in question and not vice versa. Moreover, timing is not the only issue in identifying the true impact of monetary policy. New Keynesian monetary theory suggests that rational actors observe the state of the economy and, knowing the parameters of the central banks loss function, anticipate future rate changes and adjust their output and consumption decisions accordingly. Thus, only elements of monetary policy out of line with what is expected by the market should have an impact on real and financial variables. Although the practice and particular details will vary, the main methods of identifying monetary policy shocks to test for spillovers fall into three categories in the literature: panel estimation with announcement dummies, structural VARs and high frequency identification schemes. The benefits of each lay in the data to which they offer us monetary policy shock identification—usually based in frequency of the chosen data. I will address briefly each of these in turn.
dummies for the dates of FOMC meetings and speeches by the Chair, as well as a number of fun-damental control variables, These studies have the advantage of controlling for other factors and for avoiding reliance on short-term moves that may be attributable to idiosyncratic effects. As an additional benefit, it is less complicated to estimate this class of model with mixed frequencies (Kalman filtering or MIDAS) without additional or mixed exclusion restrictions. Using dummies only for dates thought to contain a surprise fed funds rate change may, however, miss dates that contain a surprise insofar as rates did not change—so it is important from an identification stand-point to one set of dummies dates with surprises, and another for dates with surprises. Likewise, simple changes in the Fed Funds rate may lead to an attenuated estimate of the effect of monetary policy on real and financial variables.
US and globally. The narrative method involves using the historical record to identify episodes when there were large shifts in monetary policy or in the behavior of the monetary sector that were not driven by developments on the real side of the economy. In an attempt to narrow the definition of what constitutes a shock, the authors count only episodes in which the Federal Reserve attempted to exert a contractionary influence on the economy in order, explicitly, to reduce inflation using Federal Reserve records. The authors exclude monetary contractions that are generated by concerns other than inflation and also exclude all monetary expansions to limit the role that judgment plays in identifying monetary shocks. The purpose of this limitation is that the authors believe that policy decisions meant to cure inflation are as close to practically possible to the factors that otherwise affect real outcomes. Studies of these kinds may use dates with monetary policy surprises in the regression with real and nominal variables to determine their responses to monetary policy.
monetary policy surprise using various futures contracts immediately preceding and following FOMC meetings. Expectations of Fed policy actions are not directly observable, but futures prices are a natural, market-based proxy for those expectations. The abundance of short-term interest rates that potentially measure federal funds rate expectations has led to a proliferation of asset price-based monetary policy expectation measures. Among the futures contracts found in use in this literature are the current-month federal funds futures contract, the month-ahead federal funds futures contract, the one-month eurodollar deposit rate, the three-month Treasury bill rate, and the three-month eurodollar futures rate.
Sometimes, however, market reactions are spurred by what the FOMC says rather than what it does. This is especially relevant at the ZLB, when the Fed must rely heavily on forward guidance. G¨urkaynak, Sack and Swanson (heretofore referred to as GSS) (2005, 2007) propose alternative shock measures that capture changes in market expectations of policy over slightly longer horizons. Federal funds futures have a payout that is based on the average effective federal funds rate that prevails over the calendar month specified in the contract. Thus, immediately before an FOMC meeting, at time t −∆t, the implied rate from the current-month federal funds future contract, f f1, is largely a weighted average of the federal funds rate that has prevailed so far in the month, r0, and the rate that is expected to prevail for the reminder of the month,r1
f f1t−∆t = d1
D1(r0) +
D1−d1
D1 Et−∆t(r1) +ρ1t−∆t (1.2)
mp1t= (f f1t−f f1t−∆t) D1
D1−d1 (1.3)
Note that to interpret the above as the surprise change in monetary policy expectations, we need to assume that the change in the risk premium ρin this narrow window of time is small in comparison to the change in expectations itself.
A measure can also be constructed to capture the change in the federal funds rate expected to prevail after the next FOMC meeting. Given the unexpected change in the federal funds rate following the current meeting,mp1t, the change in the rate expected after the subsequent meeting, mp2t, can be calculated as follows:
mp2t=
D2
D2−d2(∆f f2t−
d2
D2mp1t) (1.4)
wheret−∆f f2is the change in the federal funds futures contract for the month of the next FOMC meeting. Later refinements of the technique have narrowed the window in which surprises are calculated to better achieve identification. Surprises in future rates are often measured within a tight window (e.g. thirty minutes) of the FOMC decision.
the policy indicator a government bond rate with a maturity that is longer than the current period funds rate. I will detail this methodology in greater detail in section 5; however, intuitively, the first stage isolates the variation in the reduced form residual for the longer-term (one to two year) government bond yield that is due to the structural policy shock. Following the HFI literature, the set of external instruments used to identify monetary policy shocks consists of surprises in fed finds futures and Eurodollar futures on FOMC dates.
Each of these has methods has been used to greater of lesser extent in the recent literature regarding the effect of unconventional monetary policy on emerging economy capital markets. Typically, studies involving prices and yields make use of HFI and studies involving real variables and financial flows utilize the vector autoregression approach or panel regression with FOMC meeting dummies, although neither is limited exclusively in this sense. Now that we have discussed the various methods used to identify monetary policy shocks, in the following section we will see how these methods are used in conjunction with additional specifications to identify channels of transmissionof unconventional monetary policy, in addition to estimating the size of the impact of UMP on EME capital flows and asset prices.
1.4.2 UMP: A Big Push?
Chairman Ben Bernanke described the effects of the Federal Reserves bond purchases in this way:5
“I see the evidence as most favorable to the view that such purchases work primarily through the so-called portfolio balance channel, which holds that once short-term in-terest rates have reached zero, the Federal Reserves purchases of longer-term securities affect financial conditions by changing the quantity and mix of financial assets held by the public. Specifically, the Feds strategy relies on the presumption that different financial assets are not perfect substitutes in investors portfolios, so that changes in the net supply of an asset available to investors affect its yield and those of broadly similar assets.”
Various studies have attempted to parse the degree to which the various channel of unconven-tional monetary policy are in operation using the above methods; the majority, however, endeavor
5Bernanke, B. 2010. “The Economic Outlook and Monetary Policy.” Speech presented at the Federal Reserve
to discover the effects of UMP on the home economy. Here, I address the evidence supporting the overall impact of UMP on EME capital flows, as well as the channels through which transmission is found to be strongest. Along with central bank policymakers, researchers have also favored the portfolio balance channel in accounting for the effects of LSAPs, although many of these studies focus on the effect of UMP on bond yields in the United States. In the interest of organization, I will address each of the channels in turn, tackling evidence from prices and then from financial flows. The although the data are closely related, they are distinct in terms of the kind of identifica-tion they can achieve. Studies utilizing flows deliver more direct inference regarding the channel of transmission in operation; however, it may be more straightforward to achieve identification with prices or yields.
1.4.3 Indirect evidence on unconventional monetary policy: prices and yields
(i.e., that UMP operated through a confidence channel). Rather, the Fed appears to have influ-enced long rates by decreasing expected future short rates and through the term premium. Neely parameterizes a portfolio balance model with standard values of risk aversion and historical return moments to examine whether an LSAP announcement can generate quantitatively important ef-fects. According to Neely, “the model cannot definitively prove [portfolio balance] effects or rule out other channels, [but] comparing the magnitude of the models [portfolio balance] effects to the observed asset price changes suggests the importance of that mechanism in the data’(108).
Bauer and Neely (2012) use dynamic term structure models (DTSM) combined with an event study approach to uncover to what extent signaling and portfolio balance channels caused declines in international bond yields during QE episodes.As in Neely (2015), this paper analysis bond yields in the US, Canada, Germany, Australia and Japan. The authors estimate the importance of the signaling channel by examining the changes in short-rate expectations around LSAP events. As alluded earlier, changes in short-rate expectations should be viewed as conservative estimates of the importance of the signaling channel for two reasons: First, a successful monetary policy action aimed at easing financial conditions stimulates future growth and would raise short-rate ex-pectations for the more distant future, counteracting the decreases in exex-pectations due to signaling effects. Second, signaling near-zero policy rates would tend to lower interest rate risk and the term premium, even without any portfolio balance effects. The authors identify term premium effects using affine term structure models, which have the advantage that they parsimoniously model the entire yield curve with a small number of risk factors. The observed decrease in long-term yields is a measure of the importance of the signaling and portfolio balance channels together, as discussed above. Considering the two sets of results together, according to the authors, shows the relative importance of the portfolio balance and signaling channels.
relatively larger role than they did for the U.S. and Canada. Portfolio balance effects were small for Japanese yields and signaling effects basically nonexistent. These findings about LSAP channels are consistent with predictions based on interest rate dynamics during normal times: Signaling effects tend to be large for countries with strong yield responses to conventional U.S. monetary policy surprises, and portfolio balance effects are consistent with the degree of substitutability across international bonds, as measured by the covariance between foreign and U.S. bond returns. A very weak signaling channel parallels the weak reaction of Japanese yields to conventional U.S. monetary policy and the small portfolio balance effects are consistent with the relatively weak covariance between Japanese and U.S. long bond returns.
perceived-risk countries. The results here indicate that during the conventional U.S. monetary policy regime, the yields on speculative-grade sovereign bonds decline more than one-for-one in response to an unanticipated easing of U.S. monetary policy, implying a significant narrowing of sovereign credit spreads for riskier countries. By contrast, during the unconventional policy regime, the response of speculative-grade sovereign bond yields to U.S. monetary policy shocks is one-to-one.
Thus, the literature on the effect of UMP on foreign bond yields indicate rather strongly that QE and forward guidance have lowered yields in both advanced and emerging economies. In the next section, I will discuss the literature pertaining to capital flows themselves, which often provides a more straight-forward look at channels of transmission.
1.4.4 Direct evidence on UMP: data on flows
Evidence from emerging markets regarding capital flows is more plentiful. Many such studies use EPFR data, due to its high frequency and good fit with BOP data. For example, Fratzscher, Lo Duca and Straub (2014) use daily data on portfolio equity and bond investment flows from EPFR in a dynamic panel with fixed effects, focusing on net injections into funds (which abstracts from valuation changes), aggregated at the country level. These reflect, according to the authors, active decisions of investors about whether or not to add or reduce investment in a particular fund class. To identify monetary policy shocks, Fratzscher et al use both announcement dummies and operations. Their reasoning for using both when announcements should be considered (rationally) sufficient is two-fold. First, markets may have been less efficient during this time; many Fed poli-cies were undertaken precisely because markets were not functioning. Second, market participants may have formed accurate assessments about the timing and size of operations, but may not have accurately forecast the effectiveness of such operations in. In a baseline panel estimation that ac-counts for country fixed effects, lagged variables reflecting financial shocks, risk and global market conditions (such as the VIX, the 10-year T- bond yield in the US, the liquidity spread6) and lagged returns of the domestic market return, the authors find that QE1 announcements triggered mainly
inflows into US equities and, to a lesser extent, bonds, emulating a flight to safety, and lending support for a confidence channel of transmission. On the other hand, QE2 policies induced a port-folio rebalancing out of US equities and bonds, and partly into EME equities. This holds for both QE2 announcements as well as for the Feds Treasury purchases. Moreover, Treasury purchases by the Fed also induced a portfolio rebalancing across asset classes, as bond funds in all regions — US, EMEs and other advanced economies, experienced net outflows and EME equity funds net inflows.
In a separate exercise, Fratzscher, Lo Duca and Straub divide their observations into three groups (US, AE and EME ) to test for heterogeneous effects of LSAPs:.
yit =Eit−1[yit] +βiM Pt+it (1.5)
To test for within group and across group heterogeneity, the following specification is used:
yit=Eit−1[yit] + (γ0+γ1Di)M Pt+it (1.6)
whereDi = 1if a in country is in a high group, and zero otherwise.
contribute to the amplitude of these spillovers.
Using panel data (with fixed effects and a trend) on gross flows from 60 developing countries (2000Q1 - 2013Q2), Lim, Mohapatra and Stocker (2014), attempt to identify a lower bound for the effect of QE on capital flows in the following manner.7 Rather than ascribe a specific, quantitative
estimate to the total effect of QE, the authors’ strategy is to begin by accounting for potential QE spillover effects through standard transmission channels—namely via liquidity, portfolio balanc-ing, and confidence—and then seek to establish whether QE episodes saw any additionaleffects on financial inflows attributable to unobservables. To the extent that QE affected the fundamentals, there is evidence that its transmission occurred along each of the portfolio balance, signaling and liquidity channels, as proxied by the three-month T-Bill and M2 (for liquidity); the yield curve, interest rate differential and growth differential (for portfolio balance); and the VIX (for confi-dence/signaling). Even with variables included in the regression to account for these channels, QE episode indicators enter the regression with statistically and economically significant coefficients: a combined QE episode indicator, for instance, suggests that the QE period saw an increase in gross financial inflows to developing countries of approximately 5 percent, over and above the effects that QE may have had on observable channels, such as a reduction in the VIX due to im-proved confidence, or the flattening of the yield curve as investors rebalanced their portfolios. When QE episodes are included in the regressions one at a time into the three separate variables, these measures of QE display a diminishing effect for each episode: the magnitude of the coeffi-cient decreases from the first and second QE interventions, and is actually insignificant for QE3 in extended specifications. Comparing portfolio with loan flows, the latter responds more to the unobservable effect of QE (the coefficient on the indicator variable is 0.021 versus 0.018), suggest-ing that more so than for the other flows, QE operated through channels other than the modeled channels to boost bank lending. In contrast, measurable transmission channels for QE are routinely larger for portfolio flows.
7IFS for gross portfolio and FDI flows plus bank lending data from the Locational Bank Statistics dataset collected
Ahmed and Zlate (2014) attempt to ascertain the effect of UMP on capital flows in regressions including capital controls and three different LSAP measures, although they make no additional identifying assumptions to attempt to separate the channels of transmission. The first QE variable is an indicator equal to 1 for quarters when QE programs were first announced, using the standard announcement dates documented by the literature (see Gagnon et al 2011; Krishnamurthy and Vissing-Jorgensen 2011), while the second measure is the yield on 10-year U.S. treasury bonds. The third measure is net asset purchases by the Federal Reserve from 2003Q1 to 2013Q2 used as an instrumental variable to try to isolate more directly the change in Treasury yields that could be attributed to unconventional U.S. monetary policy, and then examine its effect on EME flows. Using net flows, and controlling for growth differentials, interest rate differentials, VIX and a time trend, the binary LSAP indicator is positive and significant only for portfolio net inflows, the 10-year yield is positive and significant only for portfolio net inflows in a fixed effects specification and the instrument IV has no effect. Interestingly, using an interaction variable linking the 10-yeary yield and a crisis dummy indicates a structural break—the effect of the US 10 year bond yield is higher in the post-crisis period. Running the same exercise with gross flows, indicator and yields indicate positive, significant effect of UMP on gross flows and 10 year bond yields have a stronger effect on gross flows than for net, consistent with the idea that gross capital flows are overall more vulnerable to push factors.
finally dollar exposure. Key differences emerge from the responses of housing prices, domestic credit and bank and portfolio inflows to a contraction in US monetary policy: while these vari-ables are barely or even positively affected in advanced countries, they fall substantially and quite persistently in emerging economies in response to a US monetary tightening. The only similarity between advanced and emerging economies is that capital outflows by domestic residents increase across the board in response to tightening. Distinguishing between countries with floating ver-sus managed currencies, domestic credit and banking inflows are much more affected in countries with pegged exchange rates, which experience a sustained credit crunch associated with banking outflows. Foreign banks instead channel funds into floating EMEs, on average. Finally, the more financially open (according to a division of countries above and below the median of the Chinn-Ito index of financial openness) emerging economies seem to display larger responses in most variables, but confidence bands are also wider. More to the point, portfolio and banking inflows display statistically significant, opposite patterns: they retrench persistently in more financially closed economies, while quickly stabilizing and even turning positive in open ones. Therefore, it seems that capital controls mainly allow domestic interest rates to decouple more from US ones, but are not very effective in affecting capital flows per se. Overall, these results qualify and ex-tend those in Rey (2014). A floating exchange rate together with a low level of financial openness dampens the effects of US monetary policy on macroeconomic and financial variables in emerging economies.
two stages. The first regresses the share of foreign investors’ in holdings in EME bond markets on 10-year US Treasury yields, with yield-related variables and risk factors as controls. 8 In the second stage, the authors analyze the impact of foreign investment on EME government bond yields, controlling for expected future short rates (proxied by inflation), CDS spreads, the ratio of fiscal balance to GDP and foreign share in government bond markets. The dependent variable is the 10-year government bond yield of each nation. Finally, they estimate the cumulative changes in each country’s ten-year yield and eight-year yield two years forward on LSAP event days in an alternative event study approach. Each of these steps is conducted with sub-samples for exchange rate flexibility, financial openness, and a measure exposure the US. The results suggest, overall, that a 10-basis-point reduction in long-term U.S. Treasury yields results in a 0.4 percentage point increase in the foreign ownership share of emerging market debt. This, in turn, is estimated to reduce government bond yields in EMEs by approximately 1.7 basis points. Here, among push factors, the US 10 year treasury yield has a significant, negative effect on foreign share in every specification. Surprisingly, the VIX is only significant for countries grouped as financially open and with low financial exposure the to the US as a percent of total assets and liabilities and high exposure to the US in percent of GDP. In terms of pull factors, inclusion in the WGBI and AMI routinely and positively has a statistically significant effect on capital flows, as does the domestic GDP growth rate (although the effect of GDP growth is statistically insignificant for flexible foreign exchange regimes, closed financial account economies, and countries with a high level of exposure to the US in percent of assets and liabilities).
Looking forward, a pressing question for emerging-market policy-makers is how capital flows will respond to the Fed’s withdrawal of monetary stimulus and eventual increase in interest rates. Dalhaus and Vasishtha (2014) examine the potential impact of U.S. monetary policy normalization on portfolio flows to major EMEs by using a Bayesian vector autoregressive model that explicitly
8The former include the domestic bond yield, lagged currency appreciation, and deviations from covered interest,
accounts for market expectations of future monetary policy. The common component of capi-tal flows that the authors use in their VAR tracks aggregate net capicapi-tal flows very well, lending credibility to the approach of including the common factor in the VAR for individual countries, and suggesting that common (i.e., global) factors have played a much larger role than idiosyn-cratic factors in shaping fund flows into EME bonds and equities in recent years. In the results of the VAR, the policy normalization shock decreases the common capital flow factor significantly, which returns to normal 9 to 10 months later. Economically, the effect is small. Potential country-specific macroeconomic variables are excluded from the VAR model; however, to shed some light on possible explanations for observed differences in the magnitudes of the effect across coun-tries, Dalhaus and Vasishtha investigate the association between the estimated effects and country characteristics—the evidence here, however, is scant. Countries identified as being potentially most affected are the ones that received greater financial inflows prior to 2013. Evaluating the relation between the estimated effect on capital flows and the capital outflows experienced over end-May to August 2013 following the Bernanke testimony shows a strong association between the countries that are identified by the model as being most affected by QE and the ones that saw greater outflows following taper talk. Similarly, Lim, Mohapatra and Stocker (2014) analyze a normalization scenario (albeit for prices) finding that, relative to a status quo of no change in quan-titative easing, capital inflows contract by a cumulative 10 percent (or 0.6 percent of developing country GDP) by the end of 2016, regardless of whether monetary policy normalization occurs more gradually or more rapidly (although in the latter scenario around three-quarters of the effects of tapering are front-loaded to 2014).
is one in the month of a QE announcement and zero otherwise to produce a latent propensity for QE. The model is estimated on US macro data and includes one of several different indicators of emerging markets’ financial conditions: total capital and portfolio outflows from the US to coun-tries in the Asia-Pacific region and Latin America (Outflows to EME) as measured by the Bureau of Economic Analysis (BEA) , the change in the EMBI+ index (EMBI), the change in the MSCI emerging market equity price index (MSCI), and finally the average change in the value of the USD against six major emerging market currencies (EME FX), i.e. Brazil, India, Korea, Mexico, Thailand, South Africa. To achieve identification, Tillman uses a Choleski factorization with the following order: US industrial production, latent QE, 10-year treasury yield, outflows to EME / EMBI / MSCI / EME FX. The results show that an unconventional monetary policy shock, that is, an unexpected increase in the Fed’spropensityto undertake Quantitative Easing, strongly increases emerging markets’ capital inflows, bond prices, equity prices and exchange rates.
Whether measured with proxies, instruments or dummies, there is wide agreement in the liter-ature that UMP has played a role in driving portfolio flows into emerging markets. The economic significance is still up for debate, and the channels through which that impact has acted is still a question. To that end, I would like to approach this discussion with a novel dataset that harnesses the high-frequency benefits of using EPFR data without the issue of representativeness that using such a proxy entails. The next section is dedicated to describing said dataset, and to delving further into Gertler and Karadi’s method of identifying monetary policy shocks in a VAR.
1.5 Concluding comments