The impact of iodinated contrast media in hospital wastewater on
drinking water quality in North Carolina
Lauren Sprouse
Honors Thesis ENHS
Department of Environmental Sciences and Engineering Gillings School of Global Public Health
The University of North Carolina at Chapel Hill May, 2019
Approved:
__________________________________ Dr. Howard Weinberg (Advisor)
__________________________________ Dr Louise Ball (Reader)
ABSTRACT
Iodinated trihalomethanes (iodo-THMs) are an unregulated class of disinfection
byproduct (DBP) of increasing public health concern due to their elevated toxicity in comparison to regulated THMs, even at their lower occurrence concentrations. Iodinated contrast media (ICM), specifically iohexol because of its prevalence in North Carolina, are a major source of iodine in surface waters that receive wastewater effluent due to their biological inactivity and persistence through wastewater treatment. Many of these waters feed downstream drinking water treatment plants (DWTPs). This study investigated whether the presence of iohexol in drinking water sources can lead to the formation of iodo-THMs in disinfected drinking water impacted by upstream medical waste discharges by determining the conditions under which iohexol releases iodine to form iodo-THMs and applying equivalent conditions to natural waters and DWTP samples. Using tryptophan as a surrogate for natural organic matter (NOM) in surface waters, reactions with chlorine in the presence and absence of up to 5 mg/L iohexol formed only chloroform, while similar reactions involving monochloramine yielded no detectable THMs. Samples collected from four points in a DWTP were characterized and confirmed the presence of tryptophan-like NOM, associated with wastewater effluent, in each sample. Subsequent reactions of source water, post-powdered activated carbon (PAC), and post-ozonation samples with
chlorine and monochloramine (target disinfectant residual of 3 mg/L as Cl2) in the presence and absence of 5 mg/L iohexol were evaluated to determine iodo-THM formation. Chlorination of samples showed formation of chloroform, bromodichloromethane, and dibromochloromethane, as well as two iodo-THMs, dichloroiodomethane and bromodiiodomethane, regardless of iohexol addition, while chlorodiiodomethane formed only after chlorination of source water in the
ACKNOWLEDGMENTS
I would like to thank my advisor, Dr. Howard Weinberg, who provided vision, guidance and feedback on the development and completion of this research project and paper. I would also like to thank my mentor, Kirsten Studer, for her continuing feedback and advice, both
TABLE OF CONTENTS
Page #
LIST OF TABLES ... 5
LIST OF FIGURES ... 6
INTRODUCTION ... 7
MATERIALS AND METHODS ... 14
RESULTS AND DISCUSSION ... 19
CONCLUSIONS ... 32
REFERENCES ... 35
APPENDIX A ... 38
Standard operating procedure for THM analysis ... 38
Chromatogram for 20 µg/L as iodo-THMs and 100 µg/L as THM4 standards ... 45
Calibration curves for THM4 and iodo-THMs ... 46
APPENDIX B ... 48
Standard operating procedure for ion chromatograph analysis ... 48
Chromatogram of 100 µg/L as iodide and iodate standard ... 53
Chromatogram of finished water sample ... 54
Chromatogram of finished water sample containing 100 µg/L as iodide and iodate matrix spike55 Iodate calibration curve ... 56
APPENDIX C ... 57
Standard Operating Procedure for Total/Dissolved Organic Carbon (TOC/DOC) and Total Nitrogen (TN) analysis in aqueous samples using the Shimadzu TOC-VCPH and TOC-VCPN Analyzer ... 57
LIST OF TABLES
Table 1 – Common intravenous drugs and their maximum dosage. (page 11)
Table 2 – THM 4 and iodo-THMs calibration standards and quantitation limits. (page 17) Table 3 – 24-hour disinfectant demand test results for reactions of chlorine with 15 mg/L tryptophan in the presence and absence of 5mg/L iohexol. (page 19)
Table 4 – 24-hour disinfectant demand test results for reactions of different doses of
monochloramine as total chlorine with 15 mg/L tryptophan in the presence and absence of 5 mg/L iohexol or 25 mg/L iodide. (page 20)
Table 5 – THM yield from reactions of chlorine, iohexol, and tryptophan. (page 20) Table 6 – Iodoform yield from reactions of monochloramine with tryptophan and varying concentrations of iodide. (page 21)
Table 7 – Total iodine concentrations in each DWTP sample. (page 22)
Table 8 – Dissolved organic carbon and total dissolved nitrogen concentrations in each DWTP sample. (page 23)
Table 9 – UV-254 and calculated SUVA values for each DWTP sample. (page 24)
Table 10 – EEM peak intensities of sampled waters using the peak-picking method. (page 25) Table 11 – THM characterization of DWTP samples. (page 26)
Table 12 – 24-hour chlorine demand test results for DWTP samples in the presence and absence of iohexol. (page 27)
Table 13 – 24-hour monochloramine demand test results (measured as total chlorine) for DWTP samples in the presence and absence of iohexol. (page 28)
Table 14 – 24-hour THM formation results for chlorination of DWTP samples in the presence and absence of iohexol. (page 29)
LIST OF FIGURES
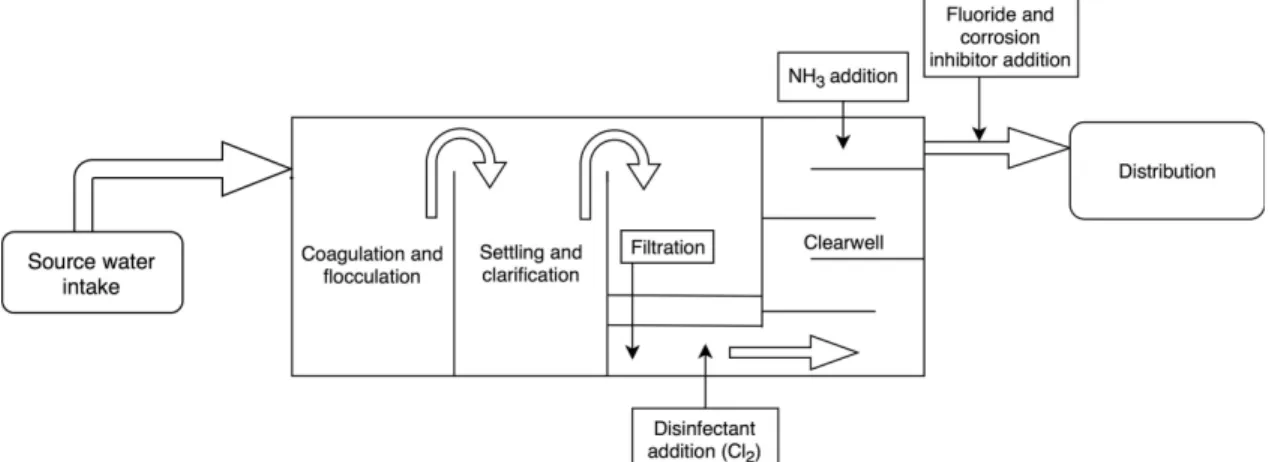
Figure 1 – Schematic of a conventional drinking water treatment plant (DWTP), from source water intake to distribution to consumers. (page 7)
Figure 2 – Chemical structure of tryptophan. (page 8)
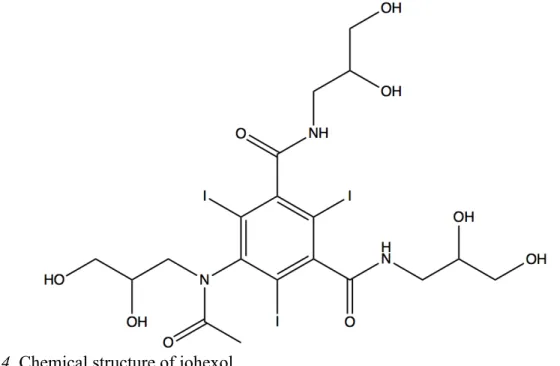
Figure 3 – Schematic showing how anthropogenic chemicals can reach drinking water.. (page 9) Figure 4 – Chemical structure of iohexol. (page 10)
Figure 5 – Formation of iodinated disinfection byproducts during chloramination processes (Adapted from Bichsel & von Gunten, 1999). (page 12)
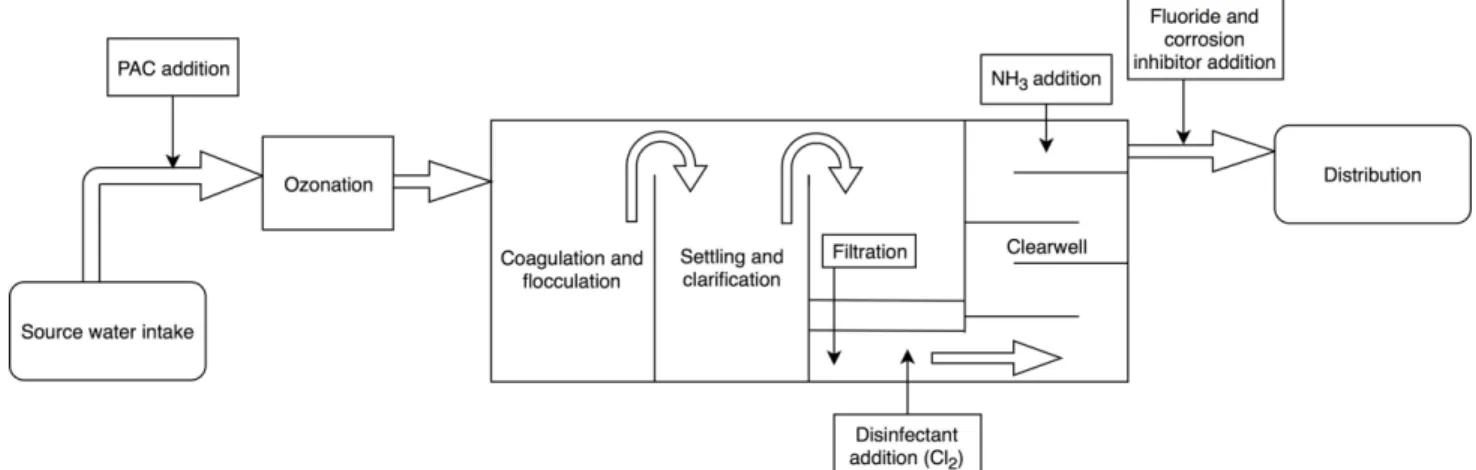
Figure 6 – Schematic of a drinking water treatment plant with powdered activated carbon and ozone used prior to conventional treatment. (page 13)
Figure 7 – Excitation-emission matrix for source water intake sample. (page 24) Figure 8 – Excitation-emission matrix for post-PAC sample. (page 24)
Figure 9 – Excitation-emission matrix for post-O3 sample. (page 25)
INTRODUCTION
Conventional drinking water treatment
Since the implementation of drinking water treatment systems in the United States during the early twentieth century, rates of waterborne diseases such as typhoid fever and cholera, caused by microbial contaminants, have dropped dramatically. Most modern treatment includes a combination of coagulation and flocculation, sedimentation, filtration, and disinfection processes in order to treat surface or groundwater before distribution of drinking water to consumers. Figure 1 shows a schematic of these processes during conventional treatment. After the source water is pumped to a treatment facility, coagulation and flocculation processes are used to allow larger particles to clump together and settle. The water is then disinfected with chlorine and passed through a filter to remove smaller particles, after which ammonia is added and reacts with residual chlorine to form chloramines and continue disinfection. Finished water moves through a clearwell for contact with the disinfectant, after which fluoride is added to promote dental health, and corrosion inhibitors protect pipes in the distribution system. Water is then distributed in response to demand by consumers.
Figure 1. Schematic of a conventional drinking water treatment plant (DWTP), from the source
water intake to the distribution system.
Disinfection is arguably the most important step in drinking water treatment in terms of protecting human health because of its ability to kill or deactivate pathogens that naturally occur in drinking water sources. The United States Environmental Protection Agency (U.S. EPA) established the Surface Water Treatment Rule (SWTR) in 1989, which requires public water systems to remove at least 99.9% of Giardia lamblia cysts, at least 99.99% of viruses, and at least 99% of Cryptosporidium during drinking water treatment from surface and groundwater sources (U.S. EPA, 2004). These criteria were established to protect against pathogens known to cause adverse human health effects.
4.0 mg/L as Cl2, and treatment plant compliance with this rule is based on running annual averages (USEPA, 2001).
Constituents of surface waters
Natural organic matter (NOM)
NOM exists in all surface drinking water sources and is a natural DBP precursor, though its properties can vary greatly depending on the water source. For example, changes in NOM concentrations in surface waters occur after heavy rainfall or runoff events. Humic substances, which include the organic compounds found in soil and sediment, constitute the majority of organic matter in natural waters – on average, up to 80% of the total dissolved organic carbon (DOC) (Boggs et al., 1985; Reuter & Perdue, 1977). DOC concentrations vary from less than 1 to greater than 50 mg/L as C in natural waters (Thurman, 1985). Amino acids are a subset of natural DOC and comprise a significant component – up to 13% – with concentrations generally varying from 100 to 500 µg/L in river water (Thurman, 1985). Due to amino acid prevalence, tryptophan has been used as a surrogate for nitrogen-containing NOM, which is associated with wastewater, in studies investigating DBP formation following disinfection of water (Owusu-Yaw, 1989; Li et al., 2019). The structure of tryptophan is shown in Figure 2 below.
Figure 2. Chemical structure of tryptophan.
Though no currently regulated DBPs contain nitrogen, those that do, such as
halonitromethanes, have been shown to be cytotoxic and genotoxic to mammalian cells and may threaten public health (Plewa et al., 2004a).
Pharmaceutical compounds in wastewater effluent
Pharmaceutical waste persistence through wastewater treatment
Figure 3. Schematic showing how anthropogenic chemicals can reach drinking water. The presence of large molecular weight compounds in pharmaceutical waste adds a contaminant load that conventional wastewater treatment was not designed to remediate. Most pharmaceuticals are biologically active and might, therefore, be at least partially removed during biological treatment processes; however, iodinated X-ray contrast media are an example of a high molecular weight pharmaceutical agent used in medical imaging that are not biologically active and persist to a large extent through wastewater treatment (Hollender et al., 2009). These large, complex molecules take time to break down, so other carbon sources in wastewater are more efficiently broken down as a microbial food source during wastewater treatment.
Pharmaceutical waste regulations
Iodine
Natural iodine sources
Formation of iodinated DBPs (iodo-DBPs) requires the presence of an iodine source in the water during disinfection. Iodine occurs naturally in many surface waters, though iodide and iodate are its only stable inorganic forms (Moran et al., 2002). Typical iodine concentrations in river water are about 5 µg/L (Moran et al., 2002), but concentrations above 50 µg/L can be found in some surface waters due to saltwater intrusion or the presence of particular rock formations (Weinberg et al., 2011). The main natural sources of iodine include oceanic iodine delivered atmospherically, iodine weathered from rocks, and iodine resulting from plant decomposition (Moran et al., 2002).
Anthropogenic iodine sources
Rivers located in areas with large amounts of water used for irrigation reported iodine concentrations greater than 30 µg/L, which could be due to agricultural techniques that disturb iodine present in rocks and soil (Moran et al., 2002). Iodine may also be introduced into the environment due to its presence in fertilizers, herbicides, and pesticides, as well as during nuclear fuel processing (Moran et al., 2002).
Another major anthropogenic source of iodine in surface waters is iodinated contrast media (ICM) from medical wastewater. ICM are common pharmaceuticals of large molecular weight used to improve soft tissue imaging, such as during computed tomography (CT) scans or magnetic resonance imaging (MRI). Table 1 below shows typical dosage concentrations of ICM in comparison to other pharmaceuticals. Iohexol, whose structure is shown in Figure 4, is one ICM commonly used in North Carolina that has previously been measured in surface waters (Duirk et al., 2011; Wendel et al., 2014). It has a total mass of 821.1 g/mol of which 46% is iodine.
Figure 4. Chemical structure of iohexol.
Pharmaceutical compound
Maximum dose Equivalent dose in average adult male
Reference Iohexol (ICM) 250 mL (no absolute
maximum dose)
75,000 mg Medscape (2019) Doxorubicin
(chemotherapy)
50 mg/m2 100 mg Cheesman & Shields
(2016)
Morphine 10 mg 10 mg PAMI (2016)
Vancomycin 500 mg 500 mg Medscape (2019)
ICM are dosed in extremely large concentrations and are designed to pass through the body without biotransformation; however, these properties also allow them to persist through wastewater treatment intact. Once discharged into surface waters, however, there is evidence that these agents break down as well as during oxidation once they enter DWTPs and release iodine, which reacts with disinfectants in the presence of NOM to produce toxic iodo-DBPs (Duirk et al., 2011; Kormos et al. 2011). There are no regulations currently in place to prevent these ICM from entering the wastewater system, so they constitute a significant anthropogenic iodine load in surface waters that receive treated effluent from municipal wastewater.
Bromine
Natural bromine sources
Bromine occurs naturally in both seawater and fresh water, with fresh water
concentrations ranging from trace amounts to about 0.5 mg/L (Al-Mutaz, 2000). Common forms of bromine in surface waters include its presence in soluble salts as bromide, hydrobromic acid, hypobromous acid, bromous and bromic oxyacids (Cotton & Wilkinson, 1962). Elevated bromide concentrations in surface waters may be due to bromine leaching from NOM in soil (Yuita et al., 1982).
Anthropogenic bromine sources
Major anthropogenic factors contributing to the presence of bromine in surface waters are the presence of wastewater, sewage system leaks, and pesticide use (Winid, 2015). Agricultural activities and the use of pesticides containing bromine are associated with increased bromine concentrations in surface waters (Shomar, 2006). Landfill leachate and surface waters near landfills have also been shown to have elevated bromine concentrations of up to 160 mg/L, though this occurs mainly in urban areas where landfill leachate can penetrate drinking water sources (Milosevic et al., 2012).
Disinfection byproducts
Regulated disinfection byproducts
Hundreds of cytotoxic and genotoxic DBPs have been identified, though only eleven which were identified first are currently regulated in the United States (USEPA, 2001). Current regulations are set to limit concentrations of four trihalomethanes (THMs), five haloacetic acids (HAAs), chlorite, and bromate in drinking water distributed to community and non-transient non-community water systems. The four regulated THMs (THM4) are chloroform,
individual toxicities of each compound. Previous studies have indicated an increased risk of bladder and colon cancers following THM exposure (Cantor et al., 1985; McGeehin et al., 1993; Black et al., 1996), as well as possible developmental and reproductive problems (Kramer et al., 1992; Bove et al., 1995). Exposure occurs not only when water is used for drinking purposes, but also during cooking, bathing, cleaning, and other daily activities that involve potable water use. THMs constitute a significant portion of total DBPs and are used as indicators for all potentially harmful compounds that form from the addition of chlorine to natural waters (CDC, 2016).
The 5 HAAs, monochloroacetic acid, dichoroacetic acid, trichloroacetic acid,
monobromoacetic acid, and dibromoacetic acid, are also regulated as a running annual average with an MCL of 0.060 mg/L as total HAAs (USEPA, 2001). Bromate is regulated in DWTPs that use ozone as a disinfectant with an MCL of 0.010 mg/L, and chlorite is regulated in DWTPs that use chlorine dioxide as a disinfectant with an MCL of 1.0 mg/L (USEPA, 2001).
Iodinated disinfection byproducts
Iodo-DBPs are not currently regulated; however, they have been shown to have higher geno- and cytotoxicity compared to regulated DBPs, even at their lower occurrence
concentrations (Plewa et al., 2004b; Richardson et al., 2008). Iodo-DBPs are most likely to form during chloramine disinfection, and to a lesser extent by chlorine and then ozone disinfection (Bichsel & von Gunten, 1999). Figure 5 shows a schematic representation of the formation of iodo-DBPs during chloramination.
Figure 5. Formation of iodinated disinfection byproducts during chloramination processes
(Adapted from Bichsel & von Gunten, 1999).
Iodo-DBP formation is dependent on the presence of both an iodine source and NOM during drinking water treatment. Monochloramine reacts with iodide to form hypoiodous acid, which then reacts with NOM to form iodo-DBPs (Bichsel & von Gunten, 1999).
The use of chloramine as a secondary disinfectant in drinking water has become more widespread in order to reduce the levels of regulated DBPs and decrease their public health impact; however, the risk of iodo-DBP formation in drinking water increases as chloramine use becomes more prevalent (Bichsel & von Gunten, 1999). Both Wendel et al. (2014) and Duirk et al. (2011) showed that reactions of ICM with chlorine in the absence of natural organic matter formed only trace amounts of iodo-DBPs. In reactions of ICM with chlorine in the presence of organic matter, iodate is the major iodine sink, while iodo-DBPs are an iodine sink for reactions with monochloramine (Bichsel & von Gunten, 1999). Because iodo-DBPs are not regulated, the increased use of chloramine could potentially increase drinking water toxicity and threaten human health.
Additional treatment processes are often used in the treatment of surface waters with compromised quality, such as during algal blooms that produce compounds impacting taste and odor. In addition to chlorine and chloramine, ozone is another commonly used disinfectant that treats taste and odor in drinking water, but all disinfectants can react with precursors in the water to form DBPs. Powdered activated carbon (PAC) and ozone are two alternative treatment
methods employed to improve water quality beyond conventional treatment. Figure 6 shows a schematic of one train of alternative treatments incorporated into conventional treatment. After the source water is pumped to this treatment facility, PAC is added to begin removal of NOM and to treat taste and odor. Ozone is then used as a pre-disinfectant to remove color, oxidize organic compounds, and continue taste and odor treatment.
Figure 6. Schematic of a drinking water treatment plant with powdered activated carbon and
ozone used prior to conventional treatment.
PAC and ozone have been shown to remove 86% and 90%, respectively, of the total load of analyzed pharmaceuticals from hospital wastewater (Kovalova et al., 2013). In addition to removing pharmaceutical compounds, ozone also acts as a disinfectant, while PAC only provides removal of some micropollutants (Kovalova et al., 2013). These alternative treatment methods can be employed in DWTPs that intake from the same water source to which wastewater treatment plants discharge upstream in order to further remove pharmaceutical contaminants.
Objectives
The lack of regulations on iodo-DBPs in drinking water and medical wastewater
discharges, in addition to the increasing use of monochloramine as a disinfectant and increasing use of ICM for medical imaging, lead to an increased iodine load in surface waters that is not easily remediated by wastewater treatment. This study investigates whether the presence of iohexol in drinking water sources can lead to the formation of iodo-THMs, a subset of the total iodo-DBPs, in disinfected drinking water impacted by upstream medical waste discharges by addressing the following objectives:
1) Determine the conditions under which iohexol releases iodine to form iodo-THMs 2) Determine if these conditions are applicable to natural waters and drinking water
treatment
MATERIALS AND METHODS
Chlorine and monochloramine solutions preparation
The sodium hypochlorite stock solution (Fisher Scientific, Pittsburgh, PA) was
standardized prior to each use following Standard Method 4500-Cl B (Franson et al., 1999)in order to determine the free chlorine concentration. A solution of 0.01 N sodium thiosulfate (Fisher Scientific, Pittsburgh, PA) was titrated into a 50-mL Erlenmeyer flask containing 5 mL acetic acid (Fisher Scientific, Pittsburgh, PA), 1 g potassium iodide (Fisher Scientific, Pittsburgh, PA), and 100 µL NaOCl stock until the yellow color almost dissipated. 1 mL of starch indicator solution (Alfa Aesar, Ward Hill, MA) was then added to the flask, creating a blue color, and titration continued until the blue color disappeared. Free chlorine concentration was then calculated using the formula:
𝑚𝑔 𝐶𝑙 𝑎𝑠()*
+,=
.∗0∗12.42 5
where A = volume in mL of titrant used to titrate to endpoint, N = Normality of sodium thiosulfate titrant (0.01 N), and V = volume of NaOCl stock sample (0.1mL).
Monochloramine solutions were prepared by dissolving 0.084 g ammonium sulfate (Fisher Scientific, Pittsburgh, PA) in 50 mL laboratory grade water (LGW) (Dracor Water Systems, Durham, NC, USA), transferring to a 250-mL amber glass bottle with a stir bar and adjusting to pH 8 with 2 M NaOH (Fisher Scientific, Pittsburgh, PA). 1.25 mL of previously standardized NaOCl stock was then added dropwise to the solution slowly while stirring on a magnetic stir plate. Monochloramine (NH2Cl) and dichloramine (NHCl2) concentrations were determined using a Hewlett-Packard UV-Vis spectrophotometer (Palo Alto, CA) set to analyze at wavelengths of 245 and 295 nm, which correspond with the maximum absorption wavelengths for mono- and dichloramine, respectively. UV outputs were then translated into mono- and dichloramine concentrations using Beer’s law:
𝐴 = 𝜀𝐿𝑐
where A = absorbance, 𝜀 = molar absorptivity (𝜀NH2Cl = 445 L mol-1 cm-1 at 245 and 14 L mol-1 cm-1 at 295 nm, 𝜀NHCl2 = 208 L mol-1 cm-1 at 245 nm and 267 L mol-1 cm-1 at 295 nm), L = length of path traveled by light (1-cm cuvettes), and c = solution concentration (M)
Chlorine and monochloramine demand tests with tryptophan as surrogate NOM
Preliminary demand tests were conducted using a HACH DR/890 datalogging
In these experiments, tryptophan was at an initial concentration of 15 mg/L to reflect a total organic carbon (TOC) concentration of about 10 mg/L as C, a level that is at the mid to high end in U.S. surface waters (Thurman, 1985). Iohexol was at an initial concentration of 5 mg/L in order to increase THM formation potential above detection limits. Disinfectants were dosed at several concentrations in order to attain the target residual in the selected time frame. Chlorine doses ranged from zero to 65 mg/L as Cl2 because of the high demand for chlorine by amino acids (Hureiki et al., 1994), while monochloramine doses ranged from zero to only 15 mg/L as Cl2 because there is less demand for monochloramine than chlorine by organic carbon in the same reaction timeframe (Bichsel & von Gunten, 1999).
Subsequent reactions were performed between monochloramine, tryptophan, and a gradient of iodide doses in order to determine iodo-THM formation from iodide rather than iohexol. These reactions were performed with monochloramine and not chlorine because monochloramine has been shown to form iodo-DBPs from reactions with iodide in the presence of organic matter, while the major iodine sink for similar reactions with chlorine is iodate (Bichsel & von Gunten, 1999). An iodide stock solution was prepared by dissolving 0.143 g potassium iodide (J.T. Baker Chemical Co., Phillipsburg, NJ) in 100 mL LGW for a stock concentration of 1.09 g/L as I. Iodide doses ranged from 0-25 µg/L as I to reflect concentrations typical in surface waters (Moran et al., 2002; Weinberg et al., 2011). Tryptophan was at a
concentration of 15 mg/L, and monochloramine was dosed at 12 mg/L as Cl2 as this was the dose required for a 24-hour residual of 3 mg/L as Cl2, as determined by demand tests.
Reactions were performed headspace-free in 40-mL glass screw cap sample vials with open top caps and PTFE-lined silicone septa to prevent volatilization of any THM byproducts. After a 24-hour reaction, disinfectant residuals were measured as total chlorine using the HACH colorimeter, and samples for other analyte analysis were quenched with ascorbic acid to prevent change in their levels. Chlorine and monochloramine demands were calculated by subtracting the residual disinfectant concentration from the concentration dosed.
Collection and storage of water samples
Samples were collected March 1st, 2019 from a drinking water treatment plant (DWTP) at the following four points in the treatment process: source water intake, post-powdered activated carbon (post-PAC), post-ozonation (post-O3), and finished water. Samples were collected for water characterization as well as for chlorine and monochloramine demand tests in the presence and absence of iohexol in 1-L amber glass bottles (Supelco, Bellefonte, PA) with screw caps and PTFE-lined silicone septa and were transported in a cooler with ice packs for preservation. Travel blanks containing only LGW without quenching agent were transported to the sample site as a control in order to mimic transportation and preservation conditions.
Another set of samples was collected on the same date from the same four points in 40-mL clear glass vials (I-Chem, Pasadena, TX) headspace-free for THM analysis. Approximately 25 mg ascorbic acid (Fisher Scientific, Pittsburgh, PA) was added to the 40-mL vials prior to sample collection as a disinfectant quenching agent to eliminate further THM formation. One sample of finished water had also been collected February 28th, 2019 in a 40-mL clear glass headspace-free vial containing approximately 25 mg ascorbic acid to compare THM formation in finished water from February to that from March, after the DWTP switched to chlorine
disinfectant quenching agent. All samples were filtered through 0.45 µm polyamide membrane filters (Sartorius, Wood Dale, IL) and stored in the dark at 4° C until analysis.
Water sample characterization
Samples were analyzed for iodide and iodate using a Dionex (Sunnyvale, CA) ion chromatograph (IC) with Eluent Degas module, Gradient Pump module, conductivity detector, and Advanced Computer Interface. Mobile phase and acid regenerate solutions were prepared prior to IC sample analyses. The mobile phase was prepared as a solution of 4.8 mM Na2CO3 (Mallinckrodt, Dublin, Ireland) and 1.0 mM NaHCO3 (Mallinckrodt, Dublin, Ireland) in LGW, and the regenerate was prepared by filtering 4 L of LGW and adding 5.5 mL of 36.8 N H2SO4 (Fisher Scientific, Pittsburgh, PA) for a concentration of 50 mN H2SO4. For these analyses, the chromatography was isocratic through a 4x250 mm AS-22 column (Dionex, Sunnyvale, CA) with a 4x50 mm AG22 guard column (Dionex, Sunnyvale, CA) at a flow rate of 1.0 mL/minute.
Samples were also analyzed for dissolved organic carbon (DOC) and total dissolved nitrogen (TDN) using a Shimadzu TOC-VCPH and TOC-VCPN Analyzer (Columbia, MD). DOC and TDN refer to concentrations of organic carbon and nitrogen after samples were passed through 0.45 µm polyamide membrane filters. The DOC stock standard was prepared as a solution of 1018 mg/L as C by dissolving 0.54095 g potassium hydrogen phthalate (Sigma-Aldrich, Darmstadt, Germany) in 250 mL LGW. The TDN stock standard was prepared as a solution of 1000 mg/L as N by dissolving 1.806 g potassium nitrate (EM Science, Gibbstown, NJ) in 250 mL LGW to prepare the calibration curve. Hydrochloric acid solution was prepared by adding 16.4 mL concentrated HCl (12.1 N) (Fisher Scientific, Pittsburgh, PA) to 100 mL LGW. A working solution was prepared as 100 mg/L as C, 100 mg/L as N, and 0.05 M HCl for pH adjustment to create calibration points.
Inductively coupled mass spectrometry (ICP-MS) with an SC2 DX Auto Sampler and Nexion computer software (Perkin-Elmer, Waltham, MA) was used to determine total iodine concentrations. ICP-MS data were collected from four 2017 sampling events of the same DWTP at the same sampling locations. Absorbance spectra were collected from each sample using a UV-Vis spectrophotometer (Hewlett-Packard, Palo Alto, CA) in order to calculate specific ultraviolet absorbance (SUVA), which is found by dividing the sample absorbance at 254 nm by its DOC concentration. Excitation emissions matrix (EEM) measurements on a Fluorolog-321 spectrofluorometer with charge-coupled device (Horiba, Kyoto, Japan) determined the presence of amino acids, specifically in the tryptophan-like region of EEMs (λex/λem∼220/303 nm), in each sample. The peak-picking method for fluorescence was used to identify three fluorophores common in surface waters: Peak A (hydrophobic acid fraction) and Peak C (humic-like fraction), which are attributed to natural fluorescence once excited in surface waters (Coble, 1996), and Peak T (protein-like fraction), which is attributed to amino acid-like organic matter (Stedmon et al., 2003).
Chlorine and monochloramine demand tests with sampled waters
Demand tests were also conducted to identify the correct dose of chlorine and monochloramine disinfectants to react with the DWTP water samples in the presence and absence of iohexol in order to leave a 24-hour disinfectant residual of about 3 mg/L as Cl2. Similar procedures were followed to those involving tryptophan as the surrogate NOM, but using DWTP sampled waters instead of a tryptophan solution. An iohexol working solution was
IL). From the working solution, iohexol was spiked into sampled waters at a concentration of 5 mg/L to increase the potential for release of iodine during reactions with disinfectants. Another set of reactions between sampled waters and spiked disinfectant in the absence of iohexol was used as a control. After 24 hours, disinfectant residuals were measured and samples prepared for THM analysis were quenched of residual disinfectant with ascorbic acid to prevent further THM formation after the desired reaction time.
THM analysis
THM analysis was performed on a Hewlett-Packard HP 6890 Series gas chromatograph (Hewlett-Packard, Palo Alto, CA) with micro electron capture detector (GC-µECD) after liquid-liquid extraction (LLE) of aqueous samples with methyl tert-butyl ether (MtBE) (EMD
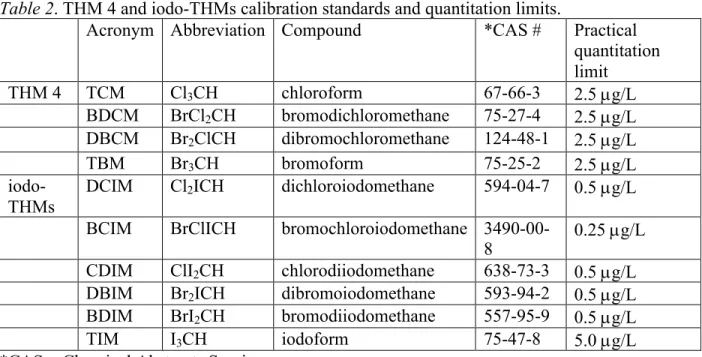
Chemicals, Burlington, MA). Table 2 shows the THMs analyzed in this study and their practical quantitation limits, which was their lowest detectable calibration point. THM 4 standards were in a calibration mix of 2000 µg/mL as each THM in methanol (Supelco, Bellefonte, PA), and iodo-THMs standards were prepared at 5000 mg/L as each iodo-THM (Orchid Cellmark, New Westminster, British Columbia, Canada) in MtBE.
Table 2. THM 4 and iodo-THMs calibration standards and quantitation limits.
Acronym Abbreviation Compound *CAS # Practical quantitation limit
THM 4 TCM Cl3CH chloroform 67-66-3 2.5 µg/L
BDCM BrCl2CH bromodichloromethane 75-27-4 2.5 µg/L DBCM Br2ClCH dibromochloromethane 124-48-1 2.5 µg/L
TBM Br3CH bromoform 75-25-2 2.5 µg/L
iodo-THMs DCIM Cl2ICH dichloroiodomethane 594-04-7 0.5 µg/L BCIM BrClICH bromochloroiodomethane
3490-00-8 0.25 µg/L CDIM ClI2CH chlorodiiodomethane 638-73-3 0.5 µg/L DBIM Br2ICH dibromoiodomethane 593-94-2 0.5 µg/L BDIM BrI2CH bromodiiodomethane 557-95-9 0.5 µg/L
TIM I3CH iodoform 75-47-8 5.0 µg/L
*CAS = Chemical Abstracts Service
Samples were extracted using LLE as described in the standard operating procedures (SOP) for halogenated volatiles presented in Appendix A. Briefly, all reaction and calibration point samples were measured to 30 mL in 40-mL glass vials and adjusted to pH 3.5 with 0.2 N H2SO4. 3 mL of extracting solvent (50 µg/L 1,2-dibromopropane in MtBE, 99+% pure, Sigma-Aldrich, Darmstadt, Germany) was added to each sample using a solvent dispenser bottle. Approximately 6 g sodium sulfate (Mallinckrodt, Dublin, Ireland) pre-baked at 400° C was then added to each sample and shaken vigorously for one minute. The samples were allowed to settle for 5 minutes before transferring the extract into 2-mL autosampler vials (Supelco, Bellefonte, PA, USA). Extract analysis was followed on the GC-µECD after a splitless injection volume of 2
RESULTS AND DISCUSSION
Demand test results for tryptophan reactions
The goal of these experiments was to identify the correct dose of chlorine and monochloramine to react with tryptophan and iohexol in LGW in order to leave a 24-hour residual of about 3 mg/L as Cl2. Table 3 shows the gradient of chlorine doses reacted with 15 mg/L tryptophan in the presence and absence of 5 mg/L iohexol and their associated 24-hour total chlorine residuals.
Table 3. 24-hour disinfectant demand test results for reactions of chlorine with 15 mg/L
tryptophan in the presence and absence of 5 mg/L iohexol.
Chlorine dose (mg/L as Cl2)
Chlorine residual after reaction with tryptophan (mg/L as Cl2)
Chlorine residual after reaction with tryptophan
and iohexol (mg/L as Cl2)
Chlorine demand by tryptophan (mg/L as Cl2)
0 0.0 0.0 0.0
30 1.3 - -
60 1.9 - -
65 4.4 2.3 60.6
The 65 mg/L as Cl2 dose left a free chlorine residual of 4.4 mg/L as Cl2 after a 24-hour reaction with tryptophan, which was close to the target residual of 3 mg/L as Cl2 and the regulated MRDL of 4.0 mg/L as Cl2 for chlorine (USEPA, 2001). Because the HACH
colorimeter can only measure total chlorine concentrations up to 2.0 mg/L as Cl2, samples had to be diluted prior to measuring residuals. This dose left close enough to the target residual and was, therefore, used in subsequent reactions with both tryptophan and iohexol in order to determine the formation potential of THMs. Because the 65 mg/L as Cl2 dose left a residual close to the target value, other doses were excluded from subsequent reactions with tryptophan and iohexol, which is why data are not included Table 3. After the reaction of chlorine with tryptophan and iohexol, the free chlorine residual was 2.3 mg/L as Cl2, which is close to the target residual of 3 mg/L as Cl2.
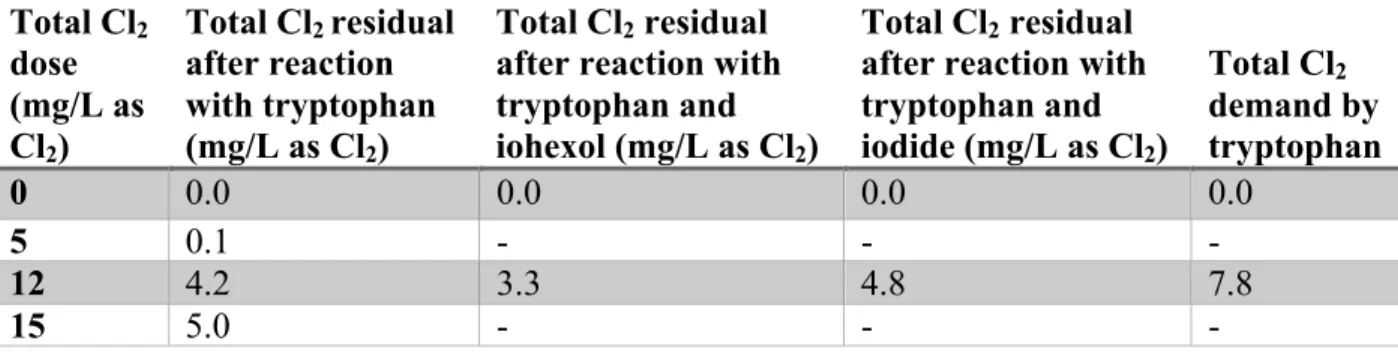
Table 4. 24-hour disinfectant demand test results for reactions of different doses of
monochloramine as total chlorine with 15 mg/L tryptophan in the presence and absence of 5 mg/L iohexol or 25 µg/L iodide.
Total Cl2
dose (mg/L as Cl2)
Total Cl2 residual
after reaction with tryptophan (mg/L as Cl2)
Total Cl2 residual
after reaction with tryptophan and
iohexol (mg/L as Cl2)
Total Cl2 residual
after reaction with tryptophan and iodide (mg/L as Cl2)
Total Cl2
demand by tryptophan
0 0.0 0.0 0.0 0.0
5 0.1 - - -
12 4.2 3.3 4.8 7.8
15 5.0 - - -
The 12 mg/L as Cl2 dose left a total chlorine residual of 4.2 mg/L as Cl2 after reacting for 24 hours with tryptophan, which is close to the target residual of 3 mg/L as Cl2. This dose was chosen for subsequent reactions with tryptophan and either iohexol or iodide in order to determine THM formation potential, which is why data from other doses are not included in Table 4. After reactions of monochloramine, tryptophan, and iohexol, the total chlorine residual was 3.3 mg/L as Cl2, and 4.8 mg/L as Cl2 in the reaction with iodide instead of iohexol. These residuals are also close to both the target residual of 3 mg/L as Cl2 and the MRDL of 4.0 mg/L as Cl2 for monochloramine (USEPA, 2001). The demand was 1.5 mg/L as Cl2 greater in reactions with iohexol than in iodide reactions, which could be due to the presence of additional organic matter within iohexol that could react with monochloramine to increase demand. The iodide concentration was also about 92 times lower than the concentration of iohexol as I. These test results show that there was more demand for chlorine than monochloramine by tryptophan, which is consistent with previous kinetics studies indicating a faster reaction with chlorine than monochloramine by NOM (Bichsel & von Gunten, 1999).
THM analysis results for tryptophan reactions
When the reaction conditions for the target residual in the demand tests were repeated, monochloramine at 12 mg/L as Cl2 with tryptophan at 15 mg/L in the presence and absence of iohexol at 5 mg/L did not yield any detectable THM4 or iodo-THMs; however, reactions of chlorine at 65 mg/L as Cl2 with these concentrations of tryptophan and iohexol yielded chloroform (Cl3CH) as shown in Table 5.
Table 5. THM yield from reactions of chlorine, iohexol, and tryptophan.
Chlorine dose Iohexol dose Tryptophan dose Cl3CH yield*
0 mg/L 5 mg/L 15 mg/L < 2.5 µg/L
65 mg/L 5 mg/L 15 mg/L 309 ± 30 µg/L
*Concentration values averaged from analysis of duplicate samples.
Iodide is rapidly oxidized by chlorine to form HOI which can then further react with excess HOI to form iodate, but both HOI and HOCl can react with tryptophan to form iodinated and
chlorinated THMs (Bichsel & von Gunten, 1999). However, the presence of HOCl in large excess compared to any HOI that could have formed from the iodine released by iohexol caused chloroform to form at much higher concentrations than iodinated THMs. Under these reaction conditions, iodine was not released from iohexol to form THMs. In order to form iodo-THMs, chloroform would have to either be substituted by HOI, or HOI could partially react with tryptophan to form iodo-THMs rather than be furthered to iodate.
Reactions of chlorine or monochloramine with iohexol in the absence of tryptophan did not produce any detectable THM4 or iodo-THMs. This is consistent with previous studies suggesting that a source of organic matter must be present in order to form THMs (Duirk det al., 2011; Wendel et al., 2014).
Table 6 shows THMs formed after a 24-hour reaction of monochloramine, tryptophan, and varying concentrations of iodide.
Table 6. Iodoform yield from reactions of monochloramine with tryptophan and varying
concentrations of iodide.
Monochloramine dose Iodide dose Tryptophan dose I3CH yield*
12 mg/L 0 µg/L 15 mg/L < 1.0 µg/L
12 mg/L 2.0 µg/L 15 mg/L < 1.0 µg/L
12 mg/L 25 µg/L 15 mg/L 12.3 ± 1.6 µg/L
*Concentration values averaged from analysis of duplicate samples.
Iodoform was the only THM formed and at a concentration of 12.3 µg/L after a 24-hour reaction between monochloramine, tryptophan, and 25 µg/L iodide. An iodoform concentration of 12.3 µg/L as iodoform is equivalent to 11.9 µg/L as I, which translates to 47.6% yield of the original iodide dose. The equivalent yield from a 2.0 µg/L iodide dose in Table 6 above would be 0.98 µg/L as iodoform, which is below its practical quantitation limit of 5.0 µg/L.
Because reactions between the same dose of monochloramine with iohexol rather than iodide did not form THMs, these results suggest that, based on percent yield from the iodide reactions, iohexol would have to release at least 10.2 µg/L iodide in a reaction with
monochloramine at 12 mg/L and tryptophan at 15 mg/L in order to form a detectable
concentration of iodoform. An iohexol concentration of 5 mg/L as iohexol is equivalent to 2.3 mg/L as I. In reactions with monochloramine and tryptophan, iohexol released less than 0.4% of its iodine (10.2 µg/L iodide needed divided by the iohexol concentration of 2.3 mg/L as I) and did not form THMs.
Iodide is also oxidized to HOI by monochloramine, though this reaction is much slower than oxidation by chlorine (Bichsel & von Gunten, 1999). This gives more potential for the formation of iodo-THMs because HOI reacts with available tryptophan rather than other HOI to form iodate. This is seen in the formation of iodoform from the reaction of monochloramine, iodide, and tryptophan. The pathway of iodo-DBP formation from monochloramine can be seen in Figure 3.
Water characterization
location points can be seen in Figure 4. Water characterization was carried out in order to describe the water quality changes after treatment steps within the plant.
Ion chromatography results
Ion chromatography was used to determine concentrations of iodide and iodate in the DWTP samples. Sample chromatograms and calibration curves can be found in Appendix B. Samples were matrix-spiked with 100 µg/L as iodate and the chromatograms compared with those for a 100 µg/L as iodate standard and the unspiked samples. Though there were
chromatographic peaks present in the DWTP samples at a similar retention time to that of the iodate standard, it is clear from the matrix spikes where there was no increase in area in comparison to the unspiked samples that iodide and iodate were not detectable in the samples. These chromatograms and raw data are shown in Appendix B.
Total iodine
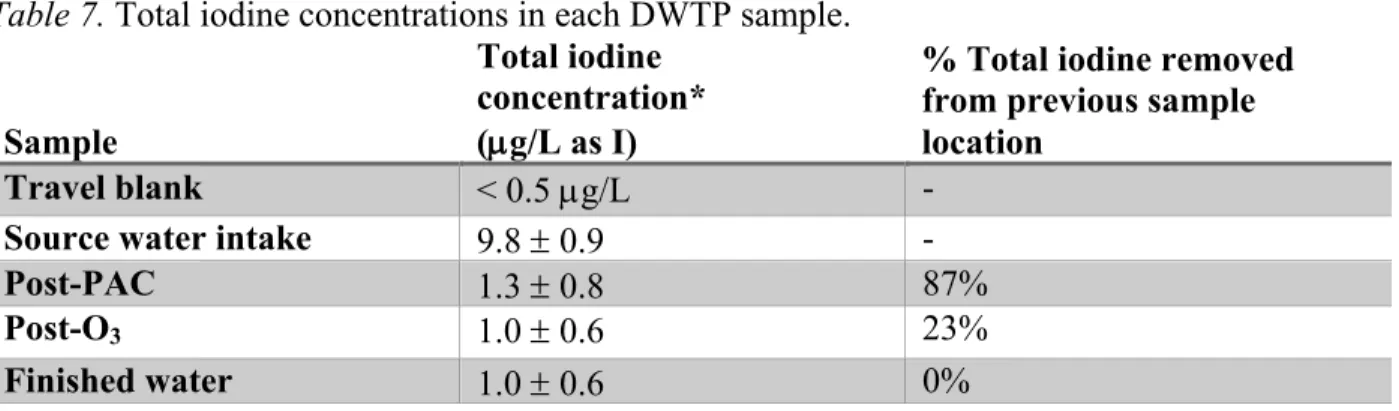
Total iodine concentrations were determined using ICP-MS to analyze samples collected from the same DWTP and sample locations in another project in order to show trends of total iodine removal following each treatment step. Though this is historical data, overall trends in total iodine should remain the same. Table 7 shows total iodine concentrations from ICP-MS analysis in each DWTP sample.
Table 7. Total iodine concentrations in each DWTP sample.
Sample
Total iodine concentration* (µg/L as I)
% Total iodine removed from previous sample location
Travel blank < 0.5 µg/L -
Source water intake 9.8 ± 0.9 -
Post-PAC 1.3 ± 0.8 87%
Post-O3 1.0 ± 0.6 23%
Finished water 1.0 ± 0.6 0%
*Concentration values averaged from 3 replicates in a 2017 sampling event
Although iodide and iodate were not detectable in samples, because their detection limit was 25 µg/L, they could constitute a portion of the total iodine that was not able to be seen during ion chromatography analysis. PAC is the first treatment step following intake and accounted for removal of 87% of the total iodine present in the source water. PAC removes organic compounds, which would significantly decrease total iodine concentrations if the majority of iodine is contained within organic compounds. PAC is not removed prior to
ozonation, so the increased contact time between PAC and organics during ozonation may result in lower total iodine concentrations. Ozonation does not physically remove organics, but it may transform DBP precursors as well as transform PAC into a form that makes adsorption easier. Dissolved organic carbon and total dissolved nitrogen
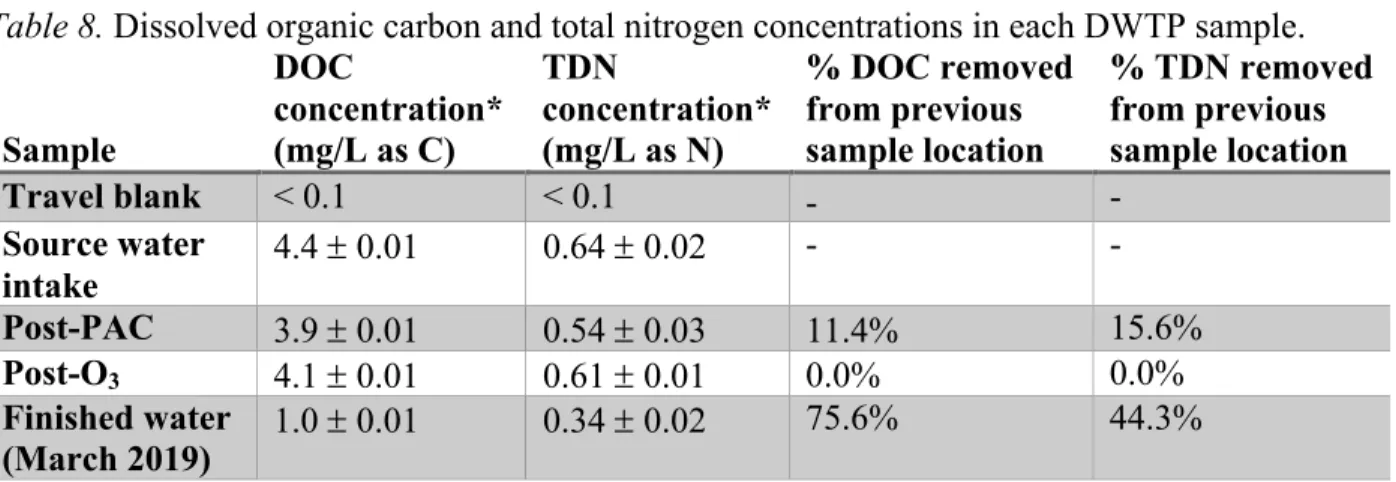
Table 8. Dissolved organic carbon and total nitrogen concentrations in each DWTP sample.
Sample
DOC
concentration* (mg/L as C)
TDN
concentration* (mg/L as N)
% DOC removed from previous sample location
% TDN removed from previous sample location
Travel blank < 0.1 < 0.1 - -
Source water
intake 4.4 ± 0.01 0.64 ± 0.02
- -
Post-PAC 3.9 ± 0.01 0.54 ± 0.03 11.4% 15.6%
Post-O3 4.1 ± 0.01 0.61 ± 0.01 0.0% 0.0%
Finished water
(March 2019) 1.0 ± 0.01 0.34 ± 0.02
75.6% 44.3%
*Concentration values averaged from duplicate samples
The source water had the highest levels of DOC and TDN at 4.4 mg/L as C and 0.64 mg/L as N, which was expected because this sample had not yet undergone any treatment process. Typical DOC concentrations in lakes range from less than 1 mg/L to about 25 mg/L as C (Thurman, 1985), and TDN concentrations in surface waters ranged from about 0.5 mg/L to 7.0 mg/L as N in a study of the Mississippi river basin (Rus et al., 2012). Though samples were collected during a period of heavy and prolonged rainfall, DOC and TDN were at the low end of the range for surface waters.
Each treatment step has an associated change in water quality that is reflected in the DOC and TDN concentration changes from source water to finished water. DOC and TDN generally decrease as treatment progresses. PAC is used to remove NOM and treat taste and odor problems early in the treatment process and is subsequently removed during sedimentation; however, some particulate PAC may persist through the treatment. Because PAC is not removed from the water before continuing other treatments and ozonation does not physically remove particulates, it is not abnormal for DOC to increase or remain the same following PAC addition.
The most significant change in DOC and TDN concentrations was seen in finished water. Treatment steps between ozonation and finished water are coagulation and flocculation, settling and clarification, filtration, and disinfection. Previous studies have indicated 60-80% removal of DOC by coagulation and flocculation (Gone et al., 2009; Heiderscheidt et al., 2016), with the hydrophobic fractions more efficiently removed (Bolto et al., 1999). This would account for the significant removal of DOC seen between ozonation and finished water. Total organic carbon (TOC) concentrations in finished water were reported by the DWTP in 2017 as having a removal ratio of up to 1.9 (Personal Communication, 2019), which would indicate a finished water DOC concentration of 2.3 mg/L as C if the source water had a DOC concentration of 4.4 mg/L. A DOC concentration of 1.0 mg/L as C was measured for the finished water sample collected in March 2019, and this decreased concentration in comparison to average DOC concentrations from the DWTP may be due to heavy rainfall which likely diluted the DOC in the plant waters. Also, this measurement was based on only one sampling event, while the DWTP computes removal efficiencies as averages of multiple samples collected in each reporting period. UV-254 and SUVA
removal (Weishaar et al., 2003). Table 9 shows UV-254 absorbance values obtained for each DWTP sample. SUVA was calculated by dividing the UV-254 value by the DOC concentration shown in Table 8, and then multiplying by 100 to convert cm to m.
Table 9. UV-254 and calculated SUVA values for each DWTP sample.
Sample UV-254 (cm-1) SUVA (L/mg-m)
Travel blank 0.0 -
Source water intake 0.200 4.54
Post-PAC 0.169 4.33
Post-O3 0.132 3.19
Finished water (March 2019) 0.0136 1.36
SUVA is a water quality parameter that is normalized for DOC in each sample. A lower SUVA value indicates the presence of lower molecular weight DOC, and SUVA is also
correlated with the hydrophobic organic acid fraction of DOC (Spencer et al., 2012). SUVA decreased following each treatment step, indicating aromatic DOC removal. The low SUVA value for the finished water sample compared to other sampling points indicates higher finished water quality than at other points in the treatment plant due to DOC removal.
Excitation-emission matrices
EEMs are three-dimensional plots that show fluorescence intensity at a given excitation and emission wavelength and are useful for characterizing DOC in an aqueous sample. Figures 7-10 below are EEMs of each filtered DWTP sample. On each EEM, the x-axis represents emission wavelength in nm, the y-axis represents excitation wavelength in nm, and the z-axis (color) represents peak intensity in Raman units (RU). The peaks labeled A, C, and T are each correlated with a different component of DOC common in surface waters. Peak A corresponds with the hydrophobic acid fraction, Peak C corresponds with the humic-like fraction, and Peak T corresponds with the hydrophobic base or protein-like fraction. Peak T is correlated with
wastewater effluent due to the presence of proteins and amino acids in human waste.
Figure 9. EEM for post-O3 sample. Figure 10. EEM for finished water sample Table 10 shows the EEM peak intensities in Raman units (RU) of each DWTP sample using the peak-picking method in which peak intensities are recorded within a region of interest. Though peak intensities are not concentrations themselves, they describe DOC, where a larger peak value indicates a larger concentration of that DOC fraction in the water sample.
Table 10. EEM peak intensities of sampled waters using the peak-picking method.
Sample
Peak A
intensity (RU)
Peak C intensity (RU)
Peak T intensity (RU)
Percent of DOC in Peak T region* Source water
intake
1.77 0.50 0.20 8.1%
Post-PAC 1.01 0.27 0.11 7.9%
Post-O3 0.68 0.20 0.09 9.3%
Finished water (March 2019)
0.07 0.02 0.02 18.2%
*Calculated by dividing Peak T fraction by the sum of Peak A, C and T fractions. RU = Raman Units
Peak T was present in all samples, suggesting the persistence of tryptophan-like dissolved organic matter through the DWTP. Each peak or DOC component decreased proportionally through each treatment step; however, Peak T constituted a larger portion of DOC in the finished water than in other samples. This may be due to the efficiency of hydrophobic acid DOC
removal by coagulation and flocculation in comparison to other types of DOC (Bolto et al., 1999), as Peak A’s intensity decreased by 91% between post-ozonation and finished water. Peak C, the humic-like fraction, also saw a 90% decrease in peak intensity between post-ozonation and finished water, while Peak T’s intensity decreased 78%. Dotson & Westerhoff (2009) found that 70% of total amino acids were removed during coagulation and settling, which is consistent with these results because of the association between Peak T and amino acids.
iodine concentration of 9.8 µg/L as I in the source water, which decreased dramatically after PAC addition. The mean concentration of total iodine in river water is about 5 µg/L (Moran et al., 2002), and the presence of iodine in the source water at an elevated concentration indicates that it is impacted by wastewater and likely contains iohexol-like organic compounds as a result of upstream discharge from documented medical facility waste. The source water also had a DOC concentration of 4.4 mg/L as C, which decreased by 11.4% after PAC addition. PAC removes organic compounds and total iodine, both of which are iodo-DBP precursors. Ozonation does not remove DBP precursors but transforms them. DOC in finished water decreased by 75.6% from post-ozonation, though all other treatment processes occur in between ozonation and finished water. Water characterization indicated higher finished water quality in comparison to other treatment steps.
THM presence in DWTP samples
THMs were quantified in each sample in order to determine their presence throughout the DWTP, but especially in finished water after disinfection. Table 11 shows the THMs quantified from each DWTP sample. Beginning in March, the DWTP switches from chloramines to chlorine disinfection during a month-long chlorine burn period. Finished water from February, therefore, represents the use of chloramines for disinfection, while finished water from March represents the use of chlorine disinfection. The DWTP reported chloramine residuals in finished water ranging from 1.6-4.24 mg/L as Cl2 (MRDL = 4 mg/L) and chlorine residuals ranging from 0.76-2.87 mg/L as Cl2 (MRDL = 4 mg/L) in 2017. The two regulated and 3 iodo-THMs shown in the table were the only detectable THMs in the samples. Sample chromatograms and
calibration curves can be found in Appendix A.
Table 11. THM* characterization of DWTP samples.
Sample THM4 Iodo-THMs
BrCl2CH Br2ClCH Cl2ICH BrClICH Br2ICH
Travel blank < 2.5 µg/L < 2.5 µg/L < 0.5 µg/L < 0.25 µg/L < 0.5 µg/L Source water
intake < 2.5 µg/L < 2.5 µg/L < 0.5 µg/L < 0.25 µg/L < 0.5 µg/L
Post-PAC < 2.5 µg/L < 2.5 µg/L < 0.5 µg/L < 0.25 µg/L < 0.5 µg/L
Post-O3 < 2.5 µg/L < 2.5 µg/L < 0.5 µg/L < 0.25 µg/L < 0.5 µg/L
Finished water
(February 2019) 6.8 µg/L ± 1.0 < 2.5 µg/L µ2.7 g/L ± 0.2 6.6 µg/L ± 0.8 1.1 µg/L ± 0.3 Finished water
(March 2019) µ2.5 g/L ± 1.0 4.2 µg/L ± 0.2 4.1 µg/L ± 0.1 10.1 µg/L ± 0.4 1.1 µg/L ± 0.1 *Concentration values averaged from duplicate samples
Chloroform was not detected in any sample, which may be due to its volatility and could have been lost during sampling or instrumental analysis. The finished water sample collected in February had a THM4 concentration of 6.8 µg/L while for the March sampling it was 6.7 µg/L, both of which are in compliance with the MCL of 80 µg/L regulation (USEPA, 2001). The sum of the measured iodo-THM concentrations exceeded THM4 concentrations by 3.8 µg/L in February and by 8.6 µg/L in March. The presence of iodo-THMs at higher concentrations than THM4 indicates inadequate removal of iodine sources prior to disinfection.
Beginning on March 1st for one month, the DWTP switched from monochloramine to chlorine disinfection which is reflected in the changes in THM concentrations. After beginning the chlorine burn, the concentration of bromodichloromethane decreased, but the concentrations of dibromochloromethane, dichloroiodomethane, and bromochloroiodomethane increased. This could be due to normal fluctuations in source water quality or changes in flow of water through the DWTP in response to demand, and an increased disinfectant contact time in the clearwell would result in formation of THMs at higher concentrations.
Disinfectant demand test results for DWTP samples spiked with iohexol
Demand tests were conducted to identify the appropriate dose of chlorine to react with DWTP sampled waters in the presence and absence of an iohexol spike and leave a 24-hour residual of about 3 mg/L as Cl2. A gradient of chlorine doses ranging from 15 to 65 mg/L as Cl2 was used in order to determine this dose. This range was selected based on previous experiments involving tryptophan at 15 mg/L in which the chlorine dose required to leave a 24-hour 3 mg/L as Cl2 residual was 65 mg/L as Cl2. A tryptophan dose of 15 mg/L as tryptophan is equivalent to 9.7 mg/L as C. Because each sample had a DOC concentration of about 4 mg/L as C, or about 40% of the DOC in the previous tryptophan dose, it was assumed that 40% of the previous chlorine dose of 65 mg/L as Cl2 would be necessary to leave the same residual of 3 mg/L as Cl2. The selected doses, however, left residuals much greater than 3 mg/L as Cl2, so only the lowest chlorine dose of 15 mg/L as Cl2 was selected for further THM analysis.
Table 12 shows the residuals and demand for 3 of the DWTP samples after a 24-hour reaction with 15 mg/L chlorine in the presence and absence of 5 mg/L iohexol.
Table 12. 24-hour chlorine demand test results for DWTP samples in the presence and absence
of iohexol.
Sample
Cl2 dose
(mg/L as Cl2)
Cl2 residual after
reaction with sample (mg/L as Cl2)
Cl2 residual after reaction
with sample and 5 mg/L
iohexol (mg/L as Cl2)
Cl2 demand
by sample (mg/L as Cl2)
Source
water 15 10.1 9.5 4.9
Post-PAC 15 10.3 11.2 4.7
Post-O3 15 10.7 11.7 4.3
region constitutes all of tryptophan’s DOC as tryptophan is the Peak T standard, while Peak T in the source water, post-PAC, and post-O3 samples only constituted 8-9% of the DOC. The addition of iohexol to the samples did not impact chlorine demand indicating that it likely had little reaction with chlorine.
Table 13 shows the monochloramine demand in each sample (measured as total chlorine) at a 5 mg/L as Cl2 dose in the absence and presence of iohexol and their associated 24-hour total chlorine residuals. A gradient of monochloramine doses ranging from 5 to 10 mg/L as Cl2 was used in order to determine the appropriate dose required to leave a 24-hour residual of about 3 mg/L as Cl2. Previous experiments involving tryptophan indicated that a monochloramine dose of 12 mg/L as Cl2 was necessary to react with tryptophan at 15 mg/L and leave the target
residual. It was again assumed that 40% of the previously used monochloramine dose of 65 mg/L as Cl2 would be necessary to leave the same residual of 3 mg/L as Cl2. The lowest
monochloramine dose of 5 mg/L as Cl2 left a residual greater than the target, so this dose was selected for further THM analysis.
Table 13. 24-hour monochloramine demand test results (measured as total chlorine) for DWTP
samples in the presence and absence of iohexol.
Sample
Total Cl2
dose (mg/L as Cl2)
Total Cl2 residual
after reaction with
sample (mg/L as Cl2)
Total Cl2 residual
after reaction with sample and 5 mg/L
iohexol (mg/L as Cl2)
Total Cl2
demand by sample (mg/L as Cl2)
Source
water 5 4.1 4.2 0.9
Post-PAC 5 4.2 4.3 0.8
Post-O3 5 4.5 4.4 0.5
A monochloramine dose of 5 mg/L as Cl2 left a residual of 4.1-4.5 mg/L as Cl2 after a 24-hour reaction with each DWTP sample. These results are consistent with previous results
suggesting the demand for monochloramine is much less than the demand for chlorine. The residuals were similar to the MRDL of 4 mg/L as Cl2 for monochloramine. The addition of iohexol to the samples did not impact total chlorine demand again suggesting that it may have little to no reaction with the disinfectant under the treatment conditions employed.
THM analysis results for disinfectant reactions of DWTP samples with added iohexol
Table 14. 24-hour THM formation results for chlorination of DWTP samples in the presence and absence of iohexol.
Sample Cl2 dose
Iohexol
dose THM4* (µg/L) Iodo-THMs* (µg/L)
Cl3CH BrCl2CH Br2ClCH Cl2ICH ClI2CH BrI2CH Travel
blank 15 mg/L 0 mg/L < 2.5 < 2.5 < 2.5 < 0.5 < 0.5 < 0.5
Travel
blank 15 mg/L 5 mg/L < 2.5 < 2.5 < 2.5 < 0.5 < 0.5 < 0.5
Source water
15 mg/L 0 mg/L 239 ± 41 67 ± 17 3.7 ± 0.1 6.5 ± 0.2 < 0.5 7.1 ± 2.8 Source
water
15 mg/L 5 mg/L 361 ± 13 37 ± 13 3.5 ± 0.1 5.8 ± 0.2 0.74 ±
0.05 11.1 ± 1.0
Post-PAC
15 mg/L 0 mg/L 237 ± 36 41 ± 17 3.2 ± 0.1 4.9 ± 0.5 < 0.5 7.4 ± 0.1
Post-PAC
15 mg/L 5 mg/L 369 ± 56 55 ± 15 3.6 ± 0.2 5.3 ± 0.5 < 0.5 10.2 ± 1.1
Post-O3 15 mg/L 0 mg/L 212 ± 55 47 ± 11 9.1 ± 0.4 1.0 ± 0.1 < 0.5 4.9 ± 0.1
Post-O3 15 mg/L 5 mg/L 297 ± 21 75 ± 12 11 ± 1.0 1.2 ± 0.1 < 0.5 6.9 ± 0.2
*Concentration values averaged from duplicate samples
Chloroform formed at greater concentrations than other THMs after every reaction. Chloroform concentrations were extrapolated from the calibration curve, as the highest THM4 calibration point was 100 µg/L. THM4 concentrations exceeded the MCL of 80 µg/L, which is why other treatment steps are necessary to remove THM precursors prior to disinfection. The addition of iohexol did not seem to impact the concentration or characterization of THMs formed, except in the reaction with the source water sample. In the absence of iohexol, the reaction of source water with chlorine did not form a detectable concentration of
chlorodiiodomethane, but in the presence of iohexol, chlorodiiodomethane formed at a
concentration of 0.74 µg/L. These results are consistent with the results from previous reactions of tryptophan as surrogate NOM with chlorine and iohexol, except formation of bromine-containing THMs in the plant waters was likely due to the presence of bromide which was not present in the earlier laboratory-prepared solutions. Previous reactions of chlorine with iohexol in the absence of organic matter did not produce detectable THMs. A carbon source is, therefore, necessary for THM formation, which is seen in the results of Table 14 where DOC was present in each sample.
The addition of iohexol generally increased formation of chloroform and
bromodiiodomethane within each sample. An increase in chloroform concentration could be due to the addition of organic matter contained within iohexol to each sample. However, chlorination of iohexol in the absence of NOM did not produce detectable THMs. Bromodiiodomethane concentrations could have increased due to the release of iodine from iohexol, though the same trends are not seen among other iodo-THMs. Iohexol increased formation of
Previous sample analysis, whose results are presented in Table 11, showed the presence of bromochloroiodomethane and dibromoiodomethane in finished water but these DBPs did not form in reactions where the same water was spiked with iohexol. The results of chloramine reactions of plant waters with and without added iohexol shown in Table 15, however, formed chlorodiiodomethane, bromodiiodomethane, and chloroform that were not present in finished water samples. The presence of iodo-THMs in the finished water samples and after sample reactions with chlorine indicates inadequate removal of iodine-containing precursors prior to disinfection. The total iodine present in iodo-THMs in finished water (Table 11) was about 8.0
µg/L as I, and the total iodine concentrations present in iodo-THMs shown in Table 14 were 6.5, 5.7, and 2.4 µg/L as I for source water, post-PAC, and post-O3 samples following chlorination in the absence of an iohexol spike, respectively. This follows the decreasing total iodine trend after each treatment step seen in Table 7.
Similar formation of bromodichloromethane, dibromochloromethane,
dichloroiodomethane, and bromodiiodomethane was seen among source water intake and post-PAC samples after chlorination, regardless of iohexol presence. Post-O3, however, decreased both dichoroiodomethane and bromodiiodomethane formation. This indicates that ozonation may have transformed the organic matter into a form that does not as easily produce iodo-THMs.
Table 15 shows those THMs formed from the reactions of monochloramine with DWTP samples in the presence and absence of iohexol at 5 mg/L.
Table 15. 24-hour THM formation results for chloramination of DWTP samples in the presence
and absence of iohexol.
Sample NH2Cl dose Iohexol dose Cl3CH yield* ClI2CH yield*
Travel blank 5 mg/L 0 mg/L < 2.5 µg/L < 0.5 µg/L
Travel blank 5 mg/L 5 mg/L < 2.5 µg/L < 0.5 µg/L
Source water intake
5 mg/L 0 mg/L 2.6 ± 0.5 µg/L < 0.5 µg/L** Source water
intake
5 mg/L 5 mg/L 3.5 ± 0.7 µg/L < 0.5 µg/L**
Post-PAC 5 mg/L 0 mg/L < 2.5 µg/L < 0.5 µg/L**
Post-PAC 5 mg/L 5 mg/L 3.4 ± 1.0 µg/L < 0.5 µg/L**
Post-O3 5 mg/L 0 mg/L < 2.5 µg/L < 0.5 µg/L**
Post-O3 5 mg/L 5 mg/L < 2.5 µg/L < 0.5 µg/L**
*Concentration values averaged from duplicate samples **Peaks detectable but not quantifiable
The only quantifiable THM from the reactions of monochloramine with the DWTP samples was chloroform. Chlorodiiodomethane peaks were detectable but not quantifiable as they were below the practical quantitation limit of 0.5 µg/L. The presence of
chlorodiiodomethane could be confirmed by increasing contact time of monochloramine with DWTP samples or by increasing the concentrations of precursors. The chloroform concentrations from these reactions were nearly two orders of magnitude lower than from the chlorine reactions (Table 14), which is due to differences in reaction kinetics and demand of chlorine and
sample. In the post-O3 samples, there was no chloroform formation, indicating possible
transformation of organic matter by ozonation into a form that makes THM formation less likely. In the previous lab-controlled chlorination experiments of DWTP samples,
chlorodiiodomethane only formed when iohexol was spiked into the source water sample and reacted with chlorine, shown in Table 14. In these experiments, chlorodiiodomethane was
detectable regardless of the presence of an iohexol spike. This indicates that an iodine source was already present in the sampled waters and contributed to formation of iodo-THMs, which was also shown in the total iodine characterization data. The total iodine concentrations present in iodo-THMs from these reactions were below detection limits. Based on these results, it seems that iohexol is not a major source of iodine in the formation of iodo-THMs following
CONCLUSIONS
This project evaluated the formation potential of iodo-THMs in surface waters that receive pharmaceutical wastewater effluent by addressing the following objectives:
1) Determine the conditions under which iohexol (one of the most widely used ICM in the state of North Carolina) releases iodine in controlled laboratory media.
In this study, iodo-THMs formed only in reactions of monochloramine with tryptophan (a source of natural organic matter and nitrogen) in the presence of iodide, and the only iodo-THM that formed was iodoform. Based on percent yield from these reactions, iohexol (5 mg/L) would have to release about 10 µg/L iodide (about 0.2% of its mass) in a reaction with monochloramine at 12 mg/L and tryptophan at 15 mg/L in order to form a detectable concentration of iodoform. No other THMs were formed in these reactions. However, chlorine reacted with tryptophan in the presence of iohexol to produce chloroform, but no detectable iodo-THMs were measured. Since iohexol was added at 5 mg/L into a subset of all of these samples and no iodo-THMs were detected, it appears that iohexol is not a major source of iodide under the laboratory conditions evaluated.
2) Determine if the laboratory conditions evaluated in objective (1) are applicable to natural waters and drinking water treatment.
Samples collected from four treatment points (source water, post-PAC, post-O3, and finished water) in an NC surface DWTP were characterized and confirmed the presence of tryptophan-like organic matter and iodine in each sample. Finished water samples collected in February 2019, when chloramine was used for final disinfection, contained
bromodichloromethane (6.8 ± 1.0 µg/L), dichloroiodomethane (2.7 ± 0.2 µg/L),
bromochloroiodomethane (6.6 ± 0.8 µg/L), and dibromoiodomethane (1.1 ± 0.3 µg/L), which indicates the presence of bromine in addition to iodine in the source water. Iodine had been detected in samples collected from the same DWTP and locations in 2017, the source of which could have been iohexol or other unknown compounds. This also indicates precursor differences between the type of NOM present in the surface water and tryptophan, as previous reactions addressed under objective (1) using tryptophan as surrogate NOM did not yield THMs following chloramination. The tryptophan-like Peak T region in DWTP samples following EEM analysis constituted less than 10% of the DOC in source water, post-PAC, and post-O3 samples.
Reactions of monochloramine (5 mg/L as Cl2) with source water samples resulted in formation of chloroform (2.6 ± 0.5 µg/L in the absence of iohexol, 3.5 ± 0.7 µg/L in the presence of iohexol) regardless of iohexol addition, though chloroform was not detected in finished water. This may have been due to the 77% decrease in DOC from source water to finished water which would decrease chloroform formation, though ionorganic iodine must have persisted through treatment in order to produce iodo-THMs, as PAC removes the majority of organic compounds. Chloramination, dosed at 5 mg/L as Cl2, of post-PAC samples also yielded chloroform (3.4 ± 1.0
µg/L) but only when 5 mg/L iohexol was added, possibly due to the presence of additional organic matter from iohexol in the sample. Post-O3 samples had no chloroform formation