NEURAL NETWORK DYNAMICS OF VISUAL PROCESSING IN THE HIGHER-ORDER VISUAL SYSTEM
Zhe Zhou
A dissertation submitted to the faculty of the University of North Carolina at Chapel Hill in partial fulfillment of the requirements for the degree of Doctor of Philosophy in the Curriculum of Neuroscience
of the School of Medicine.
Chapel Hill 2019
ii © 2019 Zhe Zhou
iii ABSTRACT
Zhe Zhou: Neural Network Dynamics of Visual Processing in the Higher-Order Visual System (Under the direction of Flavio Frohlich)
iv
ACKNOWLEDGEMENTS
Science is a deeply collaborative enterprise; the works presented in this dissertation are no exceptions and involved the invaluable participation of individuals ranging from the UNC-Chapel Hill neuroscience administration and leadership, to animal husbandry, to the scientists I have interacted across the globe, to the janitors of Neurosciences Research Building. Of these particular individuals, I would first like to thank Flavio Frohlich for taking me on this journey of discovering the unknown. You have taught me lessons in science and life that will forever be ingrained in me. It was a honor to grow and develop both personally and professionally through these past years. I would like to thank Zheng (Jane) Fan, Gary Pielak, and Gabriel Dichter for planting and fostering the idea of joining the ranks of scientists. Many thanks to all of the previous and current Frohlich lab members who have helped me find my way: In particular, Kristin Sellers, Angel Huang, Ehsan Negahbani, Yuhui Li, Chunxiu Yu, Iain Stitt, Sankar Alagapan, Caroline Lustenberger, Sophia Kim, and Seeun Jung; as well as current members: Jhana Parikh, Julianna Prim, Justin Riddle, Kaelin Kennedy, Morgan Alexander, Sangtae Ahn, Susanne Radtke-Schuller, and Trevor Mcpherson.
Several monumental scientists, in character and in scientific mentorship, have donated precious time to aiding my scientific development. In particular, I would like to thank previous and current thesis committee members for their vital feedback and mentorship: Hiroyuki Kato, Paul Manis, Michael Murias, Spencer Smith, Marc Sommer, and Garret Stuber. Thank you to my collaborators and fellow ferret researchers: Jinghao Lu, Yiyi Yu, Jordan Hamm, John Gilmore, Yen-Yu Ian Shih, Andrew Salzwedel, Wei Gao, Jonathan Fritz, Yves Boubenec, Gordon Smith, and Kristina Nielsen.
v
I would also like to thank Dennis Gagliardotto, Peter Pielak, Diego Castillo, Brian Niederland, and Dylan Derby for sticking with me from the beginning.
vi
TABLE OF CONTENTS
LIST OF TABLES ... viii
LIST OF FIGURES ... viii
LIST OF ABBREVIATIONS ... xii
CHAPTER 1: GENERAL INTRODUCTION ... 1
REFERENCES ... 9
CHAPTER 2: RESTING STATE NETWORK TOPOLOGY OF THE FERRET BRAIN ... 14
INTRODUCTION ... 14
METHODS ... 16
RESULTS ... 20
DISCUSSION... 25
FIGURES AND TABLES ... 31
REFERENCES ... 41
CHAPTER 3: DORSO-LATERAL FRONTAL CORTEX OF THE FERRET ENCODES PERCEPTUAL DIFFICULTY DURING VISUAL DISCRIMINATION ... 49
INTRODUCTION ... 49
METHODS ... 50
RESULTS ... 58
DISCUSSION... 70
FIGURES AND TABLES ... 76
REFERENCES ... 92
CHAPTER 4: AROUSAL DEPENDENT MODULATION OF THALAMO-CORTICAL FUNCTIONAL INTERACTION ... 99
vii
METHODS ... 100
RESULTS ... 110
DISCUSSION... 119
FIGURES AND TABLES ... 124
REFERENCES ... 150
CHAPTER 5: STIMULUS-SPECIFIC REGULATION OF CONTEXT DIFFERENTIATION IN POSTERIOR PARIETAL CORTEX ... 155
INTRODUCTION ... 155
METHODS ... 158
RESULTS ... 165
DISCUSSION... 169
FIGURES AND TABLES ... 173
REFERENCES ... 183
CHAPTER 6: DISCUSSION ... 187
viii
LIST OF TABLES
ix
LIST OF FIGURES
Figure 2.1. Ferret gICA networks ... 32
Figure 2.2. Anterior and posterior default mode networks of the ferret brain ... 33
Figure 2.3. Excluded gICA Networks ... 34
Figure 2.4. Nissl stain sections corresponding to MRI slices ... 35
Figure 2.5. Within- and between-network connectivity analysis ... 36
Figure 3.1. Experimental task design and behavioral performance ... 76
Figure 3.2. Classification of single unit cell types ... 77
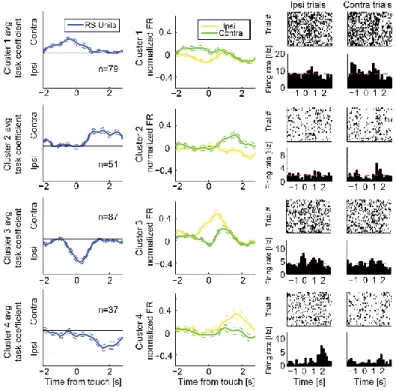
Figure 3.3. Dynamics of task-modulated single units ... 78
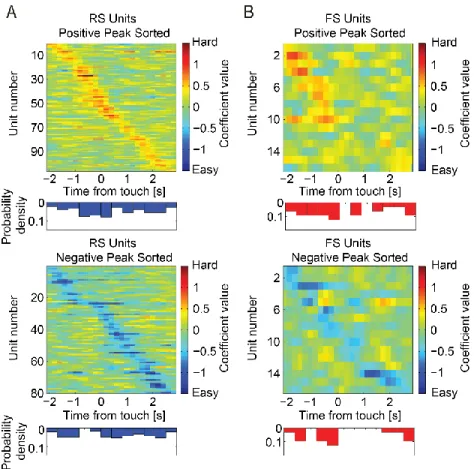
Figure 3.4. Coefficient time-series of task difficulty preference ... 79
Figure 3.5. Dynamics of units with difficulty preference ... 80
Figure 3.6. Coefficient time-series of location preference ... 81
Figure 3.7. Dynamics of units with target location preference ... 82
Figure 3.8. Population Coding of Task Properties ... 83
Figure 3.9. Optogenetics experiment and behavioral performance ... 84
Figure 3.A. Frontal cortex coronal sections of electrophysiology animal 3 ... 86
Figure 3.B. Reaction time to touch distributions for sorted units ... 87
Figure 3.C. Initiation and touch-centered PETHs of difficulty preferring units ... 88
Figure 3.D. Initiation and touch-centered PETHs of location preferring units ... 89
Figure 3.E. Activity of neurons without task variable preference ... 90
Figure 3.F. Histology and behavioral performance of additional optogenetics animals ... 91
Figure 4.1. Experimental setup and anatomical connectivity between LP/Pulvinar and PPC. ... 124
Figure 4.2. Neuronal spiking rate and LFP spectral power in PPC and LP/Pulvinar are modulated with pupil diameter. ... 125
Figure 4.3. Thalamo-cortical synchronization varies with ongoing fluctuations in pupil-linked arousal. ... 126
x
Figure 4.5. Visual processing induced changes in thalamo-cortical network dynamics. ... 128 Figure 4.6. Saccades link visual sensory processing and pupil-linked arousal related
changes in thalamo-cortical dynamics. ... 129 Figure 4.7. Thalamo-cortical synchronization and pupil-linked arousal correlate with
saccade behavior ... 130 Figure 4.8. Rapid fluctuations in pupil diameter correlate with the reorganization of
thalamo-cortical functional connectivity ... 131 Figure 4.A. Histological confirmation of multielectrode array recording sites in
anatomically connected sites of PPC and LP/Pulvinar. ... 133 Figure 4.B. Pupil-linked arousal dependent changes in PPC and LP/Pulvinar firing rate. ... 135 Figure 4.C. PPC and LP/Pulvinar LFP power spectra under different visual stimulus conditions. ... 136 Figure 4.D. Thalamo-cortical phase synchronization with matched power distributions. ... 137 Figure 4.E. Thalamo-cortical spike correlation as a function of pupil diameter. ... 138 Figure 4.F. Endogenous alpha frequency speeds up in cortex with arousal. ... 139 Figure 4.G. Phase slope index (Ψ) uncovers reciprocal thalamo-cortical effective
connectivity in the theta and alpha frequency bands. ... 140 Figure 4.H. Power matched Granger causality analysis. ... 142 Figure 4.I. PPC and LP/Pulvinar responses to naturalistic images. ... 143 Figure 4.J. Basic saccade properties and saccade-locked measures of spiking activity
and LFP power. ... 144 Figure 4.K. Significant modulation of thalamo-cortical power spectra and functional
connectivity time locked to saccades in the dark. ... 145 Figure 4.L. Thalamo-cortical functional connectivity analysis after controlling for
peri-saccade epochs. ... 147 Figure 4.M. Correlation of thalamo-cortical functional connectivity and prestimulus
pupil diameter to oculomotor behavior while viewing naturalistic images. ... 148 Figure 4.N. Transient pupil dilations lead to the reorganization of oculomotor behavior
and neural activity in PPC and LP/Pulvinar. ... 149 Figure 5.1 Direction tuning in posterior parietal cortex (PPC) single cell-resolved
xi
Figure 5.3. Stimulus-specific MMR is composed of “deviance suppression” and
stimulus-specific adaptation ... 176 Figure 5.4. MMR scales with preferred stimulus control context magnitude and
xii
LIST OF ABBREVIATIONS
ASD Autism Spectrum Disorder DLPFC Dorsolateral prefrontal cortex DMN Default mode network EEG Electroencephalography FC Frontal cortex
fMRI Functional magnetic resonance imaging LFP Local field potential
LP/pulvinar Lateral posterior / Pulvinar nuclear complex of the thalamus MMN Mismatch negativity
MRI Magnetic resonance imaging
MU Multi-unit
NIH National Institute of Health
NIMH National Institute of Mental Health PFC Prefrontal cortex
PLV Phase-locking value PPC Posterior parietal cortex ROI Region-of-interest SU Single unit
1
CHAPTER 1: GENERAL INTRODUCTION
The brain effortlessly solves the monumental challenge of recreating our sensory environment as neural impulses, efficiently processing and integrating that information with our internal state and memory representations, and generating an action that appropriately interacts with said environment. Like a well-oiled, interlocking machine, the brain is composed of multiple specialized regions that are highly interconnected and synchronized to enable such behavioral engagement (Sporns et al., 2000). Such an organization of interconnected modules extends to the many spatial scales of the brain, including, but not limited to, the circuit and network levels (Kandel, 2013; Fröhlich, 2016). At the circuit level, individual cells that hold their own modicum of information communicate to produce a collective representation of processed information. At the network level, structurally and functionally distinct brain regions work serially and in parallel to integrate processed information and ultimately send signals to downstream motor structures for action engagement. Brain imaging and recording techniques such as functional magnetic resonance imaging and electrophysiology can be used to measure network and circuit functional interactions, respectively (Ogawa et al., 1990; Bastos and Schoffelen, 2015). Indeed, modern neuroscience is supported by the foundation of studies that have revealed relationships between brain region and brain network activity to sensory processing and cognitive function across animal species.
2
critical electrical component of population neural activity, the local field potential (LFP), which represents subthreshold rhythmic fluctuations in cell membrane and synaptic currents (Buzsaki and Draguhn, 2004; Fröhlich, 2016). Importantly, specific rhythmic signatures of the LFP, defined by how often they oscillate within a given amount of time (typical oscillation frequency bands of studies consist of 1-3 Hz named delta, 4-8 Hz for theta, 8-12 Hz for alpha, 12-30 Hz for beta, and 30-60 Hz for gamma), have been linked to sensory processing and behavioral performance (Cardin et al., 2009; Boyce et al., 2016; Herrmann et al., 2016; Lustenberger et al., 2016). In order to obtain a comprehensive understanding of how neurons in a specific brain region are directly involved with producing a specific pattern of activity or generating a behavior, one must show causation using stimulation of said neurons. Optogenetics, optical stimulation of genetically-identified neurons via viral expression of light-activated ion channels, allows for temporally-precise activation of specific cell type-specific populations (Boyden et al., 2005).
3
A crucial feature of many mammalian species is the presence of higher-order brain areas that facilitate cognition, executive function, and top-down regulation of upstream areas (Kandel, 2013). Here, top-down regulation refers to the ability of certain brain areas to influence activity based on internal state or existing mental representations (e.g. expectation of the next stimulus based on stimulus history). Once sensory stimuli are faithfully reconstructed in early sensory regions, higher-order brain areas such as parietal and frontal cortices add context and a general framework for how such information is to be interpreted. This framework represents the animal’s current state, emotions, previous experiences, and recent memories that may contribute to stimulus interpretation and variability from encounter to encounter. Although parietal and frontal cortices occupy similar niches in higher-order cognition, their nuanced functions fill vital roles in the pipeline of transforming sensory input into behaviorally-relevant output.
4
decision-making. Despite this existing body of parietal research, there remains a gap in the literature of how parietal sensory responses are modulated by internal animal states and external contextual demands, and how such sensory representations ultimately contribute to signals that influence behavior. A portion of the work that I have conducted aims to address this gap in knowledge through careful dissection of parietal neuron activity and parietal circuit interactions as a function of animal arousal states and stimulus context.
The frontal cortex is often considered to be the regulator of voluntary, purposeful behavioral actions, providing top-down control onto upstream regions and directly influencing motor output regions. The source and content of top-down control may differ by frontal cortex subregion; this dissertation specifically focuses on the dorso-lateral prefrontal cortex (dlPFC) subdivision which is involved with target stimulus selection, response inhibition, and behavioral output (Snyder et al., 1997; Menon et al., 2001; Heekeren et al., 2004). Signals in frontal cortex are thought to be in a near-final processed form and represents a binary signal of whether or not an action should be performed (Hanks et al., 2015). Indeed, when compared to parietal cortex which exhibits graded firing responses that may encode the weight of sensory information gathered, frontal cortex activity exhibits a binary, categorical encoding of the accumulated sensory information during a behavioral task (Hanks et al., 2015). Based on this information, frontal cortex can then provide executive control over facilitating motor response to target stimuli or suppressing inappropriate responses (Ridderinkhof et al., 2004; Blasi et al., 2006).
5
Our laboratory has recently published a study showing fronto-parietal functional interactions support anticipatory visual attention in an environment where the animal is able to freely move and is motivated to interact with stimuli presented on a touchscreen monitor (Sellers et al., 2016). As a whole, these studies highlight the importance of both parietal and frontal cortex in identifying and engaging with salient, behaviorally-relevant stimuli.
6
cortices synchronization in psychiatric disorders is limited; however, recent studies using non-invasive brain stimulation have made progress. Transcranial alternating current stimulation (tACS), a non-invasive electrical brain stimulation technique that applies biologically-relevant rhythmic weak electric fields to the subject’s scalp, applied to both frontal and temporal regions has been shown to enhance brain activity in patients with schizophrenia; such enhancements in activity correlate with clinical improvements of auditory hallucinations (Ahn et al., 2019). In summary, severe impairment in cognitive-sensory processing in psychiatric disorders and the lack of in-depth insight to underlying mechanisms highlight the need for additional studies of sensory processing in frontal cortex and higher-order sensory cortices.
One solution to gain mechanistic insight is to use animal models with strengths that facilitate the study of a specific hypothesis. The studies presented in this dissertation utilize the ferret because it possesses:
1) A rich history of visual system study: The first landmark studies of ferret visual cortex structure and function (Law et al., 1988; Zahs and Stryker, 1988; Chapman and Stryker, 1993) were performed almost in parallel with studies in cats and monkeys (Hubel et al., 1978; LeVay et al., 1978). These studies identified ocular dominance columnar structure in ferret primary visual cortex, similarly seen in cats and primates. Further, there’s a large body of literature investigating how orientation and direction tuning maps form and develop with experience at post-natal and juvenile ages (Katz and Crowley, 2002; Basole et al., 2003; Li et al., 2006; Li et al., 2008; Smith et al., 2015).
7
3) A gyrencephalic brain: Similar to the human brain, the ferret brain is folded with gyri and sulci. This is particularly important for the study of how non-invasive brain stimulation may affect cortical tissue differently than that of a lissencephalic animal (smooth brain). Indeed, modeling studies have suggested that electric fields propagate through and affect folded brain tissue in a unique fashion (Thielscher et al., 2011; Miranda et al., 2013). Therefore, the ferret is a suitable animal model to explore how non-invasive brain stimulation can affect brain activity and ultimately restore function in animal models of psychiatric disorder.
A further advantage of using the ferret that is not immediately apparent in my studies is that the brain development period of the post-natal ferret is equivalent to the developmental period of the human fetus in the third trimester (Empie et al., 2015). As several psychiatric disorders are characterized by abnormal developmental patterns, sometimes occurring during neural proliferation, the juvenile ferret allows for the natural study of early brain development. Our laboratory has recent publications and ongoing studies examining the relationship between abnormal early brain development and the manifestation of developmental disorders (Li et al., 2017; Li et al., 2018).
In summary, frontal and parietal cortices play key roles in sensory-driven behavior. Network and circuit-level interrogations within and between these two areas highlight the causal relationship between their activity and behavioral performance. Despite this body of literature, it remains unclear how single neurons give rise to population activity in such higher-order areas during visual processing. This gap in knowledge produces a general question: how do single neurons in higher-order cognitive brain areas contribute to population activity to enable proper visual processing and discrimination, and how does such activity change as a function of an animal’s internal state or an external stimulus’ properties. The work in this dissertation aims to address this question in four chapters to investigate:
8
networks, including two interconnected DMN networks centered around posterior parietal cortex and frontal cortex.
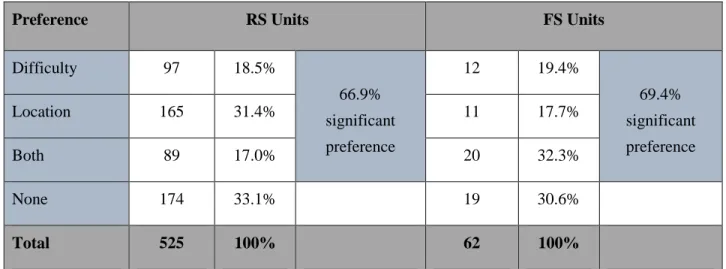
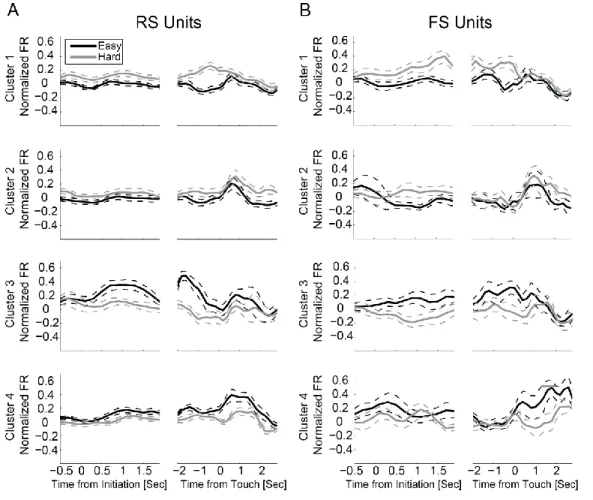
Chapter 3: How perceptual difficulty, operationalized by stimulus contrast, and target stimulus location are represented in frontal cortex neural activity. Results revealed that single neurons were able to encode target stimulus location and perceptual difficulty; however, optimal encoding occurred at the level of the population. Further, optogenetic silencing of frontal neurons decreased behavior reaction time, potentially indicating a mechanism of disinhibition onto downstream motor regions.
Chapter 4: How animal arousal state affects sensory processing in the higher-order visual thalamo-cortical circuit. We found that the direction and carrier frequency of higher-order cortical and thalamic function interactions switched as a function of animal arousal indexed by pupil diameter.
Chapter 5: How a higher-order visual cortical region, PPC, neurons give rise to context-dependent processing. We found that single neurons in PPC exhibit context differentiation and that the local PPC population exhibits stimulus and context-dependent regulation of neural activity.
9
REFERENCES
Ahn S, Mellin JM, Alagapan S, Alexander ML, Gilmore JH, Jarskog LF, Frohlich F (2019) Targeting reduced neural oscillations in patients with schizophrenia by transcranial alternating current stimulation. Neuroimage 186:126-136.
Andersen RA, Buneo CA (2002) Intentional maps in posterior parietal cortex. Annu Rev Neurosci 25:189-220.
Assaf M, Jagannathan K, Calhoun VD, Miller L, Stevens MC, Sahl R, O'Boyle JG, Schultz RT, Pearlson GD (2010) Abnormal functional connectivity of default mode sub-networks in autism spectrum disorder patients. Neuroimage 53:247-256.
Barbas H, Pandya DN (1989) Architecture and intrinsic connections of the prefrontal cortex in the rhesus monkey. J Comp Neurol 286:353-375.
Barcelo F, Suwazono S, Knight RT (2000) Prefrontal modulation of visual processing in humans. Nat Neurosci 3:399-403.
Basole A, White LE, Fitzpatrick D (2003) Mapping multiple features in the population response of visual cortex. Nature 423:986-990.
Bastos AM, Schoffelen JM (2015) A Tutorial Review of Functional Connectivity Analysis Methods and Their Interpretational Pitfalls. Front Syst Neurosci 9:175.
Blasi G, Goldberg TE, Weickert T, Das S, Kohn P, Zoltick B, Bertolino A, Callicott JH, Weinberger DR, Mattay VS (2006) Brain regions underlying response inhibition and interference monitoring and suppression. Eur J Neurosci 23:1658-1664.
Boyce R, Glasgow SD, Williams S, Adamantidis A (2016) Causal evidence for the role of REM sleep theta rhythm in contextual memory consolidation. Science 352:812-816.
Boyden ES, Zhang F, Bamberg E, Nagel G, Deisseroth K (2005) Millisecond-timescale, genetically targeted optical control of neural activity. Nat Neurosci 8:1263-1268.
Buschman TJ, Miller EK (2007) Top-down versus bottom-up control of attention in the prefrontal and posterior parietal cortices. Science 315:1860-1862.
Buzsaki G, Draguhn A (2004) Neuronal oscillations in cortical networks. Science 304:1926-1929.
10
Cavada C, Goldman-Rakic PS (1989) Posterior parietal cortex in rhesus monkey: II. Evidence for segregated corticocortical networks linking sensory and limbic areas with the frontal lobe. J Comp Neurol 287:422-445.
Chapman B, Stryker MP (1993) Development of orientation selectivity in ferret visual cortex and effects of deprivation. J Neurosci 13:5251-5262.
Colby CL, Goldberg ME (1999) Space and attention in parietal cortex. Annu Rev Neurosci 22:319-349.
Courchesne E, Pierce K (2005) Why the frontal cortex in autism might be talking only to itself: local over-connectivity but long-distance disconnection. Curr Opin Neurobiol 15:225-230.
Empie K, Rangarajan V, Juul SE (2015) Is the ferret a suitable species for studying perinatal brain injury? Int J Dev Neurosci 45:2-10.
Felleman DJ, Van Essen DC (1991) Distributed hierarchical processing in the primate cerebral cortex. Cereb Cortex 1:1-47.
Ford JM, Mathalon DH, Whitfield S, Faustman WO, Roth WT (2002) Reduced communication between frontal and temporal lobes during talking in schizophrenia. Biol Psychiatry 51:485-492.
Fröhlich F (2016) Network neuroscience. Amsterdam ; Boston: Academic Press.
Funahashi S, Bruce CJ, Goldman-Rakic PS (1993) Dorsolateral prefrontal lesions and oculomotor delayed-response performance: evidence for mnemonic "scotomas". J Neurosci 13:1479-1497. Gallinat J, Mulert C, Bajbouj M, Herrmann WM, Schunter J, Senkowski D, Moukhtieva R, Kronfeldt D,
Winterer G (2002) Frontal and temporal dysfunction of auditory stimulus processing in schizophrenia. Neuroimage 17:110-127.
Goodale MA, Milner AD (1992) Separate visual pathways for perception and action. Trends Neurosci 15:20-25.
Hanks TD, Kopec CD, Brunton BW, Duan CA, Erlich JC, Brody CD (2015) Distinct relationships of parietal and prefrontal cortices to evidence accumulation. Nature 520:220-223.
Harlow JM (1999) Passage of an iron rod through the head. 1848. J Neuropsychiatry Clin Neurosci 11:281-283.
11
Herrmann CS, Struber D, Helfrich RF, Engel AK (2016) EEG oscillations: From correlation to causality. Int J Psychophysiol 103:12-21.
Hubel DH, Wiesel TN, Stryker MP (1978) Anatomical demonstration of orientation columns in macaque monkey. J Comp Neurol 177:361-380.
Hwang EJ, Dahlen JE, Mukundan M, Komiyama T (2017) History-based action selection bias in posterior parietal cortex. Nat Commun 8:1242.
Kandel ER (2013) Principles of neural science, 5th Edition. New York: McGraw-Hill.
Katz LC, Crowley JC (2002) Development of cortical circuits: lessons from ocular dominance columns. Nat Rev Neurosci 3:34-42.
Law MI, Zahs KR, Stryker MP (1988) Organization of primary visual cortex (area 17) in the ferret. J Comp Neurol 278:157-180.
LeVay S, Stryker MP, Shatz CJ (1978) Ocular dominance columns and their development in layer IV of the cat's visual cortex: a quantitative study. J Comp Neurol 179:223-244.
Li CS, Mazzoni P, Andersen RA (1999) Effect of reversible inactivation of macaque lateral intraparietal area on visual and memory saccades. J Neurophysiol 81:1827-1838.
Li Y, Fitzpatrick D, White LE (2006) The development of direction selectivity in ferret visual cortex requires early visual experience. Nat Neurosci 9:676-681.
Li Y, Van Hooser SD, Mazurek M, White LE, Fitzpatrick D (2008) Experience with moving visual stimuli drives the early development of cortical direction selectivity. Nature 456:952-956.
Li Y, Dugyala SR, Ptacek TS, Gilmore JH, Frohlich F (2018) Maternal Immune Activation Alters Adult Behavior, Gut Microbiome and Juvenile Brain Oscillations in Ferrets. eNeuro 5.
Li Y, Yu C, Zhou ZC, Stitt I, Sellers KK, Gilmore JH, Frohlich F (2017) Early Development of Network Oscillations in the Ferret Visual Cortex. Sci Rep 7:17766.
Licata AM, Kaufman MT, Raposo D, Ryan MB, Sheppard JP, Churchland AK (2017) Posterior Parietal Cortex Guides Visual Decisions in Rats. J Neurosci 37:4954-4966.
12
Menon V, Adleman NE, White CD, Glover GH, Reiss AL (2001) Error-related brain activation during a Go/NoGo response inhibition task. Hum Brain Mapp 12:131-143.
Miranda PC, Mekonnen A, Salvador R, Ruffini G (2013) The electric field in the cortex during transcranial current stimulation. Neuroimage 70:48-58.
Motter BC, Mountcastle VB (1981) The functional properties of the light-sensitive neurons of the posterior parietal cortex studied in waking monkeys: foveal sparing and opponent vector organization. J Neurosci 1:3-26.
Ogawa S, Lee TM, Kay AR, Tank DW (1990) Brain magnetic resonance imaging with contrast dependent on blood oxygenation. Proc Natl Acad Sci U S A 87:9868-9872.
Pascual-Leone A, Rubio B, Pallardo F, Catala MD (1996) Rapid-rate transcranial magnetic stimulation of left dorsolateral prefrontal cortex in drug-resistant depression. Lancet 348:233-237.
Raichle ME (2015) The brain's default mode network. Annu Rev Neurosci 38:433-447.
Raichle ME, MacLeod AM, Snyder AZ, Powers WJ, Gusnard DA, Shulman GL (2001) A default mode of brain function. Proc Natl Acad Sci U S A 98:676-682.
Raposo D, Kaufman MT, Churchland AK (2014) A category-free neural population supports evolving demands during decision-making. Nat Neurosci 17:1784-1792.
Ridderinkhof KR, van den Wildenberg WP, Segalowitz SJ, Carter CS (2004) Neurocognitive mechanisms of cognitive control: the role of prefrontal cortex in action selection, response inhibition,
performance monitoring, and reward-based learning. Brain Cogn 56:129-140.
Sellers KK, Yu C, Zhou ZC, Stitt I, Li Y, Radtke-Schuller S, Alagapan S, Frohlich F (2016) Oscillatory Dynamics in the Frontoparietal Attention Network during Sustained Attention in the Ferret. Cell Rep 16:2864-2874.
Sharma J, Sur M (2014) The Ferret as a Model for Visual System Development and Plasticity. Biology and Diseases of the Ferret, 3.
Smith GB, Sederberg A, Elyada YM, Van Hooser SD, Kaschube M, Fitzpatrick D (2015) The development of cortical circuits for motion discrimination. Nat Neurosci 18:252-261.
Snyder LH, Batista AP, Andersen RA (1997) Coding of intention in the posterior parietal cortex. Nature 386:167-170.
13
Szczepanski SM, Knight RT (2014) Insights into human behavior from lesions to the prefrontal cortex. Neuron 83:1002-1018.
Thielscher A, Opitz A, Windhoff M (2011) Impact of the gyral geometry on the electric field induced by transcranial magnetic stimulation. Neuroimage 54:234-243.
Tremblay S, Pieper F, Sachs A, Martinez-Trujillo J (2015) Attentional filtering of visual information by neuronal ensembles in the primate lateral prefrontal cortex. Neuron 85:202-215.
Villalobos ME, Mizuno A, Dahl BC, Kemmotsu N, Muller RA (2005) Reduced functional connectivity between V1 and inferior frontal cortex associated with visuomotor performance in autism. Neuroimage 25:916-925.
Whitfield-Gabrieli S, Thermenos HW, Milanovic S, Tsuang MT, Faraone SV, McCarley RW, Shenton ME, Green AI, Nieto-Castanon A, LaViolette P, Wojcik J, Gabrieli JD, Seidman LJ (2009) Hyperactivity and hyperconnectivity of the default network in schizophrenia and in first-degree relatives of persons with schizophrenia. Proc Natl Acad Sci U S A 106:1279-1284.
Zahs KR, Stryker MP (1988) Segregation of ON and OFF afferents to ferret visual cortex. J Neurophysiol 59:1410-1429.
14
CHAPTER 2: RESTING STATE NETWORK TOPOLOGY OF THE FERRET BRAIN 1
INTRODUCTION
Behavior and cognition are supported by the brain’s intrinsic anatomical and functional connectivity (i.e. correlated activity patterns between distinct brain regions) (Fox et al., 2012; Brusa et al., 2014; Zhou et al., 2016a). Resting state functional magnetic resonance imaging (rsfMRI) has emerged as a powerful tool for measuring functional connectivity non-invasively across species (Biswal et al., 1995; Damoiseaux et al., 2006; Vincent et al., 2007; Belcher et al., 2013; Mechling et al., 2014; Kyathanahally et al., 2015). Groups of functionally connected brain regions measured using rsfMRI can be defined as networks that likely reflect the underlying structural organization and communication in the brain (Greicius et al., 2009; van den Heuvel and Hulshoff Pol, 2010). However, functional connectivity within such resting state networks (RSNs) is impaired in human psychiatric disorders such as schizophrenia, Alzheimer’s disease, and autism spectrum disorders (Liu et al., 2008; Minshew and Keller, 2010; Sanz-Arigita et al., 2010; Zhang et al., 2011; Karbasforoushan and Woodward, 2012; Spetsieris et al., 2015; Wang et al., 2015). In particular, the default mode network (DMN), which is composed of the hubs in the parietal and medial prefrontal cortices, has been shown to exhibit elevated activity in neurotypical participants at rest, while the aforementioned disorders show either hypo- or hyperconnected DMNs (Raichle et al., 2001; Greicius et al., 2004; Minshew and Keller, 2010; Sheline et al., 2010; Wang et al., 2015). Resting state studies using graph theory analysis, a set of techniques that assesses the ease of information transfer among distributed brain regions within the whole brain system, have suggested that
1This chapter previously appeared as an article in Neuroimage; 10.1016/j.neuroimage.2016.09.003
15
human and animal brains exhibit small-world network topology (Watts and Strogatz, 1998; Achard et al., 2006; Bullmore and Sporns, 2012). This network attribute characterizes optimized trade-off between cost-efficient wiring and network resilience, and has shown to be altered in neuropsychiatric disorders (Liu et al., 2008; Zhang et al., 2011; Zhao et al., 2012).
Animal models bridge the gap between human psychiatric disorders and their underlying mechanisms. However, the study of these underlying mechanisms relies on accurate comparisons between animal model and human brain dynamics. Therefore, it is important to identify RSNs and their impairments across all research models. The ferret has a rich history of developmental research due to its early post-natal (P) ages corresponding to 25 weeks of gestation in the human (Barnette et al., 2009), as well as its manageable gestation time of ~42 days. Importantly, the ferret brain is born lissencephalic and begins cortical folding (gyrification) at P10 (Sawada and Watanabe, 2012), allowing for translational study of early brain insults and impairments (Empie et al., 2015; Kou et al., 2015). Due to its well-developed sensory and higher-order brain structures, the ferret can be a useful model for studying sensory and cognitive impairments across a broad range of developmental time points (Basole et al., 2003b; Fritz et al., 2010a; Foxworthy et al., 2013a; Atiani et al., 2014). A map of neurotypical functional connectivity patterns would serve as a framework for translational studies in the ferret. Despite studies exploring the structure and function of individual brain regions, such large-scale brain network topology in the ferret has yet to be examined (Manger et al., 2002; Basole et al., 2003b; Bizley and King, 2009; Fritz et al., 2010a; Sellers et al., 2013; Bizley et al., 2015; Yu et al., 2015; Zhou et al., 2016b).
16
validated within-network connectivity, and revealed the presence of interconnected somato-motor and putative default mode networks. We subsequently used graph theory analyses to demonstrate that the ferret brain network topology resembles that of a small-world network. As a whole, these findings add to the wealth of studies arguing for homologous cross-species RSNs (Vincent et al., 2007; Lu et al., 2012; Belcher et al., 2013; Hutchison et al., 2013; Mechling et al., 2014; Miranda-Dominguez et al., 2014; Sforazzini et al., 2014; Barks et al., 2015; Kyathanahally et al., 2015; Liang et al., 2015; Pan et al., 2015), and support the notion that ferrets are a robust animal model for translational research.
METHODS Subjects
A total of six adult (16-19 weeks old) female ferrets (weighing 0.7 to 1kg, group housed in a 12 hr light/ 12 hr dark cycle; Marshall BioResources, North Rose, NY) were included in this study. All animal procedures were performed in compliance with the National Institutes of Health guide for the care and use of laboratory animals (NIH Publications No. 8023, revised 1978), and approved by the Institutional Animal Care and Use Committee of the University of North Carolina at Chapel Hill and the United States Department of Agriculture (USDA Animal Welfare).
Animal Preparation
17
administered 5% dextrose lactated ringer’s (4.264mL/hr), xylazine (1.5 mg/kg/hr), and vecuronium bromide paralytic (0.0769mg/kg/hr) via IV. The end-tidal CO2 (EtCO2; maintained around 3%), oxygen saturation, heart rate (estimated through the pulse oximeter), and rectal temperature were closely monitored through the procedure. EtCO2 values from this system were previously calibrated against invasive sampling of arterial blood gas in rats, reflecting a pCO2 level of ~35 mmHg (Shih et al., 2012; Shih et al., 2013). Paralube and saline drops were applied to protect the eyes.
fMRI Protocol
All data were acquired in a Bruker 9.4 Tesla scanner (Bruker AVANCE, Billerica, MA). A 72 mm volume coil and four-channel phased array coil were used for excitation and signal reception, respectively. Anatomical images were acquired with the following Rapid Acquisition with Relaxation Enhancement (RARE) sequence: repetition time (TR) = 3500 ms, echo time (TE) = 35 ms, RARE factor = 8, matrix size = 280 x 280, FOV = 2.8 x 2.8 cm2, slice thickness = 1 mm. Blood-oxygenation level dependent (BOLD) functional resting state scans were acquired with the following gradient-echo planar imaging (EPI) sequence: TR = 2000 ms, TE = 13 ms, matrix = 80 x 80, field of view (FOV) = 2.8 x 2.8 cm2, slice thickness = 1 mm. For both anatomical and functional scans, 24 adjacent slices were acquired with the same geometric positioning. Ten-minute resting state scans were acquired for all animals; for two animals, two additional resting state scans were acquired.
MR Data Pre-processing
18
was performed on the skull-stripped datasets to produce volumes representing cerebral spinal fluid (CSF) and white-matter (WM) for nuisance signal regression.
The functional data workflow included discarding volumes collected during scanner disequilibrium, slice-timing correction, motion correction, alignment to a pre-existing high-resolution T2-weighted template, spatial smoothing, band-pass filtering, and orthogonalization of nuisance signals including motion-derived parameters. Specifically, the first 10 volumes were excluded and the remaining data underwent slice- timing correction (AFNI 3dTshift). Then, the data were motion corrected using the first functional volume post-exclusion as the target image (AFNI 3dvolreg). Next, the data were smoothed (FWHM = 2.5 mm), filtered (0.01-0.10 Hz), and effectively regressed of whole-brain, white matter (WM), cerebral spinal fluid (CSF), and six motion parameters corresponding to roll, pitch yaw, and displacement in the superior, left, and posterior directions (AFNI function: 3dBandpass). Note, the inclusion of motion vector orthogonalization was likely redundant given that the estimated motion in these anesthetized animals was negligible (e.g. the derivative of all motion parameters < 0.001). Within-animal alignment was performed via rigid body transformation of the functional data to the anatomical images (AFNI 3dAllineate). Between-animal alignment was performed by co-registering each animal’s anatomical dataset to a separate template via a combination of linear (AFNI 3dAllineate) and non-linear (AFNI 3dQwarp) transformations. Each step in the pre-processing pipeline (tissue segmentation, alignment, etc.) was visually inspected for quality assurance.
Anatomical Labeling
19
sections) referenced to the 24 MR slices of this study are shown with the anatomical and functional labels relevant for this study.
Connectivity Analysis
Following preprocessing, rsfMRI connectivity analyses were carried out using AFNI, FSL, and the Brain Connectivity Toolbox (Rubinov and Sporns, 2010). First, RSNs were produced using a data-driven gICA approach (FSL melodic). The number of independent components was set to 10. This number was chosen based on the observation that in humans, about 10 RSN can be consistently identified (Smith et al., 2009) and because we were using pre-processed data; thus we expected a smaller number of ‘meaningful’ components. The IC maps were thresholded (voxel-wise Z-score >= 1.96, i.e. two standard deviations) using an alternative hypothesis test based on fitting a Gaussian/gamma mixture model to the distribution of voxel intensities within spatial maps (Beckmann and Smith, 2004; Beckmann et al., 2005). The IC maps were then visually inspected and certain RSNs were selected for further analyses. RSNs were selected based on the following criteria, 1) consisted of relatively large continuous regions, 2) were largely bilateral, and/or 3) could be referred to anatomical landmarks comparable to well-known structures in existing literature of ferrets and other mammals. For identification of brain regions within gICA connectivity maps, main foci were defined as regions that exhibited high connectivity strength (labeled in yellow) and satisfied the above criteria.
20
3dNetCorr). Fisher-Z transformed temporal correlation values, characterizing the connection strength between each pair of ROIs, were generated for each animal and then used to calculate various GMs. Within (average connectivity within a set of nodes) and between (average connectivity between sets of nodes) were compared across animals for each RSN. Within- and between-network connectivity was statistically validated across animals using standard t-tests. Significance was determined using a combined approach; P < 0.05 (uncorrected) and μz-Corr. ≥ 0.1. The small-world (SW) metric—a common brain network signature across species—was also computed. SW was computed using the clustering coefficient (CC; BCN Toolbox function) and characteristic path length (PL; BCN Toolbox function) and was determined by comparing the average CC and PL of the actual data (CCA and PLA) against random (CCR and PLR) permutations (BCN ToolBox function, n = 1000 permutations);
SW = [CCA / CCR] / [PLA / PLR]
where values > 1 are indicative of a small world network. The SW parameter was calculated using thresholded (Z-correlation > 0.1) connectivity matrices. Distance measures (required for the PL measure) were computed as one minus the temporal correlation (i.e. high correlation values were represented by shorter distances). The ratio measures (log-transformed CC, PL, and SW) were also compared across animals using t-tests (h0; log [XA/XR] = 0).
RESULTS
Identification of resting state network (RSNs) in the ferret brain
21
RSNs observed in other species, and included the motor/somatosensory (#1 and #9), somatosensory (#2), auditory (#3), visual (#4) and putative default mode (DMN) (#5 [anterior] & #6 [posterior]) networks. The functional (bolded) and anatomical structures that exhibited high connectivity strengths (main foci) in each of these networks are listed as follows:
The main connectivity foci of the motor/somatosensory network (Fig. 2.1, IC[#1]) included primary motor cortex (M1) of the posterior sigmoid gyrus (PSG), premotor cortex (PM) of anterior sigmoid gyrus (ASG), primary somatosensory cortex (S1) in posterior sigmoid gyrus (PSG) and coronal gyrus (CNG), higher order somatosensory cortex namely the tertiary somatosensory area (S3) of suprasylvian gyrus (SSG) and caudate nucleus (NC) of the basal ganglia.
The second motor/somatosensory network (Fig. 2.1, IC[#9]) also included the main foci primary motor cortex (M1) in PSG, premotor cortex (PM) in ASG and higher order somatosensory cortex namely tertiary somatosensory area (S3) in lateral gyrus (LG), but the relative positions of these main foci were medial to that of IC[#1], and the primary somatosensory cortex and caudate nucleus were not included.
Main connectivity foci of the somatosensory network (Fig. 2.1, IC[#2]) included primary somatosensory cortex (S1) of PSG and CNG, higher order somatosensory cortex namely the tertiary somatosensory area (S3) of CNG, multisensory cortex in the medial bank of rostral suprasylvian sulcus (MRSS) of CNG, rostral part of posterior parietal cortex (PPr) of SSG and functionally unidentified cortex rostrally adjacent to S1 in PSG, pro-PSG and CNG.
22
AEG, ventroposterior field (VP) in PEG, multisensory cortex in the medial bank of rostral suprasylvian sulcus (MRSS) of CNG, lateral bank of rostral suprasylvian sulcus (LRSS) of AEG, pseudosylvian sulcal cortex (PSSC) of AEG and PEG, higher order visual cortex in the anteromedial lateral suprasylvian cortex (AMLS) of SSG and anterolateral lateral suprasylvian cortex (ALLS) of MEG.
Main foci of the visual network (Fig. 2.1, IC[#4]) included primary visual cortex (area 17), secondary and higher order visual cortex namely area 18/19, area 21 of SSG, the anteromedial lateral
suprasylvian cortex (AMLS) of SSG and anterolateral lateral suprasylvian cortex (ALLS) of MEG, the suprasylvian cortex (SSy), the caudal part of posterior parietal cortex (PPc) of SSG and LG, postsplenial cortex (PSC), functionally undefined cortex in rostral ventral PEG (vPEG) and NC of the
basal ganglia.
We labeled the network #5 (Fig. 2.2, top, IC[#5]) as a putative anterior default mode network as it was composed of main foci in medial prefrontal cortex namely prelimbic cortex (PL), medial dorsal prefrontal cortex (dPFC) in PRG and premotor cortex (PM) in ASG.
Additionally network #6 (Fig. 2.2, bottom, IC[#6]) was deemed a putative posterior default mode network as it composed of main foci in posterior parietal cortex namely rostral posterior parietal cortex
(PPr) in SSG and LG, caudal posterior parietal cortex (PPc) in SSG and LG, posterior cingulate cortex (CG), higher order somatosensory cortex tertiary somatosensory area (S3) in CNG, multisensory cortex of the medial bank of rostral suprasylvian sulcus (MRSS) in CNG and primary motor cortex (M1) in PSG.
23 Anatomical Labeling of RSN brain regions
Main foci structures of high connectivity within networks were referenced to the relevant plates of a ferret brain histology atlas (Radtke-Schuller et al., unpubl.). The sections of the histology atlas (Nissl-stained) were selected based on the corresponding in vivo atlas MR slices. Therefore, the structural template used for registering the resting state MR images was directly comparable to the sections of the atlas (Fig. 2.4). The nomenclature of anatomical structures used in the atlas was based on so far published data on the ferret and/or other carnivores. We used the references in the following paragraph to define brain regions within the gICA networks.
To localize the ferret’s somatosensory cortex we used the following references for S1: Leclerc et al. (1993); Rice et al. (1993); McLaughlin et al. (1998); MRSS, LRSS: Keniston et al. (2009); S2,S3: Foxworthy and Meredith (2011); Meredith and Allman (2015); for posterior parietal cortex (PPr and PPc): Manger et al. (2002); Foxworthy and Meredith (2011); Foxworthy et al. (2013b); for visual cortex area 17: Rockland (1985); Henderson (1987); Law et al. (1988); Innocenti et al. (2002) (also for areas 18, 19 and 21); area 20 (20a, 20b): Manger et al. (2004); SSy and other areas: Cantone et al. (2005). The region of SSy has been renamed by several authors, for example see Homman-Ludiye et al. (2010). For AMLS, ALLS we used Manger et al. (2008); for auditory cortex (primary and higher order cortex) we used Bizley et al. (2005); Bajo et al. (2007); Atiani et al. (2014); for PSSC we used Ramsay and Meredith (2004). For frontal cortex (dPFC, PM and CG; also for primary motor cortex) we referenced Mustela and Cercoleptes (Brodmann, 1909), dog (Kreiner, 1961), ferret PFC (Duque and McCormick, 2010b; Fritz et al., 2010a) studies; for PL (cat) (Room et al., 1985). For RSG and PSC we referred to the cat (Olson and Musil, 1992).
Quantification of within- and between-network connectivity
24
composed of dissociate, yet interconnected subnetworks (Andrews-Hanna et al., 2010; Lu et al., 2012; Kyathanahally et al., 2015). Second, we found an abundance of motor and somatosensory related gICA components, which seemed to be unique to our dataset. To shed light on these two features and to further quantify the connectivity patterns present within our dataset, we computed within- and between-network connectivity using correlation analysis. The ferret brain was subdivided into a set of non-overlapping nodes or regions-of-interest (ROIs, Fig. 2.5A) using the included RSNs detailed above (Fig. 2.1: IC’s #1-4 & #9, and Fig. 2.2; IC’s #5 & #6]). Temporal correlation was used to define the strength of connection between nodes and the total pair-wise representation, or correlation matrix, was used to compute graph measures. The mean Fisher’s-Z transformed correlation matrix (Fig. 2.5B) was typified by strong within network connectivity (main diagonal) and moderate between network connectivity. Within and between RSN connectivity was quantified using the average correlation measures for each set of nodes (Fig. 2.5C within-white and between-grey). All RSNs had significant (Fig. 2.5C; * represents P < 0.05 uncorrected, μZ-Correlation ≥ 0.10) within-network connectivity. Significant between-network connectivity was also detected for a subset of networks including somatosensory/motor (IC #1 and #2; P = 0.011), anterior DMN and posterior DMN (IC #5 and #6; P = 0.015), and motor with both anterior DMN (IC #9 and #5; P = 0.014) and posterior DMN (IC #9 and #6; P = 0.012).
Graph measures confirm “small-world” brain network behavior in ferrets
25
was statistically different (P = 0.002) resulting in an average SW significantly greater than 1 (P = 0.003). Taken together, these results indicate that the functional connectivity patterns within and between networks in the ferret brain are optimized for efficient local and long-range communication.
DISCUSSION
Due to the ability to acquire data from both animals and humans in the same manner, rsfMRI has emerged as a powerful translational method for bridging preclinical and human studies. In conjunction with data-driven gICA and graph theory analysis methods, rsfMRI has proven to be a robust approach to identify and characterize similar brain networks across species. Here we report the presence of seven networks (two motor/somatosensory, somatosensory, auditory, visual, anterior DMN, and posterior DMN) in the ferret brain similar to those previously shown in human and animal data (Damoiseaux et al., 2006; Vincent et al., 2007; Lu et al., 2012; Belcher et al., 2013; Mechling et al., 2014; Stafford et al., 2014; Kyathanahally et al., 2015). We found interconnected motor and somatosensory networks, and interconnected DMN sub-networks using correlation analyses. We further explored the network topology using graph theory analysis and found that the ferret brain is economically organized in a small-world manner. Together, our data supports the presence of modular and stereotyped resting state networks, including a DMN, conserved across species. Further, these results argue for the study of the ferret as an animal model for translational research, and provide a foundation for future ferret brain mapping.
Comparison to human and animal resting state literature
26
and Schwarz, 2016); however, we found a single network for the visual regions, contrasting the primary and higher-order separations seen in the aforementioned studies. This may be explained by the limited coverage of V1 in our scans (due to constrained field of view parameters), or that the ferret visual system is integrated in its functional connectivity. The fractionation of sensory areas may arise from a structural basis: for example, S1, S2, and S3 of rats, ferrets, monkeys receive inputs from distinct regions of thalamus (Friedman and Murray, 1986; Spreafico et al., 1987; Foxworthy and Meredith, 2011). Thalamic subdivisions encode and relay unique information (Marlinski and McCrea, 2008), and may synchronize with cortical subregions in different communication channels (ie. functional networks).
27
While there is evidence that anesthesia alters the dynamic properties of functional connectivity (Barttfeld et al., 2015; Liang et al., 2015), resting state networks persist during anesthesia, albeit slightly diminished in connectivity magnitude (Vincent et al., 2007; Hutchison et al., 2013). Signatures of functional networks in awake states, such as anatomically-confined and bilateral connectivity patterns, remain prominent under low levels of isoflurane anesthesia (Grandjean et al., 2014). Nevertheless, the use of anesthesia is a potential confound and limitation for our study (Sellers et al., 2013; Sellers et al., 2015).
The functionally connected brain regions that comprised the gICA network maps ultimately depend on the analysis method and the level of thresholding applied to the dataset (Hutchison et al., 2013). We opted for a conservative approach to identify brain regions that contribute to the gICA networks. Brain regions were defined by areas in the gICA connectivity map that passed the criteria of 1) Z-Correlations > 1.96, 2) strong, contiguous correlation values, and 3) labels spanning at least two consecutive slices. Using these criteria, we identified functional network maps that were both anatomically relevant and stringently defined.
Significance of the ferret DMN
Several studies have reported that the DMN exhibits modular organization; in other words, the DMN is composed of sub-networks centered on key hubs. Comparative anatomy in monkeys and humans suggest that the medial PFC and PCC serve as hubs due to their rich connectivity patterns with other association areas that are also present in the DMN (Buckner et al., 2008). Indeed, we found two distinct interconnected networks that contained the PFC and PCC, suggesting that ferrets possess a subset of resting state networks that resemble the DMN in higher-order animals.
28
and is active during visually-guided eye movements (Olson and Musil, 1992; Vogt and Gabriel, 1993). Given that cats and ferrets are both in the order Carnivora, it may be possible that PCC of both species share similarities in connectivity, explaining the inclusion of the midline motor regions in ferret DMN. The conclusions we are able to draw regarding the relationship between structural and functional connectivity are restricted by the limited number of ferret brain anatomical, and especially connectivity, studies. Future work may address this gap in the literature using diffusion tensor imaging and tract tracing.
While the functional relevance of the DMN in animals is debated, some studies shed light on how such a network could be important in animal behavior. One study showed that the homologous DMN in chimpanzees is most active at rest, moderately active during social tasks, and minimally active during non-social tasks (Barks et al., 2015). Additionally, the DMN sub-network centered on the posterior cingulate and mPFC is active during self-relevant affective cognition (Andrews-Hanna et al., 2010). Social behavior is evolutionarily conserved across animals and is beneficial to species survival. It may be possible that collective DMN brain activity relates to social, affective cognition known to be present in rodents, non-human primates, and potentially ferrets (Poole, 1978; Trezza et al., 2011; Gunaydin et al., 2014; Harris, 2015). Given these previous findings, the DMN poses as a prime target for the study of brain pathologies and impairments in social cognition. Although our study lacked targeted manipulation of the resting state networks, such perturbation would be the logical progression for future translational studies.
Small-world network properties of the ferret brain
29
efficient parallel processing of distributed sub-networks. Several studies have utilized graph theory metrics, such as small-world and rich-club properties, to show that human and animal brain networks exhibit pronounced local clustering with sparse long-range connections (Hosseini and Kesler, 2013; Baliki et al., 2014; Collin et al., 2014; Miranda-Dominguez et al., 2014). We used the small-world graph theory metric to similarly measure how efficiently the ferret brain is connected. We found that, consistent across all recorded animals, the ferret brain network exhibits small world properties of high clustering coefficients. The characteristic path length was longer than expected of a small world network; however, recent studies have shown that path length increases with loss of consciousness (Monti et al., 2013; Uehara et al., 2014). As a whole, these data concur with previous reports of small-world characteristics of human and animal resting state networks. Our results add to the growing evidence that optimal brain metabolism and information processing benefit from highly-connected, specialized local nodes and distributed long-range wiring patterns.
Importance of ferret brain research
30
may play an expanded role in downstream visual information processing. Studies in the ferret auditory cortex have highlighted similarities between ferret and human uni-modal and multi-modal auditory processing (Bizley et al., 2012; Atiani et al., 2014; Town et al., 2015). As many neuropsychiatric disorders involve multi-modal impairments in sensory processing, the dissection of mechanisms underlying such facilities is particularly important. Additionally, recent efforts have been made to explore the role of frontal cortex regions in sensory regulation (Fritz et al., 2010a; Zhou et al., 2016b). Here, ferret frontal cortex provides top-down sensory gating and stimulus selection in both auditory and visual conditions, reminiscent of the regulatory role of prefrontal cortex in monkeys and humans (Fuster, 2015). Results in our study provide functional validation for the inter-areal connections (overlapping sensory regions in networks 3 and 4) important for cross-modal cognitive processing, and may serve as a foundation for exploring new circuits involved in such processes.
Conclusion
32 Figure 2.1. Ferret gICA networks
IC[#1] Motor/somatosensory network identified from the gICA analysis. Connectivity maps included primary motor cortex (M1 located on the PSG), premotor cortex (PM on ASG), primary
somatosensory cortex (S1 on PSG and CNG), higher order somatosensory cortex (tertiary
somatosensory area (S3 on SSG), and basal ganglia (caudate nucleus (NC)). Connectivity maps are
overlaid onto T2-anatomical images with red-yellow color encoding using a 1.96 < Z-score < 12 threshold (see colorbar); same conventions for ICs #2-4.
IC[#2] Somatosensory network identified from the gICA analysis. Connectivity maps included the brain regions primary somatosensory cortex (S1 on PSG and CNG), multisensory cortex (MRSS on medial bank of rostral suprasylvian sulcus), posterior parietal cortex (PPr on SSG) and higher order somatosensory cortex (tertiary somatosensory area (S3 on SSG), and functionally unidentified cortex
rostrally adjacent to S1 (on PSG, pro-PSG, and CNG).
IC[#3] Auditory network identified from the gICA analysis. Connectivity maps included all primary and higher order auditory cortex fields, and adjacent multisensory and higher order visual cortex fields
(summarized, see List 1 for all included regions).
IC[#4] Visual network identified from the gICA analysis. Connectivity maps included the brain regions primary visual cortex (area 17), secondary and higher order visual cortex (area 18/19 on LG; area 21
on SSG; ALMS on SSG; ALLS on MEG; suprasylvian cortex (SSy), posterior parietal cortex (PPc on SSG and LG), postsplenial cortex (PSC), functionally undefined cortex (presumed higher order auditory cortex on vPEG) and basal ganglia (caudate nucleus (NC)).
33
Figure 2.2. Anterior and posterior default mode networks of the ferret brain
(A) Putative anterior default mode network (IC[#5]) identified from the gICA analysis. Connectivity maps included the brain regions medial PFC, medial dPFC, and PM. Connectivity maps are overlaid onto T2-anatomical images with red-yellow color encoding using a 1.96 < Z-score < 12 threshold (see colorbar).
34 Figure 2.3. Excluded gICA Networks
35
Figure 2.4. Nissl stain sections corresponding to MRI slices
36
Figure 2.5. Within- and between-network connectivity analysis
(A) Seeds for connectivity analysis. To compute within- and between-network connectivity, five spherical (radius of 1 mm) regions-of-interest (ROIs) were identified for each network. These ROIs were centered at the top five local maxima of the correlation map (minimum distance between each maxima was 3 mm), and served as representative samples of each network. Average BOLD time-series were extracted from each of the ROIs for subsequent correlation analysis.
37
(C) Quantification of within- and between-network connectivity. To quantify the degree of within- and between-network connectivity, ROI correlation values were averaged across pairs for each network. Each bar graph represents mean correlation values relative to a particular network. White bars signify average correlation values for ROI pairs within the network and gray bars signify average correlation values for pairs where native ROIs were connected to ROIs in outside networks. * P < 0.05 (uncorrected) and μZ-Corr. ≥ 0.1
Network # Main anatomical regions included in gICA networks Network 1 M1, PM, S1, S3, NC
Network 2 S1, MRSS, PPr, S3
Network 3 A1, AAF, PPF/proPPF, PSF, AVF, ADF, PSSC, VP, MRSS, LRSS, AMLS, ALLS
Network 4 Area 17, Area 18/19, Area, 21, PPc, SSy, AMLS, ALLS, PSC, vPEG, NC
Network 5 mPFC (PL), dPFC, PM Network 6 PPr, PPc, CG, S3, MRSS, M1 Network 9 M1, PM, S3
Table 2.1. Main anatomical regions labeled in gICA maps
Anatomical regions that were labeled in the gICA connectivity maps are listed for each network. These main foci structures were defined by areas with strong correlation (Z-scores labeled in yellow in the gICA maps). All labeled brain areas spanned at least two consecutive slices. Additional conventions and criteria for anatomical labeling can be found in the methods. See List 1 for anatomical abbreviations.
Animal CCA CCR CCA CCR
PLA PLR PLA PLR
SW
38
5 0.129 0.106 1.213 0.843 0.825 1.021 1.187 6 0.120 0.075 1.596 0.884 0.881 1.004 1.590 μ 0.097 0.075 1.306 0.879 0.872 1.007 1.297 SE 0.013 0.010 0.065 0.011 0.013 0.003 0.066
Table 2.2. Consistent small-world network properties across animals
The small-world (SW) metric was calculated as a ratio of the relative clustering coefficient (CC) to the relative characteristic path length (PL). Relative CC and PL were calculated as a ratio of the average values from the actual data (A) to that of randomly generated permutations (R). As small-world networks exhibit higher local clustering and similar path lengths compared to random networks, we would expect CC > 1 and PL = 1. A SW value significantly greater than 1 indicates that the network exhibited small-world properties. μ = mean, SE = Standard Error.
List 1. Anatomical abbreviations. abbreviation name
18 area 18
19 area19
20 area 20
20a area 20a
20b area 20b
21 area 21
A amygdala
A1 primary auditory cortex AAF anterior auditory field ac anterior commissure ADF anterior dorsal field AEG anterior ectosylvian gyrus
ALLS anteriolateral lateral suprasylvian cortex AMLS anterior medial lateral suprasylvian
cortex
AON anterior olfactory nucleus AP pretectal area
ASG anterior sigmoid gyrus AVF anterior ventral field
cc corpus callosum
Cb cerebellum
39
CL claustrum
CNG coronal gyrus
dPFC dorsal prefrontal cortex
f fornix
Ent entorhinal cortex
Hip hippocampus
Hy hypothalamus
IC inferior colliculus LG lateral gyrus
LGN lateral geniculate nucleus
LRSS lateral bank of rostral suprasylvian sulcus
mPFC medial prefrontal cortex M1 primary motor cortex MEG medial ectosylvian gyrus MGN medial geniculate nucleus
MRSS medial bank of rostral suprasylvian sulcus
NC caudate nucleus OB olfactory bulb
och optic chiasm
OBG orbital gyrus, orbital cortex opt optic tract
PAG periaqueductal grey PEG posterior ectosylvian gyrus Pir piriform cortex
PL prelimbic cortex
PM premotor cortex
PN pontine nuclei
PPc posterior parietal cortex, caudal part PPF posterior pseudosylvian field PPr posterior parietal cortex, rostral part PRG proreal gyrus
proCNG CNG-like cortex bordering CNG rostrally
proPPF PPF-like cortex bordering PPF rostrally proPSG PSG-like cortex bordering PSG rostrally PSC postsplenial cortex
PSSC pseudosylvian sulcal cortex PSF posterior suprasylvian field PSG posterior sigmoid gyrus
RN red nucleus
RSG retrosplenial cortex
S1 primary somatosensory cortex S2 secondary somatosensory cortex S3 tertiary somatosensory cortex SC superior colliculus
S septal nuclei
40 SSy suprasylvian cortex
Tha thalamus
Tu olfactory tubercle VP vetroposterior field
41 REFERENCES
Achard S, Salvador R, Whitcher B, Suckling J, Bullmore E (2006) A resilient, low-frequency, small-world human brain functional network with highly connected association cortical hubs. J Neurosci 26:63-72.
Andrews-Hanna JR, Reidler JS, Sepulcre J, Poulin R, Buckner RL (2010) Functional-anatomic fractionation of the brain's default network. Neuron 65:550-562.
Atiani S, David SV, Elgueda D, Locastro M, Radtke-Schuller S, Shamma SA, Fritz JB (2014) Emergent selectivity for task-relevant stimuli in higher-order auditory cortex. Neuron 82:486-499.
Bajo VM, Nodal FR, Bizley JK, Moore DR, King AJ (2007) The ferret auditory cortex: descending projections to the inferior colliculus. Cereb Cortex 17:475-491.
Baliki MN, Chang PC, Baria AT, Centeno MV, Apkarian AV (2014) Resting-sate functional reorganization of the rat limbic system following neuropathic injury. Sci Rep 4:6186.
Barks SK, Parr LA, Rilling JK (2015) The default mode network in chimpanzees (Pan troglodytes) is similar to that of humans. Cereb Cortex 25:538-544.
Barnette AR, Neil JJ, Kroenke CD, Griffith JL, Epstein AA, Bayly PV, Knutsen AK, Inder TE (2009) Characterization of brain development in the ferret via MRI. Pediatr Res 66:80-84.
Barttfeld P, Uhrig L, Sitt JD, Sigman M, Jarraya B, Dehaene S (2015) Signature of consciousness in the dynamics of resting-state brain activity. Proc Natl Acad Sci USA 112:887-892.
Basole A, White LE, Fitzpatrick D (2003) Mapping multiple features in the population response of visual cortex. Nature 423:986-990.
Beckmann CF, Smith SM (2004) Probabilistic independent component analysis for functional magnetic resonance imaging. IEEE Trans Med Imaging 23:137-152.
Beckmann CF, DeLuca M, Devlin JT, Smith SM (2005) Investigations into resting-state connectivity using independent component analysis. Philos Trans R Soc Lond B Biol Sci 360:1001-1013. Belcher AM, Yen CC, Stepp H, Gu H, Lu H, Yang Y, Silva AC, Stein EA (2013) Large-scale brain
networks in the awake, truly resting marmoset monkey. J Neurosci 33:16796-16804.
Biswal B, Yetkin FZ, Haughton VM, Hyde JS (1995) Functional connectivity in the motor cortex of resting human brain using echo-planar MRI. Magn Reson Med 34:537-541.
42
Bizley JK, Shinn-Cunningham BG, Lee AK (2012) Nothing is irrelevant in a noisy world: sensory illusions reveal obligatory within-and across-modality integration. J Neurosci 32:13402-13410. Bizley JK, Nodal FR, Nelken I, King AJ (2005) Functional organization of ferret auditory cortex. Cereb
Cortex 15:1637-1653.
Bizley JK, Bajo VM, Nodal FR, King AJ (2015) Cortico-Cortical Connectivity Within Ferret Auditory Cortex. J Comp Neurol 523:2187-2210.
Brodmann K (1909) Vergleichende Lokalisationslehre der Grosshirnrinde. Leipzig: Johann Ambrosius Barth.
Brusa L, Ponzo V, Mastropasqua C, Picazio S, Bonni S, Di Lorenzo F, Iani C, Stefani A, Stanzione P, Caltagirone C, Bozzali M, Koch G (2014) Theta burst stimulation modulates cerebellar-cortical connectivity in patients with progressive supranuclear palsy. Brain Stimul 7:29-35.
Buckner RL, Andrews-Hanna JR, Schacter DL (2008) The brain's default network: anatomy, function, and relevance to disease. Ann N Y Acad Sci 1124:1-38.
Bullmore E, Sporns O (2012) The economy of brain network organization. Nat Rev Neurosci 13:336-349.
Cantone G, Xiao J, McFarlane N, Levitt JB (2005) Feedback connections to ferret striate cortex: direct evidence for visuotopic convergence of feedback inputs. J Comp Neurol 487:312-331.
Collin G, Sporns O, Mandl RC, van den Heuvel MP (2014) Structural and functional aspects relating to cost and benefit of rich club organization in the human cerebral cortex. Cereb Cortex 24:2258-2267.
Damoiseaux JS, Rombouts SA, Barkhof F, Scheltens P, Stam CJ, Smith SM, Beckmann CF (2006) Consistent resting-state networks across healthy subjects. Proc Natl Acad Sci USA 103:13848-13853.
Duque A, McCormick DA (2010) Circuit-based localization of ferret prefrontal cortex. Cereb Cortex 20:1020-1036.
Empie K, Rangarajan V, Juul SE (2015) Is the ferret a suitable species for studying perinatal brain injury? Int J Dev Neurosci 45:2-10.
Fox MD, Buckner RL, White MP, Greicius MD, Pascual-Leone A (2012) Efficacy of transcranial magnetic stimulation targets for depression is related to intrinsic functional connectivity with the subgenual cingulate. Biol Psychiatry 72:595-603.