ABSTRACT
A national sample of PhD-trained scientists completed training, accepted subsequent em-ployment in academic and nonacademic positions, and were queried about their previous graduate training and current employment. Respondents indicated factors contributing to their employment decision (e.g., working conditions, salary, job security). The data in-dicate the relative importance of deciding factors influencing career choice, controlling for gender, initial interest in faculty careers, and number of postgraduate publications. Among both well-represented (WR; n= 3444) and underrepresented minority (URM; n= 225) respondents, faculty career choice was positively associated with desire for autonomy and partner opportunity and negatively associated with desire for leadership opportunity. Differences between groups in reasons endorsed included: variety, prestige, salary, family influence, and faculty advisor influence. Furthermore, endorsement of faculty advisor or other mentor influence and family or peer influence were surprisingly rare across groups, suggesting that formal and informal support networks could provide a missed opportunity to provide support for trainees who want to stay in faculty career paths. Reasons requir-ing alteration of misperceptions (e.g., limited leadership opportunity for faculty) must be distinguished from reasons requiring removal of actual barriers. Further investigation into factors that affect PhDs’ career decisions can help elucidate why URM candidates are dis-proportionately exiting the academy.
INTRODUCTION
For the past decade, research institutions across the United States have experienced unprecedented growth in career services for PhD trainees. Professional organizations that support graduate student and postdoctoral training and career development have witnessed exponential growth in membership. Both the Graduate Career Consortium and the National Postdoctoral Association have experienced this change, spurred in part by the growing acceptance of a shifting academic landscape away from traditional tenure-track faculty roles for PhD graduates. As research institutes recognize the pau-city of available faculty positions (Schillebeeckx et al., 2013; Alberts et al., 2014) and a growing need to include career training in graduate programs (Gould, 2011; Nature, 2011; Leshner, 2015), many are committing funding and personnel to support PhDs’ and postdocs’ career decision-making processes (Broadening Experiences in Scientific Training, 2014).
Diversity within faculty ranks (and throughout the biomedical workforce) has been a national focus for decades (National Institutes of Health [NIH], 2011), yet it is disap-pointing that more progress toward diversification has not been made and that under-represented minority (URM) scientists continue to disproportionately exit academia Rebekah L. Layton,†* Patrick D. Brandt,† Ashalla M. Freeman,† Jessica R. Harrell,† Joshua D. Hall,† and Melanie Sinche‡§
†Office of Graduate Education, University of North Carolina at Chapel Hill, Chapel Hill, NC 27599; ‡Jackson Laboratory for Genomic Medicine, Farmington, CT 06032; §Labor & Worklife Program,
Harvard Law School, Cambridge, MA 02138
Diversity Exiting the Academy: Influential
Factors for the Career Choice of
Well-Represented and Underrepresented
Minority Scientists
Kenneth Gibbs Monitoring Editor Submitted January 16, 2016; Revised June 20, 2016; Accepted June 21, 2016
DOI:10.1187/cbe.16-01-0066
*Address correspondence to: Rebekah L. Layton ([email protected]).
(NIH, 2011; Tabak and Collins, 2011; Valantine and Collins, 2015). The benefits of having a diverse training pool, work-force, and faculty (e.g., improved productivity, innovation, cre-ativity; Valantine and Collins, 2015) should lead to increased faculty hiring and maintenance of a diverse workforce, yet an exodus occurs despite efforts to retain prospective faculty candi-dates. Previous research has shown that interest in faculty careers decreases over the course of academic training (Fuhr-mann et al., 2011; Sauer(Fuhr-mann and Roach, 2012), a finding con-sistent across gender, racial, and ethnic backgrounds (Gibbs and Griffin, 2013). To be sure, this affects retention of scientists in academia broadly, not just URM respondents.
Decreasing interest in faculty careers is seen across social identity groups (i.e., race/ethnicity, gender, and their intersec-tion), and findings also indicate that social identity can play a distinct role in shaping career progression (Gibbs and Griffin, 2013). These findings indicate that personal values vary by social identity, and these in turn impact career interest levels. For example, URM scientists interested in faculty careers fre-quently mentioned the importance of being a role model, men-toring others, and serving their communities, whereas aca-demic freedom was mentioned more frequently by those from well-represented (WR) populations (Gibbs and Griffin, 2013). Other studies (Gibbs et al., 2014) have explored social identity and the magnitude of change in faculty career interest within groups. More recent work (Gibbs et al., 2015) has examined not only changing interest in faculty careers between URM and WR scientists but the significance of other factors in this decline in interest. In this study, a number of potential influences were examined, including personal disposition variables (e.g., inter-est in faculty career, confidence), objective performance vari-ables (e.g., publication and productivity measures), and gradu-ate training experience (e.g., sense of belonging in academia/ department, or advisor/career support). The aforementioned studies prompted the inclusion of relevant control variables in our own analyses. Yet previous studies looked only at faculty career interest as reported by trainees during their training periods. In contrast, the current work addresses these processes based on career decisions that have already occurred. Hence, our data explore career choices by individuals currently employed in both faculty and nonfaculty roles who have com-pleted their doctoral training.
Extending this line of research using career outcome variables posttraining (e.g., respondent is or is not now a faculty member, rather than respondent indicating interest in pursuing a faculty career during training) allowed us to identify which factors were of particular importance for scientists who accepted faculty ver-sus nonfaculty positions. We examined actual reasons cited by scientists for their choice to pursue and accept their current posi-tions, reasons that may have held greater or lesser importance during their academic training. This analysis revealed interesting trends across groups and some differences between WR and URM respondents over and above previously identified effects that could influence interest in a faculty career (e.g., Gibbs et al., 2015). To our knowledge, this study is the first of its kind exam-ining science PhDs’ reasons for accepting their current employ-ment roles, completed retrospectively after all training period(s). These data allow us to examine how specific factors impacted eventual career decisions for early-career scientists considering employment in (and outside) the academic workforce.
METHODS Procedures
The current sample of science, technology, engineering, and mathematics PhDs is taken from a larger data set collected via an Internet-based survey (see relevant questions from the survey in the Supplemental Material) using Qualtrics and was distributed widely via professional email listservs and social media sites such as LinkedIn. Calls for participation were also disseminated via online blogs in Nature (Gould, 2015) and Science (Benderly, 2015). Respondents were encouraged to share the survey broadly (e.g., snowball sampling). PhDs who earned their degree in the physical, life, computational, engi-neering, or social sciences between 2004 and 2014 and had ever worked, trained, or studied in the United States were invited to participate. Participation was voluntary, and all respondents could choose to be entered in a lottery for one of five $100 Amazon.com gift cards. All data-collection methods were approved by the Committee on the Use of Human Sub-jects at Harvard University (see Study IRB15-0063).
The current investigation includes data from only those respondents who had continued on to full-time or part-time employment from either doctoral or postdoctoral training. Career category classifications were based on current job title and employer, and from answers provided only by those with perma-nent employment who were asked follow-up questions about their employer. Because postdoctoral trainees had not yet accepted a permanent position at the time of the survey, no data regarding employment choice were available for this population.
Participants
Respondents included 8099 individuals; of those, 3669 pro-vided usable data containing employment information and thus were included in the current analyses (WR, n = 3444; URM, n = 225). The survey sample included respondents who identi-fied as follows: 77% white, 13% Asian American, 4% Hispanic/ Latino, and 2% black/African American. A further 2% identified as “other,” and an additional 3% indicated they preferred not to respond. The remaining options combined represented <1%: Native Hawaiian/Pacific Islander and American Indian/Alaska Native. Forty-three percent identified as male, 57% identified as female, and <1% (combined) identified as transgender, other, or indicated that they preferred not to respond (see the Supple-mental Material for selected items and answer choices).
URMs were classified consistent with NIH definitions (NIH, 2015a,b) such that the following categories were used for bivariate analyses: (0) WR, consisting of white and Asian; or (1) URM, consisting of black/African American, Hispanic/ Latino, American Indian/Alaska Native, and Native Hawaiian/ Pacific Islander. In lieu of information indicating they should be classified definitively as URM or WR, respondents who indicated “other” or that they preferred not to respond could not be clas-sified as WR or URM. Some chose to write in additional informa-tion, and those who specified variations of “mixed,” “multira-cial,” or indicated one of the above URM categories in their write-in text (n = 22) were classified as URM. In the full sample, 93% were classified as WR, and 7% were classified as URM.
Measures
A description of each variable and the process used to create it can be found in the following sections. To conduct the appro-priate analyses, we recoded select variables into bivariate alter-native formats.1 The Supplemental Material contains text of the
questions and possible responses.
Reasons for Accepting Current Position. The primary research question was examined using the following question: “Why did you accept your current position in this field? Check all that apply,” with 17 possible response options, including “other” as a possible selection (see the Supplemental Material). The composi-tion of this list was heavily influenced by use of the University of Denver (n.d.) Work Values list and was refined by informal observations of common responses after many years of use with trainees in one-on-one career counseling interactions and career seminars. Each answer generated a “0” (not selected) or “1” (endorsement) response for each participant. Survey participants could choose as few or as many responses as desired, including the option to endorse multiple reasons for choosing their current positions. Endorsements were used to generate the primary vari-ables of interest, entitled “reasons for accepting position” in each table. Each reason was evaluated as a potential factor in the career decision-making process as it relates to actual job choices (as opposed to statement of career interest or predicted job choice, which have been evaluated in previous studies).
Job Category and Classification. A combination of self-re-ported job title, employer, and faculty status were used to bin respondents into academic faculty versus nonfaculty classifica-tions. An independent coder binned all entries based on multi-ple-choice selections provided for job titles (110 options, including “other” and “don’t know”; see the Supplemental Material). These assignments were used to recode job titles into selected subcategories using SPSS syntax. Each of the “other” entries was manually binned into existing job categories to reduce the amount of “other” selections that could not be coded automatically. For quality assurance, a subset of the data was manually reviewed to ensure that the assigned code matched the information on file. Finally, a bivariate proxy variable was created to differentiate faculty (all academic institution types, including research institutions, liberal arts colleges, and com-munity colleges, plus any faculty job title, e.g., assistant profes-sor, research associate profesprofes-sor, clinical professor) from all other jobs (examples of nonfaculty job include industry, gov-ernment, etc.). Henceforth, the term “faculty career path” will be consistent with this definition of various faculty types. This variable was used as the dependent variable in logistic regres-sion. Table 1 presents the number of respondents from our sample in faculty and nonfaculty positions.
Analyses. Binary logistic regression will be used to evaluate the effects of relevant independent variables (employment rea-sons, either endorsed or not endorsed) on a bivariate categor-ical outcome variable (choosing a faculty or nonfaculty career). In addition to the variables of interest, control variables will
be tested as independent variables to control for confounding effects, either categorical such as male/female or continuous such as number of publications. By using a stepwise function, we will control for any preexisting related variables in step 1 of the analysis (see Control Variables) and evaluate each of the endorsement reasons in step 2. Those endorsed employment reasons that added explanatory power to the analyses even after accounting for related control variables will be indicated by a significant probability value (p < 0.05). Each significant variable will have an associated odds ratio (OR) and a confi-dence interval (CI), with OR and CI greater than 1.0 indicat-ing a greater likelihood of beindicat-ing a faculty member (OR < 1.0, less likely to become a faculty member). For instance, a signif-icant p value (p < 0.01) with an OR of 2.0 means that a person who endorses that reason is twice as likely to be a faculty member, whereas an OR of 0.5 means that one would be half as likely to be a faculty member (OR ∼1.0, which is not signif-icant, would mean equally likely regardless of one’s endorse-ment). Model fit analyses can be used to determine effect sizes of the model (similar to r-squared values) and whether the model fits the data well (using a chi-squared test), estimating how much knowing the endorsements (or other independent variables) allows one to predict faculty/nonfaculty career choice.
Control Variables. The primary research question of URM/WR differences was examined using their respective separate sam-ples. However, to ensure our findings accounted for other char-acteristics that have been shown to influence faculty career suc-cess, we conducted further analyses to control for potential effects from other known variables. On the basis of previous research, we presumed that other variables such as gender,2
pro-gram entry career goals, and number of publications may also factor into successful pursuit of a faculty position, so we con-trolled for these factors. For ease of interpretation in the logistic regression, nominal control variables that were not asked in a TABLE 1. Frequency count of faculty versus nonfaculty positions by selected cross-sections of social identities
Demographics Population totals Faculty (%) Nonfaculty (%)
WR males 1479 552 (37) 927 (63)
WR females 1965 737 (38) 1228 (62)
WR subtotal 1289 2155
URM males 81 31 (38) 50 (62)
URM females 144 48 (33) 96 (67)
URM subtotal 79 146
Totals 3669 1368 (37) 2301 (63)
Percentages of WR and URM in each category are calculated using the corre-sponding gender and population subtotal found on the same row. Respondents used in faculty and nonfaculty positions collectively comprise just over half of the total respondents (n = 3669). The remaining respondents (currently employed postdoctoral scholars, n = 3254; unemployed respondents, n = 185; of those 152 self-identified as WR, and 18 identified as URM) are not included in the table.
1This also ensured adequate cell sizes when calculating odds ratios in logistic
regression, to avoid attempting to interpret differences in subgroups with inade-quate sample sizes.
binary (0/1) format were recoded into bivariate variables to provide a reference category: (0) man or (1) woman; and to compare outcomes: (0) all other careers or (1) university faculty (research and/or teaching intensive). Variables were treated as scaled variables whenever possible (e.g., 0–30+ publications since PhD completion).3
RESULTS
Participants in this study were surveyed about their current pro-fessional roles and the various factors that influenced their career choices. As shown in Table 1, 63% (n = 2301) were in nonfaculty positions and 37% of respondents (n = 1368) were in faculty positions. Among URM respondents, 38% of male URM respondents, n = 31, and 33% of female URM respon-dents, n = 48, indicated they were in faculty positions. These numbers are comparable to the WR respondents, among whom 37% of males, n = 552, and 38% of females, n = 737, indicated they were in faculty positions. Demographic and employment data are detailed in Table 1.
Overall importance of career decision factors endorsed by respondents are indicated by rank order in Table 2 (ranked by total number of endorsements). It is important to recall that survey respondents could choose, and usually did, multiple rea-sons for accepting current position (endorsements). On aver-age, respondents endorsed four reasons per person. The per-centages in Table 2 represent the subsample of respondents
who endorsed each particular reason as a percentage of each subgroup of interest (WR faculty, WR nonfaculty, URM faculty, and URM nonfaculty). Of greatest importance to all respon-dents, cited by more than half the sample, were working condi-tions, geographic location, intellectual challenge, and salary/ benefits. Reasons cited by fewer than one-tenth of respondents and with fewer than 300 endorsements, included family influ-ence, faculty advisor influinflu-ence, other mentor influinflu-ence, and peer influence. The remainder fell in the middle (in the follow-ing order from most to least cited): job security, leadership, autonomy, partner opportunity, variety, prestige, only job offer, position unavailable, and other.
Given the low number of URM scientists who accept faculty positions (see Table 1), we further explored the factors that influence a trainee’s decision to follow (or not follow) the fac-ulty career path (see Table 2). A more detailed subdivision (Table 2) allows for a comparison of the rate of endorsement by faculty/nonfaculty from each group (WR and URM respondents; see Table 2). This will be discussed further as a complementary visualization of results presented in the logistic regression.
Logistic regression analyses were used to examine the rela-tive importance of 17 possible reasons cited for pursuing differ-ent reported career paths. This analysis allowed us to compare the relative importance of support from various areas (e.g., peers, family, mentors) and/or need fulfillment/satisfaction in various areas (e.g., autonomy, working conditions/schedule flexibility, salary/benefits) while controlling for key variables identified in previous work (e.g., gender, initial interest in fac-ulty career, postgraduate publications; see commentary on Gibbs and Griffin, 2013, in the Introduction). We used logistic regression to identify factors with explanatory power in each group (within WR and URM samples, respectively) and to estimate the impact of each reason via the significance and TABLE 2. Endorsed reasons for accepting current position for WR versus URM scientists by faculty versus nonfaculty
WR URM
Reasons Totala % WR faculty % WR nonfaculty WRa total % URM faculty % URM nonfaculty URMa total
Geographic location 2412 65 39 2270 73 57 142
Working conditions 2411 65 39 2274 65 58 137
Intellectual challenge 2079 56 34 1971 51 47 108
Salary/benefits 2066 47 28 1949 52 51 117
Job security 1244 36 21 1175 35 27 69
Leadership 1071 24 15 986 27 44 85
Autonomy 887 34 20 843 30 14 44
Partner opportunity 847 28 17 799 34 14 48
Variety 783 13 8 740 11 23 43
Prestige 773 23 14 726 22 21 47
Only job offer 764 24 14 720 20 18 44
Position unavailable 335 9 5 315 8 9 20
Other 302 8 5 292 5 6 10
Family influence 283 11 7 262 13 7 21
Faculty advisor influence 233 11 7 223 6 3 10
Other mentor influence 220 8 5 206 9 5 14
Peer influence 126 4 2 116 6 3 10
Reasons are listed in order from most endorsements to least endorsements from total sample (number of endorsements for entire sample indicated in “Total” column). Each participant could endorse as many (or as few) reasons as applicable for the acceptance of their current positions. Percentages indicate the percent of respondents from each subgroup who chose that endorsement. For example, 65% of WR respondents in faculty positions chose “geographic location” as one of their responses in response to the query “Why did you accept your current position in this field? Check all that apply.”
aIndicates number of endorsements (may differ from n = total number of respondents)
magnitude of the factor, as indicating the likelihood of pursuing a faculty career given endorsement of that reason.
In comparing the results of logistic regressions for the WR and URM samples, we first evaluated model fit for the model in each sample (WR and URM), including control variables and cited reasons for a respondent’s choice of current job. In both cases, the full model was significant, p < 0.001. Stepwise con-ditional selection was used to select a parsimonious model (WR, 8 iterations; URM, 3 iterations; only final steps reported). In the WR sample, the final model, χ2(20, 3444) = 503.90, p <
0.001, Cox and Snell r2 = 0.14, Naglekerke r2 = 0.19. For URM,
the final model was also significant and had predictive power, χ2(6, 225) = 41.25, p < 0.001, Cox and Snell r2 = 0.17,
Naglekerke r2 = 0.23. The significance of the model in both
samples is consistent with the conclusion that a model includ-ing reasons for job choice provides significant explanatory power to help explain career choice.
During step 1 of a stepwise logistic regression analysis, we entered the following control variables into the analysis based on previous work: gender, initial program entry career goals, and number of postgraduate publications. Of these, only num-ber of publications was consistently significantly associated with faculty career choice in both samples (positively), with both WR and URM samples slightly more likely to choose a faculty career if they had more publications (see Tables 3 and 4). We included the control variables for thoroughness; how-ever, neither of the other control variables was significant for URM scientists (ps > 0.088), whereas gender was a significant predictor for WR scientists, slightly favoring male scientists (see Table 3). Nonetheless, any differences in variance accounted for by these variables were accounted for in the current analy-sis, because they were included as covariates in the model.
After the significance of the model was established and con-trol variables were accounted for in step 1, we progressed to step 2, which involved examination of individual reasons for
significant impact on career decisions/outcomes using a for-ward stepwise regression method. The model was predictive of job choice with patterns (i.e., significance) and weighting of importance (i.e., magnitude of ORs) for cited reasons differing across the two samples—dramatically, in some areas. Logistic regression results, including ORs, are presented for WR and URM respondents in Tables 3 and 4, respectively.
We identified common trends for faculty career choice asso-ciations with autonomy and partner influence and with leader-ship opportunity. In the WR sample, we identified the follow-ing: significant positive relationships between faculty career choice and autonomy, faculty advisor influence, family influ-ence, partner opportunity, and prestige; and significant nega-tive relationships between faculty career choice and leadership opportunity, salary/benefits, and variety (see Table 3). Simi-larly, for URM respondents, autonomy and opportunities for partner showed a significant positive association, and leader-ship opportunity showed a significant negative association with faculty career choice (see Table 4).
This pattern of findings already controlled for other explana-tory variables (e.g., gender, initial career interests, and post-graduate publications). The lack of faculty advisor’s influence among respondents was surprising overall, and more so because no significant influence was evident for URM respondents. The effect of mentors besides the primary research advisor was a nonsignificant contributor to faculty career choice in both sam-ples as well. Overall, a relatively low endorsement of advisor or alternate mentor influence (cited least frequently, followed only by peer influence; see Table 2). The low ranking of influence of others (including advisor, mentors, peers, and family), in com-bination with the low raw score frequency of endorsement by respondents, suggests that a focus on influence of others, includ-ing faculty advisors, could be beneficial for graduate traininclud-ing. Similarities and differences for career choice factors across both populations are addressed further in the Discussion.
DISCUSSION
There is a clear pattern across both populations supporting the importance of working conditions, geographic location, intel-lectual challenge, and salary/benefits on career decisions. Of the least cited reasons for career choice, professional and social TABLE 3. Logistic regression of WR reasons for accepting current
position for faculty (1289) versus nonfaculty (2155) roles
Variable OR 95% CI p Value
Control variables (step 1)
Gender*(F-) 0.84 (0.72–0.98) 0.026
Initial faculty career interest 1.24 (0.98–1.56) 0.066
Postgraduate publications*(+) 1.10 (1.08–1.13) <0.001
Reasons for accepting position (step 2)
Autonomy*(+) 2.85 (2.37–3.41) <0.001
Faculty advisor influence*(+) 2.59 (1.89–3.53) <0.001
Family influence*(+) 1.90 (1.44–2.51) <0.001
Partner opportunity*(+) 1.36 (1.15–1.62) <0.001
Prestige*(+) 1.31 (1.08–1.60) 0.006
Leadership*(−) 0.63 (0.52–0.75) <0.001
Salary/benefits*(−) 0.53 (0.45–0.62) <0.001
Variety*(−) 0.41 (0.33–0.51) <0.001
Logistic regression output indicate relative odds of each factor being associated with accepting a faculty position as compared with a nonfaculty position (OR) for the WR sample while controlling for other variables listed. Confidence intervals of 95% are included for each odds ratio (95% CI), with values > 1.0 indicating a higher likelihood of a faculty position. p Values of < 0.05 (The factors with aster-isks) indicate a significant effect. Plus and minus symbols (+/−) illustrate the directionality of the effect toward or away from a faculty career.
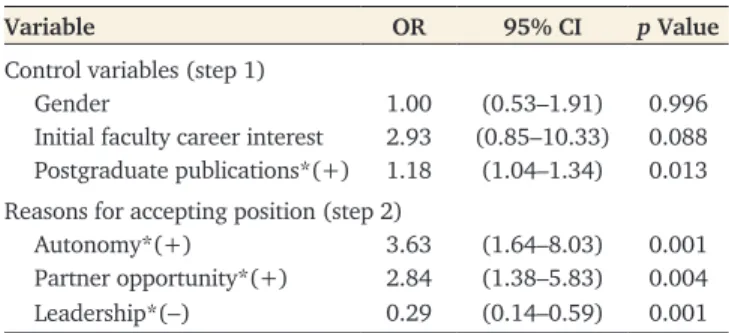
TABLE 4. Logistic regression of URM reasons for accepting current position for faculty (79) versus nonfaculty (146) roles
Variable OR 95% CI p Value
Control variables (step 1)
Gender 1.00 (0.53–1.91) 0.996
Initial faculty career interest 2.93 (0.85–10.33) 0.088
Postgraduate publications*(+) 1.18 (1.04–1.34) 0.013
Reasons for accepting position (step 2)
Autonomy*(+) 3.63 (1.64–8.03) 0.001
Partner opportunity*(+) 2.84 (1.38–5.83) 0.004
Leadership*(−) 0.29 (0.14–0.59) 0.001
support represent areas of growth that could provide an oppor-tunity to increase the number of URM trainees pursuing faculty careers. While some important predictor categories were shared (autonomy, leadership opportunity, and partner opportunity), WR and URM respondents differed on some variables, notably the impact that advisors (both family members and faculty advisors) had on the selection of a faculty career path. Addi-tionally, the negative association between leadership opportu-nity and faculty career choice in both groups was an unexpected finding.
Control Variables
The analyses controlled for key variables to ensure that identi-fied effects (of career choice reasons as independent variables) could not be explained by other variables that have been shown to affect career interests. Consistent with previous research on faculty career interest showing that graduate publication records were positively associated with faculty career choice, number of publications did not fully explain WR/URM differences in faculty career interest (Gibbs et al., 2015). We found that postgraduate publications were positively associated with faculty career choice in both WR (OR: 1.10, p < 0.001) and URM (OR: 1.18, p < 0.013) samples yet did not cancel out other differences (e.g., reasons for career choices). Gender did not show a consistent effect across both groups (WR effect only, OR: 0.84, p < 0.026), and we speculate that perhaps WR women may have had expe-riences more similar to URMs of both genders. Further research could examine this intersection of gender and other minority status. There was no effect of faculty interest at entry to doctoral program (neither sample significant, ps = 0.066–0.088); it is pos-sible that this effect may be dampened when actual career deci-sions are made. Recall bias may be a factor in this discrepancy as well, since respondents may not accurately recall their desire to enter particular occupations. Additionally, social desirability bias is a risk, as respondents may seek to align any former interests with their current employment.
Similar Patterns
Important factors across groups included endorsement of autonomy, partner opportunity, and leadership opportunity. The positive association with autonomy is consistent with pre-vious findings (especially for WR males; Gibbs and Griffin, 2013). An association between partner opportunity and faculty career is also unsurprising (perhaps related to working condi-tions such as flexibility of schedule). However, it is surprising that there was a negative association with leadership opportu-nity and faculty career choice in both groups, suggesting there may be a perception that leadership opportunity is not as read-ily available or required in faculty versus nonfaculty types of positions, which contrasts with the many leadership roles fac-ulty members are often expected to fulfill.
Autonomy
Across both groups, autonomy was strongly (positively) associ-ated with choosing a faculty career. This finding was unsurpris-ing in that independent research as a faculty member is both expected and encouraged in an academic setting, with a great deal of latitude in defining one’s research and even one’s role within the department and institution (e.g., committee mem-bership/service, teaching course load, and other negotiable
responsibilities). Thus, a customizable career in which one has a high level of personal choice and independence is congruent with a desire for autonomy. This is comparable with previous focus group commentary indicating the importance of auton-omy for faculty career interest in at least some trainees (identi-fied especially for WR male trainee trends using qualitative data; Gibbs and Griffin, 2013), but to our knowledge, this is the first time this has been demonstrated as a decision factor in actual career outcomes. In addition, our data suggest that autonomy was a significant factor for both WR (OR: 2.85, p < 0.001) and URM (OR: 3.63, p < 0.001) scientists. Previous qualitative data suggested this factor may be more important for WR scientists, but in our sample using quantitative methods to compare the two, this reason was a significant predictor of faculty career choice for both WR and URM scientists, and in fact was stronger for URMs.
Partner opportunity
Partner opportunity was positively associated with a faculty career choice in both the WR (OR: 1.36, p < 0.001) and URM (OR: 2.84, p < 0.004) samples; however, this effect was nearly twice as strong for URM respondents (almost three times more likely to choose a faculty career if partner opportunity were endorsed than if not) than for WR respondents (less than one and a half times more likely given partner opportunity endorsed). The association with partner opportunity could indicate either that the decision of the particular career in question (academic faculty member) or the particular position accepted (at a partic-ular institution) was strongly influenced by available partner opportunity. While the question wording makes this harder to interpret, the lack of differential effect for endorsing geographic region toward (or contrary to) a faculty career choice makes the regional opportunity explanation less likely. Thus, it may be that academic faculty careers are seen as more compatible with desired partner opportunity (perhaps flexibility, related to the previously mentioned autonomy associated with academic fac-ulty positions, or the fact that a variety of opportunities often exist in cities and towns that house academic institutions).
Leadership Opportunity Perceptions
Endorsing a desire for leadership opportunity, however, was negatively associated with academic faculty career choice. We found it surprising that the desire for leadership opportunity was negatively associated with faculty career aspirations in both WR (OR: 0.63, p < 0.001) and URM (OR: 0.29, p < 0.001) samples, as this perception seems discordant with faculty duties, which often require leadership in many realms. For example, faculty are expected to be independent leaders of their research groups (e.g., lab managers, leaders of creative direction of research) and among their peers through participa-tion in departmental and university-wide service initiatives. Furthermore, later career moves for faculty members often include administrative leadership positions, perhaps including departmental chair or deanship opportunities. Successful aca-demic institutions require good leaders, so the perception that academia is not a place where leadership is valued or promoted may be problematic.
drawn to for-profit careers in which business leadership is highly valued and well compensated. It may be that the word-ing of the question (“Why did you accept your current position in this field? Check all that apply,” with “Leadership opportu-nity” being one of 17 options) favors a positive response from respondents who took a position in which immediate leader-ship opportunity was clearly part of the job description. Perhaps new assistant professors feel that leadership opportunity exists only on the other side of attaining tenure.
To counter this misperception in an effort to increase URM movement into faculty positions, measures could be taken to alter the false perception that leadership opportunity does not exist in academia. In part, this may simply be a failure to com-municate to trainees the importance of leadership in an aca-demic environment if it is assumed to be self-evident. Other ideas to promote the perception of leadership as important in faculty roles could be to include leadership as a factor in tenure promotions, to increase recognition of faculty leader activities and impact in university publications, or to highlight leadership activities of local faculty using seminar series and other forms of dissemination to trainees.
Distinct Patterns
Distinct patterns that emerged included reasons such as pres-tige, salary, variety, and influence of family and academic fac-ulty advisors. Two factors that emerged as indicators of facfac-ulty career choice for WR respondents yet not for URMs, were fac-ulty advisor influence and family influence. Family and peer influence were not frequently cited overall, and neither family nor peer influence was significant for URMs. Other factors that were significant predictors for WR respondents but not for URMs included prestige, salary/benefits, and variety.
Prestige, Variety, and Salary. We found moderately positive associations in the WR sample for a faculty career choice with prestige (OR: 1.31, p < 0.006), and negative associations with salary (OR: 0.53, p < 0.001) and variety (OR: 0.41, p < 0.001). In terms of prestige, it is possible that WR and URM cultures may place a different value on attaining a faculty position, espe-cially in cases of first-generation students, but this remains to be tested. For WR respondents, salary/benefits was negatively associated—respondents who endorsed salary were only half as likely to choose a faculty position. These results are straightfor-ward to interpret, given faculty wage discrepancies with market value in other fields, such as private industry. Variety showed a similar pattern to salary, in that respondents were less than half as likely to choose a faculty career if they endorsed variety as a reason for their choice. In contrast, for URM scientists, none of these endorsements were significantly associated. Thus, these populations may differ in these respects. Future research should delve into why perceptions of prestige, salary, or variety could differ between populations, a question that we are unable to address with the available survey data.
Influence of Others. Influence of others, such as family,
showed different patterns of influence for WR/URM respon-dents. Neither family influence nor peer influence was signifi-cantly associated with faculty career choice for URM respon-dents, whereas for WR responrespon-dents, family influence (OR: 1.90, p < 0.001) was a significant positive predictor. We
expected community and family to play a significant role in influencing this decision as compared with WR respondents, based on previous literature (Lent et al., 1994, 2000; Hackett and Byars, 1996; Byars-Winston et al., 2010); however, this turned out not to be the case. Yet family may have been con-flated with partner opportunity (e.g., partner influence possibly more heavily weighted) and hence might have been perceived as accounted for in this sense. We did not find evidence that peer influence had an effect on this decision in either sample. Given that only a small number of URM PhDs are going into an already sparsely URM-populated faculty career trajectory, iden-tifying potential reasons for career choices in future studies, and especially any differences between groups, is crucial.
Faculty Advisor Influence. Despite the surprising lack of
endorsements across groups, there was also a difference in effects of faculty influence between the two groups for the influence of those presumably in a prime position to influence career choices (faculty advisors). WR respondents were more likely (OR: 2.59, p < 0.001) to pursue a faculty career if they endorsed faculty advisor influence; unexpectedly, this was not a significant factor in faculty career choice for URM respon-dents. This was unusual in comparison with other factors that differed, in that the magnitude of faculty advisor effect for WR respondents was large (versus other differing factors having a small effect, or an effect trending in a similar direction for both samples; see Table 2). These results suggest there is room for greater influence of mentoring relationships from PhD advisors as well as other potential mentors for all trainees, and espe-cially for URM trainees with an early interest in future academic faculty careers. Many resources exist for institutions wishing to augment mentor training (e.g., Handelsman et al., 2005; Landefeld, 2009; Lee et al., 2007; Fleming et al., 2013; Pfund et al., 2013, 2015; Howard Hughes Medical Institute, 2016).
Limitations
The findings presented identify influential factors in career decisions across groups for PhDs and also suggest possible dif-ferences between the WR/URM samples; yet these difdif-ferences should be interpreted with caution. As noted, some factors that were significant for WR respondents did not achieve signifi-cance in the URM sample. This may be due to WR/URM group differences in career decision making (e.g., priority of reasons), could be due to differing treatment of WR/URM trainees, or could be due to lower power in the URM sample.
suggests that the contrasting results between WR and URM samples should be interpreted with caution. Although these estimates of effect sizes are in a smaller than ideal sample, they are based on the largest sample of its kind to date in graduate training and career outcome surveys, and of URM respondents specifically. While further studies should continue to examine this effect, we believe this provides a starting point for the discussion.
The sample in the study is not a random sample, and thus the results should be interpreted with caution. Further, this study is reliant on self-responses to the survey, which contains questions about both graduate training and employment out-comes. These survey items heighten the risk of both recall bias and social desirability bias, depending on the respondent’s point of view.
Owing to the multiple-choice nature of the reasons listed, which did include the possibility of endorsing an “other” cate-gory, it is important to acknowledge that each respondent may interpret these reasons differently. For instance, “working con-ditions” in the survey item specified “flexible hours, work envi-ronment, culture, etc.” as an example, yet may have been seen as globally encompassing all aspects of one’s work environ-ment; if so, that could speak to the rather high endorsement level. Likewise, it is possible that items such as “faculty advisor influence” could have been interpreted as positive (or negative) influences toward one’s career of choice. We presume that those who chose a faculty position and cited faculty advisor influence did so because it was a positive influence. However, we cannot rule out the possibility that, in some instances, such as those who cited a faculty advisor influence and chose a non-faculty career, they may have endorsed that an advisor influ-enced them away from a faculty career, although that was not the intent of the question. Ambiguity does exist in the interpre-tation of the advisor and mentor influence (i.e., which faculty advisor is meant if multiple options such as comentors, gradu-ate mentor, or postdoctoral mentor; or which person the respondent is thinking of when answering these questions). Additional investigations should include use of open-ended questions, qualitative data analyses, and specification of posi-tive/negative nature of influence to further explore these influ-ences and their effects on career choices.
CONCLUSIONS
First, the expectation that early-career faculty members should protect their research time by avoiding leadership responsibili-ties might contribute to the perception of limited leadership opportunity. This misperception could be corrected by faculty advisors and mentors highlighting the importance of faculty leadership to trainees. In addition, this could be complemented by greater publicity of successful leadership by faculty members (e.g., tenure-track recognition, awards, press releases, seminar series, leadership positions). Autonomy and partner opportu-nity are both viewed as favorably associated with faculty careers. Visibility of these benefits could be reinforced to encourage those interested in faculty careers to persist in this pursuit.
Second, it is important to address reasons URM trainee choices to enter faculty positions may differ, especially influ-ences such as those from family and faculty advisors. Family and peer influence provided limited effect toward pursuing a faculty position, especially for URM trainees, suggesting that
these social groups may not be fulfilling the “encouraging” role that they are for WR groups. This could indicate a potentially beneficial role for interventions to educate personal networks to better support trainees who wish to pursue faculty careers. Increasing faculty diversity is also crucial to increase profes-sional support networks. URM populations remain underrepre-sented in faculty positions (National Science Foundation, National Center for Science and Engineering Statistics, 2015). While it is likely that cross-cultural mentoring could be chal-lenging for any advisor or mentor, increasing URM trainees’ access to career advice from someone who shares a similar background is one way to address this challenge.
Nonetheless, both WR and URM mentors can provide effec-tive mentorship for WR and URM groups alike with some atten-tion to cross-cultural mentoring sensitivity (Limbach, 2002) using mentor-training programs to better prepare faculty to mentor cross-culturally, regardless of WR or URM status. While there have been recent advances in coaching and mentoring effectiveness (e.g., scientific evaluation of and implementation of mentor training programs [University of Wisconsin–Madison Institute for Clinical and Translational Research, n.d.]; supple-menting advisor mentorship with career coaching [Williams et al., in press, 2016]), evidence suggests that the ability to men-tor inclusively remains difficult to improve (Pfund et al., 2014). Expanding mentor-training opportunities and institutional career development support for trainees could help URM train-ees persist with academic faculty career aspirations, especially given the limitations on traditional faculty mentorship models (e.g., variation of mentor training/skills, conflict of interests, time constraints, cross-cultural conversations; Williams et al., in press, 2016). While additional career coaching is available at some institutions (e.g., NIH Broadening Experiences in Scientific Training initiative; Mathur et al., 2015; Meyers et al., 2015), many institutions do not currently offer these resources for trainees, either for academic faculty or other careers. These findings underscore the importance of increasing funding to support institutional offices or units, such as the National Research Mentoring Network and others, that provide mentor-ing opportunities and career-plannmentor-ing resources for URM junior scientists (National Institutes of Health, 2015c; National Research Mentoring Network, 2015; Howard Hughes Medical Institute, 2016). Although the current work focuses on differ-ences based on a specific social identity (e.g., URM status based on race/ethnicity), crossing boundaries of understanding is rel-evant for a multitude of social identity groups.
ACKNOWLEDGMENTS
We thank the staff and faculty of the Labor and Worklife Pro-gram at Harvard Law School, Jackson Laboratory, and Univer-sity of North Carolina’s Office of Graduate Education for their ongoing support of this research. We thank the Howard W. Odum Institute for Research in Social Science at the University of North Carolina at Chapel Hill for consultations on our statis-tical analyses. We also thank Anna B. O’Connell, Jeanette Gowen Cook, Patrick Brennwald, and David J. Mellert for their valuable comments on various versions of this article. Salaries of R.L.L and P.D.B. were supported by NIH award number DP7OD020317 to complete this work. The content contained herein does not reflect the views of the NIH, and the authors are solely responsible for its content.
REFERENCES
Alberts B, Kirschner MW, Tilghman S, Varmus H (2014). Rescuing US biomed-ical research from its systemic flaws. Proc Natl Acad Sci USA 111, 5773– 5777.
Benderly B (2015). Help solve the mystery of the disappearing Ph.D.s. Science. www.sciencemag.org/careers/2015/04/help-solve-mystery -disappearing-phds (accessed 30 March 2016).
Broadening Experiences in Scientific Training (2014). BEST home page. www .nihbest.org (accessed 8 January 2016).
Byars-Winston A, Estrada Y, Howard C, Davis D, Zalapa J (2010). Influence of social cognitive and ethnic variables on academic goals of underrepre-sented students in science and engineering: a multiple-groups analysis. J Couns Psychol 57, 205–218.
Fleming M, House S, Shewakramani V, Yu L, Garbutt J, McGee R, Kroenke K, Abedin Z, Rubio DM (2013). The Mentoring Competency Assessment: validation of a new instrument to evaluate skills of research mentors. Acad Med 88, 1002–1008.
Fuhrmann CN, Halme DG, O’Sullivan PS, Lindstaedt B (2011). Improving graduate education to support a branching career pipeline: recommen-dations based on a survey of doctoral students in the basic biomedical sciences. CBE Life Sci Educ 10, 239–249.
Gibbs KD, Griffin KA (2013). What do I want to be with my PhD? The roles of personal values and structural dynamics in shaping the career interests of recent biomedical science PhD graduates. CBE Life Sci Educ 12, 711– 723.
Gibbs KD, McGready J, Bennett JC, Griffin K (2014). Biomedical science Ph.D. career interest patterns by race/ethnicity and gender. PLoS One 9, e114736.
Gibbs KD, McGready J, Griffin K (2015). Career development among Ameri-can biomedical postdocs. CBE Life Sci Educ 14, ar44.
Gould J (2011). How to build a better PhD. Nature 528, 22–25. www .nature.com/news/how-to-build-a-better-phd-1.18905 (accessed 6 June 2016).
Gould K (2015). Career paths: tracking PhDs (blog). NatureJobs. http://blogs .nature.com/naturejobs/2015/04/22/career-paths-tracking-phds (accessed 30 March 2016).
Hackett G, Byars AM (1996). Social cognitive theory and the career develop-ment of African American women. Career Dev Q 44, 322–340. Handelsman J, Pfund C, Lauffer SM, Pribbenow CM (2005). Entering
Mento-ring: A Seminar to Train a New Generation of Scientists, Madison, WI: Howard Hughes Medical Institute.
Howard Hughes Medical Institute (2016). Resources for the Development of Early-Career Scientists. www.hhmi.org/programs/resources-early-career -scientist-development (accessed 8 January 2016).
Landefeld T (2009). Mentoring and Diversity: Tips for Students and Profes-sionals for Developing and Maintaining a Diverse Scientific Community, Dordrecht, Netherlands: Springer.
Lee A, Dennis C, Campbell P (2007). Nature’s guide for mentors. Nature 447, 791–979.
Lent RW, Brown SD, Hackett G (1994). Toward a unifying social cognitive theory of career and academic interest, choice, and performance. J Vocat Behav 45, 79–122.
Lent RW, Brown SD, Hackett G (2000). Contextual supports and barriers to career choice: a social cognitive analysis. J Couns Psychol 47, 36–49. Leshner A (2015). Rethinking graduate education. Science 349, 6246, 349. Limbach P (2002, February 15). Can a white male really be an effective
men-tor? Career Magazine. www.sciencemag.org/careers/2002/02/can-white -male-really-be-effective-mentor (accessed 8 January 2016).
Mathur A, Meyers FJ, Chalkley R, O’Brien TC, Fuhrmann CN (2015). Trans-forming training to reflect the workforce. Sci Transl Med 7, 285ed4. Meyers FJ, Mathur A, Fuhrmann CN, Obrien TC, Wefes I, Labosky PA …,
Chalkley R (2015). The origin and implementation of the Broadening Experiences in Scientific Training programs: an NIH common fund initia-tive. FASEB J 30, 507–514.
National Institutes of Health (NIH) (2011). Working Group on Diversity in the Biomedical Research Workforce. http://acd.od.nih.gov/dbr.htm (accessed 8 January 2016).
NIH (2015a). Racial and Ethnic Categories and Definitions for NIH Diversity Programs and for Other Reporting Purposes (NOT-OD-15-089). http:// grants.nih.gov/grants/guide/notice-files/NOT-OD-15-089.html (accessed 6 June 2016).
NIH (2015b). Notice of NIH’s Interest in Diversity (NOT-OD-15-053). https:// grants.nih.gov/grants/guide/notice-files/NOT-OD-15-053.html (accessed 30 March 2016).
NIH (2015c). Current Programs in the Division of Training, Workforce De-velopment, and Diversity (TWD). www.nigms.nih.gov/Training/Pages/ TWDPrograms.aspx (accessed January 2016).
National Research Mentoring Network (2015). NRMN home page. https:// nrmnet.net (accessed 8 January 2016).
National Science Foundation, National Center for Science and Engineering Statistics (2015). Women, Minorities, and Persons with Disabilities in Science and Engineering (Special Report NSF 15-311), Arlington, VA: National Science Foundation. www.nsf.gov/statistics/2015/nsf15311/ digest/nsf15311-digest.pdf (accessed 8 January 2016).
Nature (2011). Editorial. Fix the PhD. Nature 472, 259–260. www.nature .com/nature/journal/v472/n7343/full/472259b.html (accessed 6 June 2016).
Pfund C, House SC, Asquith P, Fleming MF, Buhr KA, Burnham EL, Eichenberger Gilmore JM, Huskins WC, McGee R, Schurr K, et al. (2014). Training mentors of clinical and translational research scholars: a randomized controlled trial. Acad Med 89, 774–782.
Pfund C, House S, Spencer K, Asquith P, Carney P, Masters KS, McGee R, Shanedling J, Vecchiarelli S, Fleming M (2013). A research mentor train-ing curriculum for clinical and translational research. Clin Transl Sci 6, 26–33.
Pfund C, Spencer KC, Asquith P, House SC, Miller S, Sorkness CA (2015). Building national capacity for research mentor training: an evi-dence-based approach to training the trainers. CBE Life Sci Educ 14, ar24. Sauermann H, Roach M (2012). Science PhD career preferences: levels,
changes, and advisor encouragement. PLoS One 7, e36307.
Schillebeeckx M, Maricque B, Lewis C (2013). The missing piece to changing the university culture. Nat Biotechnol 31, 938–941.
Tabachnick B, Fidell L (2007). Logistic Regression, Boston: Pearson. Tabak LA, Collins FS (2011). Weaving a richer tapestry in biomedical science.
Science 333, 940–941.
University of Denver (n.d.). University of Denver Student Life Career Services Work Values. www.du.edu/career/media/documents/pdfs/workvalues.pdf (accessed 18 April 2016).
University of Wisconsin–Madison Institute for Clinical and Translational Re-search (n.d.). ReRe-search Mentoring: Cultivating Effective Relationships. https://mentoringresources.ictr.wisc.edu (accessed 8 January 2016). Valantine HA, Collins FS (2015). National Institutes of Health addresses the
science of diversity. Proc Natl Acad Sci USA 112, 12240–12242. Williams SN, Thakore BK, McGee R (2016). Coaching to augment mentoring