Insight into adsorption mechanism of lead(II) from aqueous solution
by chitosan loaded MnO
2
nanoparticles
Van-Phuc Dinh
a,*, Ngoc-Chung Le
b, L. Anh Tuyen
c,e, N. Quang Hung
d,
Van-Dong Nguyen
e, Ngoc-Tuan Nguyen
faDong Nai University, 04 Le Quy Don Street, Tan Hiep Ward, Bien Hoa city, Dong Nai province, Viet Nam bDalat University, 01 Phu Dong Thien Vuong Street, Dalat city, Lam Dong province, Viet Nam
cCenter for Nuclear Techniques, Vietnam Atomic Energy Institute, Hochiminh city, Viet Nam
dInstitute of Fundamental and Applied Sciences, Duy Tan University, 03 Quang Trung, Danang city, Viet Nam eVNUHCM-University of Science, 227 Nguyen Van Cu Street, District 5, Hochiminh city, Viet Nam
fNuclear Research Institute, 01 Nguyen Tu Luc, Dalat city, Lam Dong, Viet Nam
h i g h l i g h t s
MnO2nanoparticles are loaded onto the surface of Chitosan in order to enhance its adsorption capacity.
The removal of lead (II) from the aqueous solution using MnO2/CS is found to be better than the use of other materials.
The Positron Lifetime Spectroscopy is used for thefirst time to investigate the“ions-holes”mechanism.
a r t i c l e i n f o
Article history:
Available online 28 December 2017
Keywords:
Chitosan loaded MnO2(MnO2/CS) Lead(II)
Adsorbed mechanisms Positron lifetime spectroscopy
a b s t r a c t
Manganese dioxide nanoparticles are loaded onto the surface of chitosan (CS) in order to enhance their adsorption properties. Various theoretical models and spectroscopic analytical methods are used to investigate the equilibrium isotherm, kinetics, and mechanisms of the removal of lead(II) from the aqueous solution. The kinetic studies based on a pseudo-second-order model show that the uptake of lead(II) occurs via three stages depending on the reaction time. The experimental data arefitted using four nonlinear isotherm models, namely the Langmuir, Freundlich, Temkin, and Dubinin-Radushkevich models. The results obtained within the Langmuir model gave the highest R2, the smallest root-mean-squared error (RMSE), and the best nonlinear chi-square test (c2) values, indicating that this model is the most appropriate approach for describing the adsorption of lead(II) onto the MnO2/CS nanomaterials. It is also found that the maximum monolayer adsorption capacity is 126.1 mg/g, which is higher than most of the values obtained from other materials. In addition, the results of the heat of the sorption process and the mean free energy calculated from the Fourier transform infrared spectroscopy (FTIR) suggested that the adsorption indeed follows a physical process. By using the Positron Lifetime Spec-troscopy, which is used for thefirst time to investigate the“ions-holes”mechanism of the removal of lead(II) by CS loaded MnO2nanoparticles, we found that the“ions-holes”mechanism in fact occurs at the micropores of MnO2crystals in the MnO2/CS nanomaterials. This result is significant as it will be a reference for the use of the spectroscopic analytical methods for investigating the adsorption mechanism.
©2017 Elsevier B.V. All rights reserved.
1. Introduction
Used batteries, lead smelting, tetraethyl lead manufacturing,
mining, plating, ammunition, and ceramic glass industries have been considered as the main anthropogenic sources, which release lead into natural water. According to the Environmental Quality Act, the limit of lead in water should be less than 0.1 mg/L. The presence of excess amounts of lead in fresh water may cause the health risks and the increase of the diseases, such as anemia, *Corresponding author.
E-mail address:[email protected](V.-P. Dinh).
Contents lists available atScienceDirect
Materials Chemistry and Physics
j o u rn a l h o m e p a g e : w w w . e l s e v i e r . c o m / l o ca t e / m a t c h e m p h y s
encephalopathy, and hepatitis. Therefore, many physicochemical treatments have been carried out in order to remove lead(II) from the aqueous solutions, such as adsorption, ion-exchange, mem-brane technology, etc. [1,2].
The use of chitosan (CS), a biosorbent, to remove the Pb2þions from the aqueous solution has been widely studied because of its good biocompatibility, biodegradability, as well as multiple func-tional groups [3e5]. However, its potential application is still restricted due to its poor mechanical properties, thermal stability, and small surface area [6e8]. In order to improve the mechanical properties as well as to enhance the adsorption capacity of heavy metals, the structural modification of CS has been applied to generate the new composite materials including clay beads [9], epichlorohydrin [10], montmorillonite [11,12], graphene oxide [13], polymerizing methacrylic nanoparticle [14], sand [15], and cellu-lose [16]. In addition, the combination between the MnO2
nano-particles and CS to form a composite of MnO2/CS has been recently
studied based on the fact that MnO2has a variety of structures and
excellent chemical characteristics to be a sorbent for heavy metals such as copper, lead, etc. [17e19]. This new adsorbent has even more advantageous properties than CS, including high surface area, high adsorption properties, and easy-to-use.
Previously, we have investigated the adsorption of Zinc using MnO2/CS as a new adsorbent [20]. However, the mechanism of
removing the metal ions using this MnO2/CS material has not been
discussed yet in Ref. [20], especially the“ions-holes"mechanism, which can be studied by using the positron lifetime spectroscopy. The latter is known as a unique method for investigating the porous material structure at the nanoscale (from angstrom to several tens nm).
The goal of the present work is to study the uptake of lead(II) on MnO2/CS under the optimized batch conditions such as pH, contact
time, and initial concentration of sorbate. Moreover, the nonlinear adsorption isotherm modeling, kinetics, and thermodynamics of the adsorption process will be also investigated in the present work. In particular, the spectroscopic analytical method within the positron lifetime spectroscopy in combination with the theoretical model calculations will be also applied in order to discuss the mechanism of the uptake of lead(II) on this MnO2/CS
nanomaterials.
2. Materials and methods
2.1. Chemicals
All the chemicals used are of analytical grade and without further purification. Potassium permanganate (KMnO4) was
pur-chased from Sigma Aldrich, whereas ethyl alcohol (C2H5OH 98%),
lead nitrate (Pb(NO3)21000 mg/L), nitric acid (HNO363%), and
so-dium hydroxide (NaOH 98%) were obtained from Merck. Chitosan (yellow color) was produced from the shrimp shells at Nuclear Research Institute, Dalat, Lam Dong, Vietnam. It has 91.7 kDa of molecular weight and contains approximately 90% of deacetyl with 12.5% of moisture.
2.2. Characterization
In order to determine the phase of the crystalline structure, we have used the X-ray diffractometer (XRD) D5000 (made by Siemens, Germany) with the X-ray radiation of CuKaand wave-length of 1.5406 Å. For examining the morphology of the materials, the scanning electron microscopy (SEM) S-4800 (made by Hitachi, Japan) is used. Two theoretical models, Brunauer-Emmett-Teller (BET) [21] and Barrett-Joyner-Halenda (BJH) [22], are used to calculate the surface area and pore size of the materials. In addition,
the material bonding before and after the adsorption is determined within the Fourier transform infrared spectroscopy (FTIR) using Tensor 27 (made by Bruker, Germany). In particular, the “ ions-holes” mechanism mentioned in the Introduction is studied by using the positron lifetime spectroscopy (fast coincidence system made by Ortec), which consists of two plastic detectors with the time resolution of 200 ps. Finally, the concentration of lead(II) in the samples before and after the adsorption is determined by using the atomic absorption spectrophotometer (AAS-7000 made by Shimadzu, Japan), whereas the equilibrium states are measured using a temperature-controlled shaker (Model IKA R5).
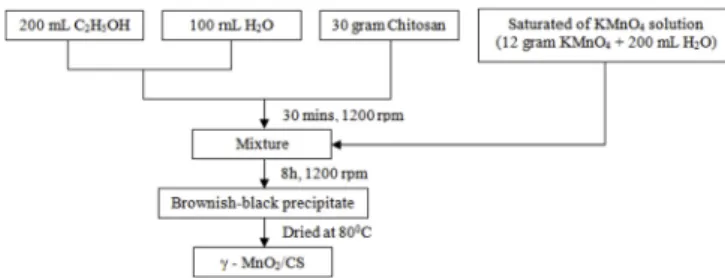
2.3. Synthesis of CS loaded MnO2
In the present work, the MnO2/CS material is synthesized
directly from KMnO4and C2H5OH at the room temperature at the
Department of Natural Science, Dong Nai University, Vietnam. Detail of the synthesis process of MnO2/CS is shown inFig. 1[6,20]. 200 mL
of saturated KMnO4solution (12 g KMnO4in 200 mL H2O) is
grad-ually added into a mixture of 30 g of CS with 300 mL of 200 mL C2H5OH plus 100 mL H2O. The mixture is then strongly
agitated for 8h at room temperature to obtain
g-MnO
2[17]. Finally,the obtained precipitate isfiltered and washed several times using bi-distilled water and dried at 60C in 12h after that. It is worth mentioning here that the present synthesis process is quite different from that performed in Ref. [21]. In the latter,
a-MnO
2modified byg-aminopropyltriethoxysilane (APTS) has been used to be indirectly
loaded on CS using glutaraldehyde (GA) as the CS stabilizer, whereasg-MnO
2has been used within the present study as shown inFig. 1.2.4. Batch adsorption experiments
The batch technique is used to study the adsorption of Pb2þon MnO2/CS. Firstly, 0.1 g MnO2/CS is placed into a 100 mL conicalflask
containing 50 mL solution of Pb2þions. The adsorption optimiza-tion is carried out by varying pH of the soluoptimiza-tion (within a range of 2e5), adsorption time (between 20 and 240 min), and initial con-centration of Pb2þions (between 100 and 400 mg/L). The concen-trations of Pb2þions in thefiltrate before and after the uptake are determined by using the atomic absorption spectrophotometer (AAS), in which the calibration, verification, and standardization are applied continuously for every 10 samples.
The percentage of removal and the adsorption capacity (qe) are
calculated using the mass balance equations as
%Removal ¼ ðCoCCeÞ:100%
o ; (1)
qe¼ðCoCeÞ:V
m ; (2)
where Coand Ceare the initial and equilibrium concentrations (mg/
L), respectively.
3. Results and discussion
3.1. Characterization of the MnO2/CS
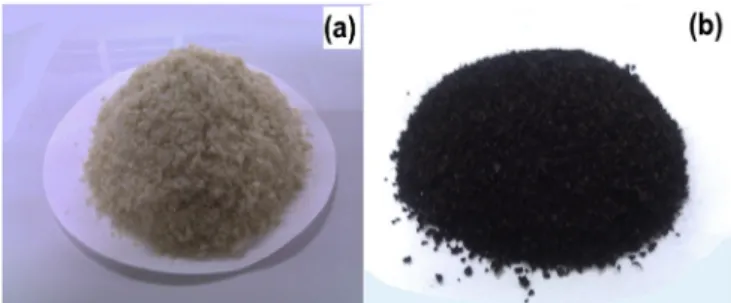
Fig. 2shows the images of CS before and after loading MnO2. As
can be seen from thisFig. 2that before the loading [Fig. 2(a)], CS is yellow, soft, and swollen in water, whereas after the loading, the composite (MnO2/CS) is black and hard [Fig. 2(b)]. In order to study
the properties of these two materials (CS and MnO2/CS), three
spectroscopic methods have been applied within the present work, namely the X-ray Diffractometer (XRD), Scanning Electron Micro-scopy (SEM) and Fourier transform infrared spectroMicro-scopy (FTIR).
The XRD patterns of the
g-MnO
2, CS, and MnO2/CS are presentedrespectively by the curves (a), (b), and (c) inFig. 3. It is clear to see from thisFig. 3that there appears a characteristic peak of CS at 2
q
equal to 20.010in the spectrum of MnO2/CS but its peak area andhigh are significantly reduced. The reason is that while CS [curve (b)] has a concrete crystalline structure, the crystalline structure of MnO2[curve (a)] is rather low, leading to the significant reduction
of the XRD peaks in MnO2/CS [curve (c)]. The peak seen at
2
q
¼22.20 in the MnO2/CS spectrum is certainly caused by thediffraction overlap of the observed peaks for both CS and MnO2at
the same diffraction angle. Moreover, the peak located at 2
q
¼37.80 in the MnO2/CS spectrum should come mainly from thecontribu-tion of MnO2as there is no peak in the CS spectrum at the same
value of 2
q
. A similar XRD analysis but for CS loaded onto Fe3O4instead of MnO2 has been reported in Ref. [7]. From the above
observation, one is able to conclude that the MnO2nanoparticles
have been successfully loaded onto CS. It is also worthwhile noting that the observation of the MnO2and CS peaks shown inFig. 3
agrees well with the recent XRD investigation in Ref. [22], which reveals the appearance of the characteristic peaks at 2
q
equal to 22.20, 37.80, and 43.00forg-MnO
2and 20.010, 26.640, and 40.50forCS.
The morphology and structure of CS and MnO2/CS are examined
by using the SEM, EDX, and FTIR analyses as depicted inFigs. 4e6. Fig. 4(a) shows that CS has a smooth surface, whereas the surface of MnO2/CS seen inFig. 4(b) has a porous structure. This observation
indicates that the loading of MnO2onto CS has made the changes in
the morphology and structure of the initial materials in order to form a new composition of MnO2/CS with higher surface area and
porous structure. Meanwhile, the FTIR spectrum of CS (curve (a) in Fig. 6) contains some specific peaks for the amide groups (1656 cm1 and 1598 cm1), alcoholic groups (1423 cm1 and 1382 cm1), and CO stretching vibration in C-OH (1084 cm1) [7,23,24]. Similarly, a specific peak for the Mn-O banding at 525 cm1is seen in the spectrum of MnO2[curve (b)] in the same figure [25,26]. After the loading of MnO2onto CS, the aboved
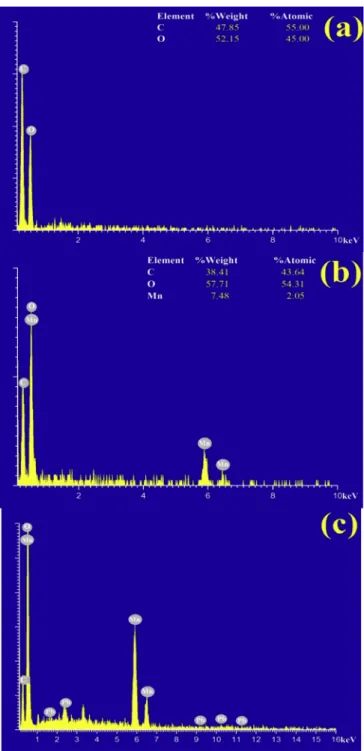
spe-cific peaks are shifted to the lower values of wavenumber, namely at 1633, 1554, 1411, 1080 and 518 cm1, as shown in the curve (c) of Fig. 6. In addition, the EDX spectra depicted inFig. 5(a) and (b) show
a main characteristic peak of Mn at 5.899 keV, and thereby con-firming the loading of MnO2onto the surface of CS. These results
indicate that CS has been chemically modified and may conse-quently provide more adsorption sites for the adsorbate.
The surface area and pore size of CS, MnO2and MnO2/CS are
investigated by using the BET and BJH methods and the results are shown inTable 1. The results obtained within the BET calculation show that before the loading of MnO2, the surface area of CS is very
low (0.23 m2/g) because CS employed in the present study hasflake shape with large particle size and smooth surface. Its surface area increases significantly to 15.75 m2/g after loading about 28% of MnO2nanoparticles. This increase in the surface area of MnO2/CS
leads certainly to the increase of its adsorption ability [27e29]. As for the pore size, the average pore widths of MnO2/CS obtained
within the BJH adsorption and desorption analyses are smaller than those of CS. These results indicate once again that the MnO2
nanoparticles have been successfully loaded onto the CS surface.
3.2. Factors affecting the adsorption of Pb2þ
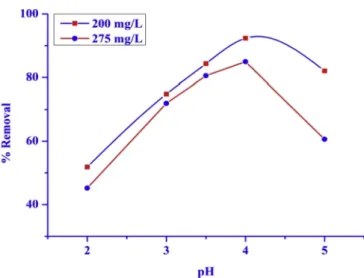
3.2.1. pH
As an impotant factor, pH directly affects the formation of different types of lead in the solution and the durability of the material. At pH<2.0, a small mass of MnO2/CS is dissolved due to
the presence of the amine and carboxylic groups on CS that strongly interact with proton. This leads to the decrease of the adsorption sites on the material surface. In addition, a decrease in pH also changes the charge of MnO2surface from neutral to positive values,
leading to the decrease of the adsorption of cations as presented in Eq.(3)[30]. As a result, the adsorption of lead(II) on MnO2/CS is also
decreased.
≡MnOHþHþ⇔MnOH2þ (3)
Fig. 2.Images of CS before (a) and after loading MnO2(b).
Fig. 3.XRD spectra of MnO2(a), CS (b) and MnO2/CS (c).
When pH increases from 2.0 to 4.0, the adsorption of Pb2þions increases and reaches its maximum at a pH value of approximately 4.0. At pH>4.0, the hydroxo ion PbOHþand/or insoluble hydroxide Pb(OH)2are formed so that the adsorption of lead(II) is inhibited,
leading to the decrease of adsorption capability. (seeFig. 7)
3.2.2. Adsorption time
The relationship between the adsorption time and the adsorp-tion efficiency of Pb2þions from the aqueous solution onto the MnO2/CS material studied at the room temperature of 24C within
an interval of 240 min is shown inFig. 8. It is evident from thisFig. 8 that the adsorption of Pb2þ ions increases with increasing the contact time. Moreover, the adsorption percentage of Pb2þ ions
reaches equilibrium within 120 min with about 92.35% of Pb2þions being adsorbed.
3.3. Isotherm studies
Four non-linear models, including the Langmuir, Freundlich, Temkin, and Dubinin-Raduskevich models, are chosen to fit the experimental data in order to predict the adsorption mechanism and to assess the adsorption capacity of MnO2/CS. The results
ob-tained within these models are plotted inFigs. 9 and 10.
The Langmuir model assumes that the adsorption of lead ions occurs via a monolayer adsorption on a homogenous surface without any interaction between the adsorbed ions [31]. Two key parameters, qm and KL, which correspond respectively to the
monolayer adsorption capacity and Langmuir constant, are deter-mined based on a nonlinear form of Langmuir isotherm equation as [32].
qe¼ qm:KL:Ce
1þKL:Ce; (4)
where qeis the amount (mg) of adsorbed metal per unit of mass of
the sorbent (g), whereas Ceis the concentration of metal remained
in the solution (mg/L) at the equilibrium. It is seen inFig. 9(a) that the value of the correlation coefficient (R2) is found to be rather high (about 0.9795), which clearly indicates that there is a good agreement between the model parameters and the monolayer adsorption data of Pb2þions on the MnO2/CS material surface. The
maximum value of qm calculated within this model is about
126.1 mg/g, which is higher than most of the values obtained from CS and some other materials, except the case of Chitosan/GO-SH, whose adsorption capacity reported in Ref. [13] is rather high (about 447.0 mg/g) (see e.g., Table 2). The reason of the high adsorption capacity of Chitosan/GO-SH found in Ref. [13] is that this material was synthesized from the sulfydryl functionalized gra-phene oxide (GO-SH) self-assembled with CS using the electrostatic interaction. It is well-known that Graphene is a material consisting of an allotrope of tightly packed carbons at an atomic scale.
Fig. 5.EDX spectra of CS (a), MnO2/CS (b) and MnO2/CS/Pb (c).
Fig. 6.FT-IR spectra of CS (a), MnO2(b), MnO2/CS (c), Pb/MnO2/CS (d).
Table 1
BET and BJH analysis results.
CS MnO2 MnO2/CS
Therefore, the assemble of this material with CS will certainly lead to a significant increase of the adsorption surface area and the adsorption capacity as well. However, the synthetic procedure of this material is quite complex in comparison with the MnO2/CS
employed in the present study. Moreover, since the cost of gra-phene oxide is much higher than that of MnO2, the use of MnO2
loading onto CS as in the present study has potential applications in the removal of Pb(II) from aqueous solution.
The Freundlich model bases on the assumption that the adsorption of lead(II) ions happens on the multilayers and there is an interaction between the adsorbate and absorbent [31]. Two key parameters of this model, KFand n, are determined based on a
nonlinear form of Freundlich isotherm equation as [33].
qe¼ KF:Ce1=n ; (5)
where KF(L.g1) is the Freundlich constant, which corresponds to
the relative adsorption capacity of the adsorbent, and n is the Freundlich equation exponent, which represents the parameter characterizing the Gaussian energetic heterogeneity of the adsorption surface.Fig. 9(b) shows that the value of n obtained within the present work is about 6.35, which is equivalent to a rather low value of 1/n (0.1575). This low value of 1/n indicates that lead(II) can be easily adsorbed by the MnO2/CS nanomaterials [34].
The Temkin model proposes that the heat of adsorption of all molecules in the layers decreases linearly with the coverage because of the adsorbent-adsorbate interactions. The adsorption is then characterized by a uniform distribution of the bonding en-ergies up to some maximum binding energy [31]. The nonlinear form of Temkin isotherm equation is given as [35].
qe¼RTb T
lnðKTCeÞ; (6)
where KT is the equilibrium binding constant (L.mol1)
corre-sponding to the maximum binding energy, bT is related to the
adsorption heat, R is the universal gas constant (8.314.103kJ. K1.mol1), and T is the temperature (K). The Temkin constant, bT,
which is related to the heat of sorption of Pb2þions, is found to be 0.59 kJ/mol as shown inFig. 10(a). This low value of bTis an
indi-cation of the weak interaction between the sorbate and the sorbent, which supports for the assumption of a physical adsorption process obtained within the present study [36].
In order to determine the type of sorption (physical or chemi-cal), the Dubinin-Raduskevich model is used, whose isotherm equation is expressed by Ref. [31].
qe¼qm:eðb:ε2Þ ; (7)
where the
b
(mol2.J2) is the Dubinin-Radushkevich isotherm constant andε¼RTln(1þ1/Ce) is the Polanyi potential (J.mol1)with T and R being the solution temperature (K) and gas constant, respectively. From Eq. (7), one can calculate the value of mean sorption energy, E (kJ/mol), as follows
E¼ ffiffiffiffiffiffiffiffiffiffi1
2
b
p : (8)
The value of mean sorption energy E gives useful information on the chemical and physical sorptions. For example, the E value
Fig. 7.Effects of pH on the removal of lead(II) from aqueous solution by MnO2/CS. (C0¼200 mg/L and 275 mg/L; time¼120 mins; pH¼2e5; shaking speed¼240 rpm)
Fig. 8.Effects of adsorption time on the removal of lead(II) from aqueous solution by MnO2/CS.
(C0¼200 mg/L; time¼10e240 min; pH¼4.0; shaking speed¼240 rpm)
Fig. 9.Plots of nonlinear models: Langmuir (a) and Freundlich (b). (C0¼100e400 mg/L; time¼120mins; pH¼4.0; shaking speed¼240 rpm)
Fig. 10.Plots obtained within the Temkin (a) and Dubinin-Radushkeich (b) isotherm models.
between 1 and 8 kJ/mol indicates the physical sorption; between 8 and 16 kJ/mol is associated with the ion-exchange; and more than 16 kJ/mol should stand for the chemical sorption [37]. Within the present study, the E value is found equal to 0.41 kJ/mol, which is less than 8 kJ/mol. This result indicates that the type of sorption of Pb2þions on the MnO2/CS material is essentially physical.
3.4. Kinetic studies
The uptake rate of Pb2þ ions on the MnO2/CS surface is
described by three kinetic models, namely the pseudo-first-order, pseudo-second-order, and intra-particle diffusion models.
The pseudo-first-order equation was given by Lagergren in 1898, whose equation reads [44].
dq
dt¼k1ðqeqÞ ; (9)
where qe is the amount of solute adsorbed per unit weight of adsorbent (mg/g) at the equilibrium, q is the amount of solute adsorbed at any time (mg/g), andk1is the adsorption constant. Integrating Eq. (9) with respect to the adsorption time t and applying the integration conditions q¼0 at t¼0 and q¼qtat t>0,
the kinetic rate expression becomes [44].
logðqeqtÞ ¼ logqe k1:t
2;303 : (10)
The pseudo-second-order equation proposed by Ho and McKay has the form as [45].
dq
dt¼k2ðqeqÞ
2 : (11)
Integrating Eq.(11)and applying the same boundary conditions as for the pseudo-first-order equation, one obtains [45].
t q ¼
1
k2q2e þ
1
qe
:t : (12)
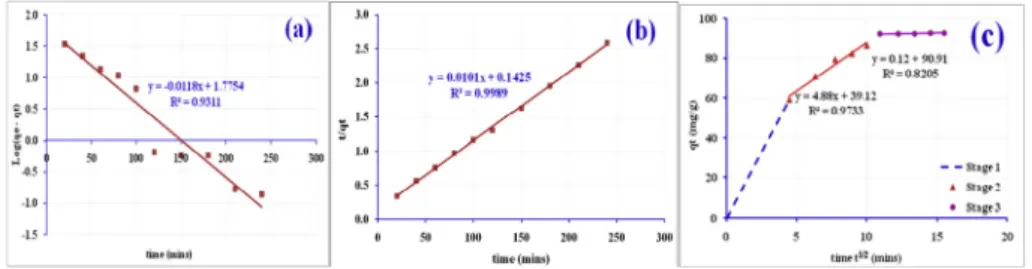
Results obtained within the two models are plotted inFig. 11(a) and (b) with the kinetic parameters being listed inTable 3. It is found from this Fig. 11 that although the adsorption process partially follows both the pseudo-first-order and
pseudo-second-order equations at different times, the best agreement is seen be-tween the experimental data and those obtained within the pseudo-second-order rate equation. This agreement can be easily understood as the results listed inTable 3show that the R2value (0.9989) obtained within this model is almost close to 1 and the calculated qe(cal) value is also close to the corresponding
experi-mental data (qe(exp)) of the equilibrium sorption.
It is known that the pseudo-first-order and pseudo-second-order models are not able to identify the diffusion mechanisms. Therefore, the intra-particle diffusion model developed by Weber and Morris [46] is applied within the present work in order to identify the diffusion mechanism involved in the adsorption pro-cess. This model bases on the following equation [46].
qt¼kdt1/2þC, (13)
where C characterizes for the effects caused by the boundary layer. The results obtained within this model are shown in Fig. 11(c). These results clearly indicate that the uptake of Pb2þions on the MnO2/CS surface is likely to occur throughout three stages. In the first stage (dashed lines), Pb2þions are quickly transferred from the solution to the boundary film of the particles (bulk diffusion) within about 20 min. In the second stage (triangles), a gradual adsorption is occurred in the time interval from 20 to 120 min. This is the sole rate-determining step. However, it is seen that the plot of qt versus t1/2 obtained within this second stage does not pass
through the origin and the presence of the boundary layer effect is characterized by the nonzero value of C. These results indicate that the sorption follows not only the intraparticle diffusion but also two or more different diffusion mechanisms [47]. In the last stage (cir-cles), the equilibrium is achieved due to the two reasons. Thefirst reason is that the concentration of Pb2þ ions in the solution is extremely low. The second reason is due to the fact that the adsorbent equilibrium is often reached when the number of adsorption sites decreases [48]. The values of the diffusion con-stants (kd1,kd2,kd3) obtained within all three stages are listed in
Table 3.
3.5. Thermodynamic studies
The thermodynamic parameters, including Gibbs free energy (DG), enthalpy change (DH), and entropy change (DS), are
Table 2
Comparison of sorption capacity of Pb2þion by some composite materials.
Materials pH qm(mg/g) Ref.
Chitosan 6.0 58.71 [3]
Chitosan 6.0 47.39 [4]
Chitosan 4.5 115.50 [5]
Crosslinked chitosan-clay beads 4.5 7.93 [9]
Crosslinked chitosan with epichlorohydrin 6.0 34.13 [10]
Chitosan-coated montmorillonite 4.0 29.85 [11]
Chitosan beads 5.0 76.80 [13]
Chitosan/GO(Chitosan/graphene oxide composite) 100.00 [13]
Magnetic Chitosan/GO (Magnetic Chitosan/graphene oxide composite) 5.0 76.94 [13] Chitosan/GO-SH (Chitosan/Sulfydryl-functionalized graphene oxide composite) 5.0 447.00 [13] Chitosan - polymerizing methacrylic nanoparticle (CSeMAA) 5.0 11.30 [14]
Magnetic chitosan microparticles 5.0 69.83 [38]
Modified Chitosan - Montmorillonite Nanocomposite 6.0 92.00 [12]
Chitosan/cottonfibers (via Schiff base bond) 6.5 101.53 [39]
Chitosan-coated sand e 12.32 [15]
Chitosan(Chitin)/Cellulose Composite 5.3 27.31 [16]
MWCNT/SiO2(carbon nanotubes/silica) nanocomposite 6.0 13.23 [40]
CDAP (Crosslinked dianionic polyelectrolyte) 6.0 64.5 [41]
ZnO/talc nanocomposite. 4.0 48.3 [42]
ZnO/MMT (minerals montmorillonite) nanocomposites 4.0 88.50 [43]
computed by using the lead(II) adsorption data at temperatures of 30, 40, and 50C. These parameters are related to each other using the Gibbs isotherm [49].
DG
¼DH
TDS, (14)Values of
DG as a function of temperature can be determined
using the following Van't Hoff equation [50].DG
¼ RTlnKC, (15)where T(K) is the absolute temperature and KC (L/mol) is the
equilibrium constant, whose values be evaluated using the following relationship [30].
KC¼ CeðadsÞ
CeðaqÞ : (16)
In Eq.(16), Ce(ads)is the equilibrium concentration of lead(II) on
the adsorbent (mg/g), whereas Ce(aq)is the equilibrium
concen-tration of lead(II) in the aqueous solution (mg/L). The values of
DH
andDS, which can be respectively determined from the intercept
and slope of the plot ofDG versus T, are listed in
Table 4together with theDG values. Here, the negative values of
DG are indicative
for a spontaneous process taking place between lead(II) and MnO2/CS, namely the increase of the negative Gibbs free energy with increasing temperature indicates a much more stable and ener-getically favorable adsorption of lead(II) at high temperatures. One can also see fromTable 4that
DH has a positive value, indicating the
endothermic nature of adsorption. In addition, since the values ofboth the adsorption heat and Gibbs free energy are less than 8 kJ/ mol, it can be concluded that the adsoption of lead(II) onto MnO2/
CS is essentially a physical adsorption process.
3.6. Removal mechanism
3.6.1. Physical adsorption mechanism
MnO2/CS is a porous material that has many adsorption sites,
including -NH2and -OH groups and MnO2nanoparticles loaded on
the CS surface. Hence, the uptake of lead onto this material can be occurred via the following mechanisms (Fig. 12)
Material-NH2 þ Hþ / Material-NH3þ þ !
Pb2þ
Material-NH2PbþþHþ,
Material-OH þ Hþ / Material-H2OþþPb! 2þ
Material-OHPbþþHþ,
Material-MnO2 þ Hþ / Material-MnO2HþþPb! 2þ
Material-MnO2PbþþHþ.
Futhermore, as presented in Sec.3.1, the FTIR spectra and EDX analysis have been used to investigate the bonding between the Pb2þions and the adsorption sites before and after the adsorption, whose results are plotted by the curve (d) ofFig. 6. In thisFig. 6, in comparison with the results obtained for MnO2/CS [curve (c)], that
is without Pb2þions, all the specific peaks in the curve (d) char-acterizing for the amide groups, alcoholic groups, -C-OH, and MneO bonds are newly developed and located at other wave-lengths (1618, 1383, 1070, and 522 cm1). These results indicate that the adsorption of Pb2þonto MnO2/CS is occured via the above
functional groups of CS and MnO2. In addition, the appearance of
the main characteristic peaks of Pb at 10.55 keV and 2.34 keV in the EDX spectra of MnO2/CS after the adsorption of lead(II) [Fig. 5(c)]
reveals that Pb2þions have been successfully absorbed by MnO2/CS.
This result is similar to that obtained within the study of the adsorption of antimony(III) from the aqueous solutions using the polyamide-graphene composite [34] as well as the study of the uptake of mercury using the polyethylenimine modified-activated carbon [51].
Fig. 11.Plots obtained within the pseudo-first-order kinetic (a), pseudo-second-order kinetic (b) and intra-particle diffusion (c) models for the removal of Pb2þions. (C0¼200 mg/L; time¼5e240 min; pH¼4.0; shaking speed¼240 rpm)
Table 3
Kinetic parameters.
Kinetics models Parameters
Pseudo-first-order kinetic qe (exp) 93.00 k1(min1) 0.0272
R2 0.9311
qe (cal) 59.62
Pseudo-second-order kinetic k2(g.mg1.min1) 0.7.103
R2 0.9989
qe (cal) 99.01
Intra-particle diffusion kd1 13.26
kd2 4.88
kd3 0.12
Table 4
Thermodynamic parameters.
Adsorbent DG0(kJ/mol) DH0(kJ/mol) DS0(J/mol) R2
303K 313K 323K
MnO2/CS 1.95 2.14 2.60 7.86 32.24 0.9463
Material
Pb
2+NH3
+NH
2Pb
+OH
2+PbHO
Pb
2+Pb
2+MnO
2H
+MnO
2Pb
+3.6.2. “Ions-holes”mechanism
In addition to the physical adsorption mechanism described in Sec.3.6.1, an interesting mechanism, called the“ions-holes”, is also studied within the present work. As can be seen in the SEM images of MnO2/CS [Fig. 4(b)], surface of this material is heterogeneous and
therefore there are a lot of porous holes on its surface. According to the BJH adsorption and desorption analyses, the average pore width of the holes in MnO2/CS is about 24000 p.m., whereas the average
radius of Pb2þions is much smaller, namely about 150 p.m. As a result, the Pb2þions will be fallen into the holes in the MnO2/CS
material as depicted inFig. 13(a), leading obviously to the increase of the adsorption capacity.
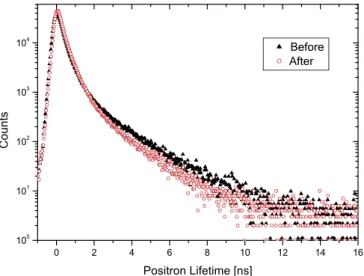
In order to investigate the“ions-holes”mechanism occurred at the micro-pores of MnO2crystal structure in the MnO2/CS material,
we have carried out the positron lifetime measurements in the vacuum condition. Through the analysis of the positron lifetime spectra (Fig. 14), three positron annihilation states (see Table 5) have been detected in the material. Thefirst lifetime component (t1), the shortest one, is known to come from the complex
anni-hilation of para-positronium (p-Ps) and free positrons, whereas the second one (t2) should be from the positron annihilation in the
molecular complexes of material. The last lifetime component (t3),
the longest one, characterizes for the ortho-positronium (o-Ps) formation and annihilation in the characteristic micropores of the crystal structure [52,53]. These results indicate that the adsorption
mechanism has certainly occurred as follows. According to the tunnel structure,
g-MnO
2includes many tunnels, whose averagesize is about 10.58 Å [54]. Thus, the Pb2þions, whose size is much smaller than that of the tunnels, will enter into these tunnels before being adsorbed in the micro-pores as shown in Fig. 13(b). This mechanism is demonstrated by a decrease of
t
3from 1.79 ns beforethe adsorption to 1.54 ns after the adsorption (Table 5). This decrease of
t
3is due to the fact that the high electron density of thePb2þ ions is the origin of making the o-Ps lifetime shorter, ac-cording to the pick-off annihilation. Moreover, the o-Ps annihilation intensity in the micro-pores (I3) also decreases from 10.2% to 8.1%
after the adsorption process due to the decrease of the o-Ps for-mation and trap rate. As the result, one can conclude that the“ ions-holes”mechanism has occurred at the micro-pores of MnO2crystal
structure in the MnO2/CS material.
4. Conclusion
In the present study, the MnO2/CS material has been
success-fully used as the adsorbent to remove the Pb2þ ions from the aqueous solution. The maximum monolayer adsorption capacity calculated from the Langmuir model is found to be 126.1 mg/g, which is higher than most of the values obtained using some other materials including those produced from either chitosan or other composites. Using different theoretical models together with several spectroscopic analysis methods, we have found that the uptake of lead(II) can occur via more than one mechanisms, namely the physical adsorption and“ions-holes”mechanisms. Especially, the Positron Lifetime Spectroscopy has been used for thefirst time within the present work in order to investigate the “ions-holes” mechanism of the removal of lead(II) by chitosan loaded MnO2
nanoparticles.
References
[1] Q. Peng, J. Guo, Q. Zhang, J. Xiang, B. Liu, A. Zhou, R. Liu, Y. Tian, Unique lead adsorption behavior of activated hydroxyl group in two-dimensional titanium carbide, J. Am. Chem. Soc. 136 (2014) 4.
[2] Q. Zhang, Q. Du, M. Hua, T. Jiao, F. Gao, B. Pan, Sorption enhancement of lead ions from water by surface charged polystyrene-supported nano-zirconium oxide composites, Environ. Sci. Technol. 47 (2013) 9.
[3] M. Benavente, L. Moreno, J. Martinez, Sorption of heavy metals from gold mining wastewater using chitosan, J. Taiwan Inst. Chem. E. 42 (2011) 976e988.
[4] A. Doina, B. Laura, B. Elena, Lead (II) removal from aqueous solutions by adsorption onto Chitosan Cellul, Chem. Technol. 43 (2009) 211e216. [5] J.C.Y. Ng, W.H. Cheung, G. McKay, Equilibrium studies for the sorption of lead
from effluents using chitosan, Chemosphere 52 (2003) 1021e1030. [6] L. Ngoc-Chung, D. Van-Phuc, N. Ngoc-Tuan, Synthesis and characterization of
MnO2 nanoparticles loaded onto Chitosan and its application in Pb2þ adsorption, in: Proceedings of the Third Intl.Conf. On Advances in Applied Science and Environmental Engineering, ASEE, Malaysia, 2015, pp. 27e31. [7] M. Yadav, K.Y. Rhee, S.J. Park, D. Hui, Mechanical properties of Fe3O4/GO/
chitosan composites, Compos. B Eng. 66 (2014) 89e96.
[8] K. Azlan, W.N. Wan Saime, L. Lai Ken, Chitosan and chemically modified chi-tosan beads for acid dyes sorption, J. Environ. Sci. 21 (2009) 296e302. [9] V.N. Tirtom, A. Dinçer, S. Becerik, T. Aydemir, A. Çelik, Removal of lead (II) ions
from aqueous solution by using crosslinked chitosan-clay beads, Desalin. Water Treat. 39 (2012) 76e82.
[10] A.-H. Chen, S.-C. Liu, C.-Y. Chen, C.-Y. Chen, Comparative adsorption of Cu(II), Zn(II), and Pb(II) ions in aqueous solution on the crosslinked chitosan with epichlorohydrin, J. Hazard Mater. 154 (2008) 184e191.
[11] W.-C. Tsai, S. Ibarra-Buscano, C.-C. Kan, C.M. Futalan, M.L.P. Dalida, M.-W. Wan, Removal of copper, nickel, lead, and zinc using chitosan-coated montmorillonite beads in single- and multi-metal system, Desalin. Water Treat. 57 (2016) 1e14.
[12] M.A. Khedr, A.I. Waly, A.I. Hafez, H. Ali, Synthesis of modified chitosan -montmorillonite nanocomposite, Aust. J. Basic Appl. Sci. 6 (2012) 216e226. [13] X. Li, H. Zhou, W. Wu, S. Wei, Y. Xu, Y. Kuang, Studies of heavy metal ion
adsorption on Chitosan/Sulfydryl-functionalized graphene oxide composites, J. Colloid Interface Sci. 448 (2015) 389e397.
[14] A. Heidari, H. Younesi, Z. Mehraban, H. Heikkinen, Selective adsorption of Pb(II), Cd(II), and Ni(II) ions from aqueous solution using chitosaneMAA nanoparticles, Int. J. Biol. Macromol. 61 (2013) 251e263.
Fig. 13.“Ions-holes”mechanism for removing of Pb2þions by MnO2/CS.
0 2 4 6 8 10 12 14 16 100
101 102 103 104
Before After
Counts
Positron Lifetime [ns]
Fig. 14.Positron lifetime spectra of the samples before and after the adsorption of lead(II).
Table 5
Positron lifetimes and annihilation intensities of the samples.
Sample t1(ns) t2(ns) t3(ns) I1(%) I2(%) I3(%)
[15] M.-W. Wan, C.-C. Kan, B.D. Rogel, M.L.P. Dalida, Adsorption of copper (II) and lead (II) ions from aqueous solution on chitosan-coated sand, Carbohydr. Polym. 80 (2010) 891e899.
[16] X. Sun, B. Peng, Y. Ji, J. Chen, D. Li, Chitosan(chitin)/cellulose composite bio-sorbents prepared using ionic liquid for heavy metal ions adsorption, AIChE J. 55 (2009) 2062e2069.
[17] L. Ngoc Chung, D. Van Phuc, Sorption of lead (II), cobalt (II) and copper (II) ions from aqueous solutions byg-MnO2nanostructure, Adv. Nat. Sci. Nanosci. Nanotechnol. 6 (2015) 025014.
[18] V.-P. Dinh, N.-C. Le, T.-P.-T. Nguyen, N.-T. Nguyen, Synthesis of a-MnO2 nanomaterial from a precursorg-MnO2: characterization and comparative adsorption of Pb(II) and Fe(III), J. Chem. 2016 (2016) 9.
[19] V.-P. Dinh, N.-C. Le, T.-D. Le, T.-A. Bui, N.-T. Nguyen, Comparison of the adsorption of Fe(III) on alpha- and gamma-MnO2nanostructure, J. Electron. Mater. 46 (2017) 3681e3688.
[20] V.-P. Dinh, N.-C. Le, V.-D. Nguyen, N.-T. Nguyen, Adsorption of zinc (II) onto MnO2/CS composite: equilibrium and kinetic studies, Desalin. Water Treat. 58 (2017) 427e434.
[21] S. Mallakpour, M. Madani, Functionalized-MnO2/chitosan nanocomposites: a promising adsorbent for the removal of lead ions, 147, 2016, pp. 53e59. [22] A.S. Tawfik, Advanced Nanomaterials for Water Engineering, Treatment, and
Hydraulics, IGI Global, Hershey, PA, USA, 2017, pp. 1e384.
[23] S.N. Alhosseini, F. Moztarzadeh, M. Mozafari, S. Asgari, M. Dodel, A. Samadikuchaksaraei, S. Kargozar, N. Jalali, Synthesis and characterization of electrospun polyvinyl alcohol nanofibrous scaffolds modified by blending with chitosan for neural tissue engineering, Int. J. Nanomed. 7 (2012) 25e34. [24] A.S.K. Kumar, S.-J. Jiang, Chitosan-functionalized graphene oxide: a novel adsorbent an efficient adsorption of arsenic from aqueous solution, J Environ Chem Eng 4 (2016) 1698e1713.
[25] W. Sun, L. Chen, Y. Wang, Y. Zhou, S. Meng, H. Li, Y. Luo, Synthesis of highly conductive PPy/graphene/MnO2 composite using ultrasonic irradiation, Synth. React. Inorg. Met.-Org. Nano-Metal Chem. 46 (2016) 437e444. [26] R. Yang, Z. Wang, L. Dai, L. Chen, Synthesis and characterization of
single-crystalline nanorods of a-MnO2 and g-MnOOH, Mater. Chem. Phys. 93 (2005) 149e153.
[27] K.E. Engates, H.J. Shipley, Adsorption of Pb, Cd, Cu, Zn, and Ni to titanium dioxide nanoparticles: effect of particle size, solid concentration, and exhaustion, 18, 2011, pp. 386e395.
[28] B.R. Müller, Effect of particle size and surface area on the adsorption of albumin-bonded bilirubin on activated carbon, Carbon 48 (2010) 3607e3615. [29] H. Wang, F. Shadman, Effect of particle size on the adsorption and desorption
properties of oxide nanoparticles, 59, 2013, pp. 1502e1510.
[30] M. Gheju, I. Balcu, G. Mosoarca, Removal of Cr(VI) from aqueous solutions by adsorption on MnO2, J. Hazard Mater. 310 (2016) 270e277.
[31] K.Y. Foo, B.H. Hameed, Insights into the modeling of adsorption isotherm systems, Chem. Eng. J. 156 (2010) 2e10.
[32] I. Langmuir, The adsorption of gases on plane surfaces of glass, mica and platinum, J. Am. Chem. Soc. 40 (1918) 1361e1403.
[33] H.M.F. Freundlich, Over the adsorption in solution, J. Phys. Chem. 57 (1906) 385e471.
[34] T.A. Saleh, A. Sarı, M. Tuzen, Effective adsorption of antimony(III) from aqueous solutions by polyamide-graphene composite as a novel adsorbent, Chem. Eng. J. 307 (2017) 230e238.
[35] M.J. Temkin, V. Pyzhev, Recent modifications to Langmuir isotherms, Acta Physiochim URSS 12 (1940) 217e225.
[36] J. Anwar, U. Shafique, Z. Waheed uz, M. Salman, A. Dar, S. Anwar, Removal of Pb(II) and Cd(II) from water by adsorption on peels of banana, Bioresour. Technol. 101 (2010) 1752e1755.
[37] R.R. Bhatt, B.A. Shah, Sorption studies of heavy metal ions by salicylic acid-eformaldehydeecatechol terpolymeric resin: isotherm, kinetic and thermo-dynamics, Arab. J. Chem. 8 (2015) 414e426.
[38] X. Xiao, Lei, T. Lin, M. Guang, Zeng, S. Meng, Wu, Y. Yao, Zhou, P. Ya, Y. Yuan, Liu, L. Zhen, D. Gui, Yang, Study on magnetic chitosan microparticles for rapid removal of heavy metals, Adv. Mater. Res. 518e523 (2012) 2844e2848. [39] W.S. Wan Ngah, L.C. Teong, M.A.K.M. Hanafiah, Adsorption of dyes and heavy
metal ions by chitosan composites: a review, Carbohyd. Polym. 83 (2011) 1446e1456.
[40] T.A. Saleh, Nanocomposite of carbon nanotubes/silica nanoparticles and their use for adsorption of Pb(II): from surface properties to sorption mechanism, Desalin. Water Treat. 57 (2016) 10730e10744.
[41] Z.A. Jamiu, T.A. Saleh, S.A. Ali, Synthesis of a unique cross-linked poly-zwitterion/anion with an aspartic acid residue and its use for Pb2þremoval
from aqueous solution, RSC Advances 5 (2015) 42222e42232.
[42] H.A. Sani, M.B. Ahmad, T.A. Saleh, Synthesis of zinc oxide/talc nanocomposite for enhanced lead adsorption from aqueous solutions, RSC Advances 6 (2016) 108819e108827.
[43] H.A. Sani, M.B. Ahmad, M.Z. Hussein, N.A. Ibrahim, A. Musa, T.A. Saleh, Nanocomposite of ZnO with montmorillonite for removal of lead and copper ions from aqueous solutions, Process Saf. Environ. Protect. 109 (2017) 97e105.
[44] R.-L. Tseng, F.-C. Wu, R.-S. Juang, Characteristics and applications of the Lagergren'sfirst-order equation for adsorption kinetics, J. Taiwan Inst. Chem. Eng. 41 (2010) 661e669.
[45] Y.S. Ho, G. McKay, Pseudo-second order model for sorption processes, Process Biochem. 34 (1999) 451e465.
[46] W.J. Weber, J.C. Morris, Kinetics of adsorption carbon from solutions, J. Sanit. Eng. Div., Proc. Am. Soc. Civ. Eng. 89 (1963) 31e60.
[47] S. Vasiliu, I. Bunia, S. Racovita, V. Neagu, Adsorption of cefotaxime sodium salt on polymer coated ion exchange resin microparticles: kinetics, equilibrium and thermodynamic studies, Carbohydr. Polym. 85 (2011) 376e387. [48] F.-C. Wu, R.-L. Tseng, R.-S. Juang, Comparative adsorption of metal and dye on
flake- and bead-types of chitosans prepared fromfishery wastes, J. Hazard Mater. 73 (2000) 63e75.
[49] V.J. Inglezakis, A.A. Zorpas, Heat of adsorption, adsorption energy and acti-vation energy in adsorption and ion exchange systems, Desalin. Water Treat. 39 (2012) 149e157.
[50] A.B. Albadarin, C. Mangwandi, A.a.H. Al-Muhtaseb, G.M. Walker, S.J. Allen, M.N.M. Ahmad, Kinetic and thermodynamics of chromium ions adsorption onto low-cost dolomite adsorbent, Chem. Eng. J. 179 (2012) 193e202. [51] T.A. Saleh, A. Sarı, M. Tuzen, Optimization of parameters with experimental
design for the adsorption of mercury using polyethylenimine modifi ed-activated carbon, J. Environ. Chem. Eng. 5 (2017) 1079e1088.
[52] L.A. Tuyen, E. Szilagyi, E. Kotai, K. Lazar, L. Bottyan, T.Q. Dung, L.C. Cuong, D.D. Khiem, P.T. Phuc, L.L. Nguyen, P.T. Hue, N.T.N. Hue, C.V. Tao, H.D. Chuong, Structural effects induced by 2.5MeV proton beam on zeolite 4A: positron annihilation and X-ray diffraction study, Radiat. Phys. Chem. 106 (2015) 355e359.
[53] L. Anh Tuyen, N. Quang Hung, L. Chi Cuong, D. Duy Khiem, P. Trong Phuc, L. Ly Nguyen, N.T. Ngoc Hue, P. Thi Hue, D. Van Phuc, Simultaneous existence of defects and mesopores in nanosized ZSM-5 zeolite studied by positron annihilation and X-ray diffraction spectroscopies, J. Appl. Phys. 121 (2017) 084303.