ISSN: 2147-611X
www.ijemst.com
Portraying Primary Fraction Teaching:
A Variety of Mathematical Richness,
Pedagogic
Strategies,
and
Use
of
Curriculum Materials
Marieke Thurlings1, Maaike Koopman1, Perry den Brok2 and Birgit Pepin1
1Eindhoven University of Technology
2Wageningen University & Research, Social Sciences Group
To cite this article:
Thurlings, M., Koopman, M., den Brok, P. & Pepin, B. (2019). Portraying primary fraction
teaching: A variety of mathematical richness, pedagogic strategies, and use of curriculum
materials.
International Journal of Education in Mathematics, Science and Technology
(IJEMST), 7(2
), 170-185. DOI:10.18404/ijemst.552452
This article may be used for research, teaching, and private study purposes.
Any substantial or systematic reproduction, redistribution, reselling, loan, sub-licensing,
systematic supply, or distribution in any form to anyone is expressly forbidden.
Authors alone are responsible for the contents of their articles. The journal owns the
copyright of the articles.
Volume 7, Number 2, 2019
DOI:10.18404/ijemst.552452
Portraying Primary Fraction Teaching: A Variety of Mathematical
Richness, Pedagogic Strategies, and Use of Curriculum Materials
Marieke Thurlings, Maaike Koopman, Perry den Brok, Birgit Pepin
Article Info
Abstract
Article History
Received: 4 October 2018
In this study, the variety in quality of instruction in fraction lessons at Grade 5 in Dutch primary schools was investigated. Twenty-four teachers participated in the study. To examine the quality of instruction of fraction lessons, Hill‟s mathematical quality of instruction framework and general pedagogical instruction strategies (seen to contribute to effective teaching) were combined into an observational scheme. In particular, it was investigated if profiles based on lesson observations could be identified using cluster analysis, and how these profiles could be characterized. The cluster analysis was validated by comparing different types of cluster analyses, discriminant analysis as well as via expert consultation sessions. Results showed six profiles of fraction lessons, which differed in terms of the extent to whether teaching was connectivist or transmissionist in nature, and the extent to which teaching was student-focused or content-focused. The study contributes to existing studies by developing the Quality of Instruction for Fraction Lessons (QIFL)
framework, and by showing a more nuanced and richer picture of the teaching of fractions than previous studies. In terms of practical implications, the study showed that it is the combination of organizing a lesson well, a good pedagogical climate, and a focus on understanding the subject matter that contributes to good teaching.
Accepted: 27 February 2019
Keywords
Cluster analysis Explorative study Fraction lessons Mathematical quality of instruction
Introduction
This study focuses on capturing the diversity in mathematics teaching, in particular fraction teaching, in Dutch grade 5 classrooms. Fractions are considered as one of the most difficult concepts in primary mathematics teaching and learning for several reasons. For example, they do not occur in students‟ daily life (Nickson, 2000). Additionally, the nature of a fraction, that consists of a numerator and denominator, is difficult for students to grasp. They have to come to understand the difference between whole numbers, and the meaning of a numerator and denominator (Behr, Wachsmuth, Post, & Lesh, 1984; Lamon, 2012; Nickson, 2000). Students often find it difficult to understand that the unit may not only be one object, but also a group of objects (e.g., Lamon, 2012). Similarly, the notion of relative comparison is perceived as difficult, which means that a fraction can be a process (of dividing two numbers) and a product (i.e., the outcome of a division) simultaneously (e.g., Sfard, 1991). Calculating with fractions difficult, for example the notion of “multiplying makes larger” is not necessarily applicable (Hart, 1981). These and other researchers (e.g., Torbeyns, Schneider, Xin, & Siegler, 2015) suggest teachers play an essential role in the development of children‟s ability to work with fractions. The importance of the teacher‟s role has also been raised in mathematics textbook research (e.g., Charalambous, Delaney, Hsu, & Mesa, 2010). These studies have concluded that the mediation of these curriculum materials in the classroom, rather than the curriculum materials themselves, influenced how students learn fractions.
what counts as good teaching are relevant for any mathematics lesson, but given the abstract nature of fractions and the difficulties students have in learning about fractions, become much more relevant.
While many studies have investigated mathematics lessons from a more general teaching perspective (Creemers & Reezigt, 1996; Muijs et al., 2014), much less have attempted to do so from a subject-matter perspective or from a combination of these perspectives. We have combined these two lenses in our analytical frame for the quality of fraction lessons, to provide a more complete notion for quality of instruction, and we have therefore amended the original MQI instrument to fit both perspectives (cf. Charalambous & Praetorius, 2018). We refer to this combination as the Quality of Instruction for Fraction lessons (QIFl) framework.
Theoretical Framework
As stated in the introduction, in this study, two theoretical lenses were used, namely (a) the mathematical quality of instruction and (b) general pedagogical instruction strategies. The mathematical quality of instruction considers the question of what constitutes good quality of mathematics instruction (e.g., Ball et al., 2008). In this study, we applied the MQI instrument that was developed by the Learning Mathematics for Teaching Project (2010), which is the constellation of dimensions that describe “the rigor and richness of the mathematics of the lesson” (Hill et al., 2008, p. 431), such as students‟ and teachers‟ explanations and student participation. As a whole, the four MQI dimensions consider how teacher, students, and the content of the lesson interact. The first dimension is richness, which concerns how teachers present the content of the lesson. For example, do teachers explain why something is correct or calculated in a given manner and do they connect and link between for example drawings representing fractions and written fractions. The second dimension is working with students and mathematics, which concerns how teachers and students work together and interact about the mathematical content of the lesson. For example, do teachers remediate errors students make and if so, do teachers explain procedural steps (how) or do they address conceptual notions (why) while remediating the errors? The third dimension is errors and imprecision, and deals with errors made by teachers in terms of for instance their own language use and mathematical notation. The fourth and final dimension is student participation in meaning making and reasoning, which deals with how students interact with the lesson content. For example, do students provide explanations and are they actively working on the mathematics? Each dimension consists of a number of codes that operationalize the dimensions (see Table 1).
The second lens that was used in this study has its origins in school effectiveness and school improvement studies that have found characteristics of good teaching, contributing to student learning (e.g., Muijs et al., 2014; Sammons, Hillman, & Mortimore, 1995). These characteristics are more general, and they focus on general pedagogical instruction strategies. Generally, research has shown that a set of general pedagogical instruction strategies are relevant: (a) time on task, (b) certain teaching strategies, (c) the direct instruction model, (d) using curriculum materials, and (e) communicating high expectations. First, learning time, in terms of opportunity to learn or time on task, is said to be essential for learning gains (Creemers & Reezigt, 1996; Muijs et al., 2014). In other words, as much lesson time as possible should be connected to mathematical content (Learning Mathematics for Teaching Project, 2010). Second, Sammons et al. (1995) showed that teaching strategies such as orienting, guided instruction, and summarizing promoted learning. Third, the direct instruction model has appeared to be an effective approach to teaching, and in particular in the domain of mathematics (Houtveen, Van de Grift, & Creemers, 2004). The direct instruction model structures a lesson around four phases: orienting, guided practice, working individually or in small groups, and discussion. The direct instruction model is used in many Dutch primary schools, and the Dutch Inspectorate looks for the application of this model when visiting classrooms. Clearly, there are other approaches to effective instruction (e.g., Muijs et al., 2014), that are practiced elsewhere, but typically they include similar kinds of phases. Fourth, the extent to which teachers follow curriculum materials influences the effectiveness of instruction (Hill & Charalambous, 2012), that is if they rely heavily on the curriculum materials it might lead to teaching by the book, rather than being student-focused. Fifth, effective teachers have been shown to communicate high, but realistic expectations about student achievement (e.g., Creemers & Reezigt, 1996; Muijs et al., 2014).
Aims and Research Questions
2012; Hill, Umland, Litke, & Kapitula, 2012), with the exception of Gallacher (2016), who observed Grade 4 and 5 mathematic lessons in the United States. Using the four MQI dimensions, their 13 corresponding codes, and cluster analysis, she identified four profiles: (a) strong practices that scored high on all MQI codes, (b) developing practices that scored averaged on all MQI codes, (c) weak practices scored low on MQI but did not make many errors, and (d) lots of errors, who scored low on MQI and made lots of errors. The recent study used cluster analysis and attempted to establish a typology (i.e., a set of profiles) of fraction lessons with QIFl, thus taking a person-centred approach (Pastor et al., 2007).
In this explorative study, we aimed to reveal profiles of Dutch teachers‟ fraction lessons in terms of QIFl. The research question was formulated as follows: Which profiles of teachers’ fraction lessons can be distinguished,
and what characterizes these profiles?
Research Design and Methods
Participants
In order to find teachers, emails were sent to primary schools, explaining the purpose and details of the study. Participation in the study was completely voluntary, and twenty-four Dutch primary education teachers (8 males, 16 females) of 23 schools opted in. Their mean age was 42 years (sd = 10.73 years, min = 28 years, max = 60 years). Ten of them had between eight and 15 years of teaching experience, eight between four and seven years, five more than 16 years; and one for between zero and three years. Eighteen participants were regular teachers, but some also had additional functions within their schools, such as mathematics coordinator. All teachers were teaching Grade 5, in which fractions are an important part of the mathematics curriculum.
Procedure
The teachers were followed over one school year. Three fraction lessons of each teacher were video- and audio-taped. These lessons were distributed over the year: the first lesson was observed in October; the second lesson in February/March; and the third lesson in May/June. When arranging a date and time to observe, we explicitly asked teachers in which lessons fractions were the main topic and observed these. Teachers thus followed their own lesson plans and/or the curriculum materials. Therefore, the content of lessons differed from for example comparing fractions (e.g., two painters are painting a wall each, one has painted , the other : which of them painted the most and what is the difference between them), linking fractions with percentages and decimals, to applying fractions to, for example, baking cookies. This approach was chosen, because it would show teachers‟ ability of providing a fraction lesson in an authentic setting.
The QIFl Instrument
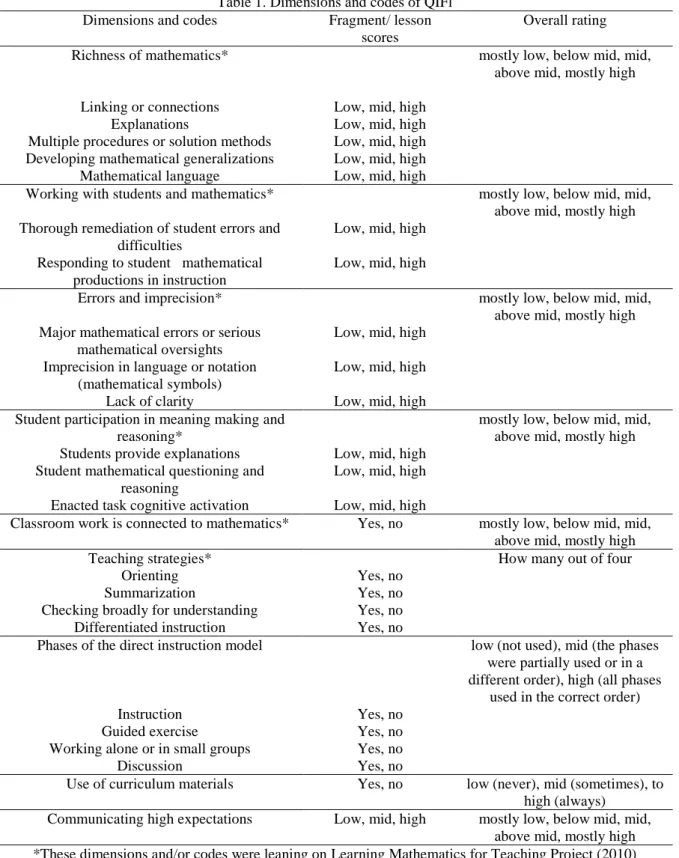
To analyse the lessons in terms of QIFl, we used the original MQI instrument (Learning Mathematics for Teaching Project, 2010) and amended it to include general pedagogical instruction strategies. QIFl consists of nine codes, four of which are leaning on the original MQI dimensions (see Table 1). Each dimension consists of several codes that are scored on lesson fragments of about seven minutes. The 72 video-taped lessons were therefore divided into such fragments, which were each coded. Each code was given a score of low (i.e., did not occur, or was of poor quality), mid (i.e., did occur and was of reasonable quality), or high (i.e., did occur and was of good or exceptional quality). All codes in the errors and imprecision dimension were scored conversely, meaning that a low score represented no errors or imprecision.
Table 1. Dimensions and codes of QIFl Dimensions and codes Fragment/ lesson
scores
Overall rating
Richness of mathematics* mostly low, below mid, mid,
above mid, mostly high Linking or connections Low, mid, high
Explanations Low, mid, high
Multiple procedures or solution methods Low, mid, high Developing mathematical generalizations Low, mid, high
Mathematical language Low, mid, high
Working with students and mathematics* mostly low, below mid, mid,
above mid, mostly high Thorough remediation of student errors and
difficulties
Low, mid, high Responding to student mathematical
productions in instruction
Low, mid, high
Errors and imprecision* mostly low, below mid, mid,
above mid, mostly high Major mathematical errors or serious
mathematical oversights
Low, mid, high Imprecision in language or notation
(mathematical symbols)
Low, mid, high
Lack of clarity Low, mid, high
Student participation in meaning making and reasoning*
mostly low, below mid, mid, above mid, mostly high Students provide explanations Low, mid, high
Student mathematical questioning and reasoning
Low, mid, high Enacted task cognitive activation Low, mid, high
Classroom work is connected to mathematics* Yes, no mostly low, below mid, mid, above mid, mostly high
Teaching strategies* How many out of four
Orienting Yes, no
Summarization Yes, no
Checking broadly for understanding Yes, no
Differentiated instruction Yes, no
Phases of the direct instruction model low (not used), mid (the phases were partially used or in a different order), high (all phases
used in the correct order)
Instruction Yes, no
Guided exercise Yes, no
Working alone or in small groups Yes, no
Discussion Yes, no
Use of curriculum materials Yes, no low (never), mid (sometimes), to high (always)
Communicating high expectations Low, mid, high mostly low, below mid, mid, above mid, mostly high *These dimensions and/or codes were leaning on Learning Mathematics for Teaching Project (2010) The inter-rater reliability of the scoring of the QIFl was established. Two researchers (also two of the authors) were involved, who each followed an online MQI training developed by Hill and colleagues (https://cepr.harvard.edu/mqi-access). The researchers independently scored 48 fragments (about 10% of all fragments) of six lessons of six teachers that were chosen randomly. During this process, the researchers held several discussions dealing with the interpretation of the codes. The percentages of agreement per MQI dimension were: Richness of mathematics: 78.33%, Working with students and mathematics: 85.42%, Errors and imprecision: 94.44%, and Student-participating in meaning making and reasoning: 88.19%. The percentages of agreement for the general pedagogical instruction strategies were: Classroom work is connected
Communicating high expectations: 50%, and Use of curriculum materials: 100%. Therefore, it was concluded that the scoring of QIFl was reliable. Subsequently, all lesson fragments were scored by the two researchers. Next, because we wanted to get an overall perspective on the QIFl per lesson, the fragment scores on the codes per dimension were combined to an overall rating of each dimension per lesson (Koopman, Thurlings, & den Brok, 2019). To do so, a five-point scale was developed (1 = mostly low, 2 = below mid, 3 = mid, 4 = above mid, and 5 = mostly high). For example, one teacher‟s scores on the fragment codes within the dimension
working with students and mathematics were h, h, h, h, h, m, and l (Remediation of student errors and difficulties) and h, m, h, h, h, h, h, and l (Responding to student mathematical productions in instruction). His overall score on the dimension became 5, as the vast majority of his fragment scores were high. It was decided to combine the fragment scores to determine the overall quality of a lesson per dimension, because the overall picture was considered more representative of the quality of a dimension in a lesson than the separate scores per fragment. The same approach was also used for two of the codes for the general pedagogical instruction strategies: connected to mathematics and communicating high expectations. A similar kind of approach was used combining the scores of the three remaining codes of QIFl into an overall rating. The code teaching strategies was rated onto the number of teaching strategies used (no strategies = 0, all strategies = 4). The fragment scores of the code direct instruction model were converted into a lesson level rating, ranging from low (the direct instruction model was not used), to mid (the phases of the direct instruction model were partially used or in a different order than described in Houtveen et al. [2004]), to high (all phases of the direct instruction model were used completely and in the correct order). The fragment scores of the binary code (i.e., yes or no) of application of curriculum materials were converted into a lesson level rating, ranging from low (the curriculum materials were not used at all), to mid (the curriculum materials were partially used during the lesson), to high (the curriculum materials were used during the whole lesson).
To establish reliability of this procedure, we used two approaches. First, correlation analyses of the separate fragment scores per code and their overall ratings per lesson showed all scores contributed to the overall quality ratings: all correlations were significant and ranged between 0.30 and 0.64. Second, to establish reliability of the scoring procedure researcher B followed an audit-like procedure and checked the overall scores given by researcher A. This yielded an overall agreement of over 80% and, next, in case of disagreement, the researchers discussed until agreement was reached.
Analysis
By means of cluster analysis, we explored whether the teachers‟ lessons could be divided into clusters. Cluster analysis is a technique that identifies groups wherein individuals are similar to each other but different to individuals in other groups (Norusis, 2011). The nine dimensions of QIFl were used as cluster variables. We applied hierarchical cluster analysis. Euclidean distances were used to make sure the clusters were optimally different from each other. The Ward method was used to make sure teachers within one cluster were optimally similar. We applied three additional criteria to decide on the most appropriate clusters: (a) the Eta-square on the nine codes, explaining whether clusters were statistically different in terms of its constitute parts, had to increase significantly for each new cluster solution; (b) there had to be more than one member within each cluster; and (c) the clusters had to be interpretable.
Based on criterion a, we started by exploring the means and standard deviations of the nine codes for four, five, and six cluster solutions. Criterion b was met in each option. Next, we tried to interpret the groups in the four, five and six clusters (criterion c): could we formulate how each group is characterized? As the groups within the four and five clusters were harder to interpret than those in the six clusters, we decided on six clusters. Discriminant analysis was used to validate the 6 cluster solution. The discriminant analysis revealed that 66.7% (i.e., 16 teachers) of the individuals was similarly classified compared to cluster membership.
To further validate the six cluster solution, two other approaches to cluster analysis were applied (hierarchical cluster analysis with between groups links and k-means). These approaches mostly showed the same clustering as the Ward approach. Furthermore, we consulted three experts, who were all mathematics teacher educators for primary education. After an explanation of QIFl, they were presented with the texts of the six portraits. We asked them whether they recognized the teaching in each portrait and whether and which differences they saw between the portraits. Next, they were shown six graphical representations, based on the means of each cluster and graphical representations of scores of each of the 24 teachers, and we asked them to group the 24 teachers into the six clusters. Each session was audio-taped and notes were taken. The experts recognized the six portraits in similar ways we did. Expert 1 correctly grouped 71% of the teachers‟ graphical representations, expert 2 79%, and expert 3 92%. Based on the expert consultation, some details (e.g., more fraction examples and details on e.g. the kind of blackboard teachers used) were changed within these portraits, to clarify issues they raised. To sum up, the other approaches to cluster analysis showed the same results and the experts recognized the portraits, identified the similarities and differences between the clusters as we did in our discussions, and mostly grouped the individual members of the clusters into the appropriate graphical representations.
Results
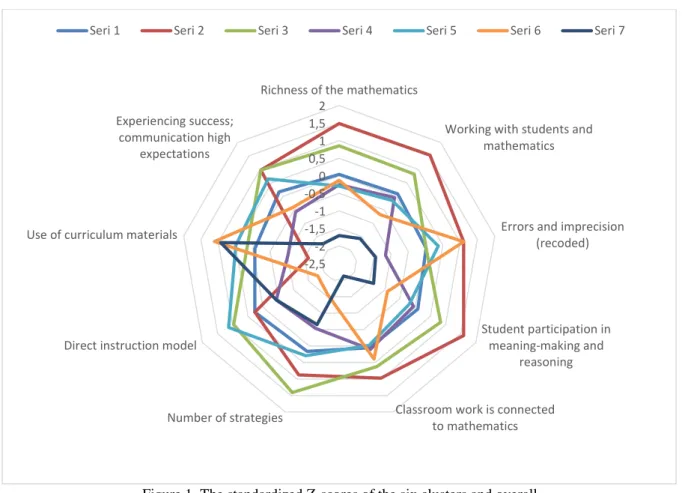
The first row in Table 2 shows the means, standard deviations, and standardized Z-scores for the 24 teachers‟ observation results. Standardized Z-scores were used as the possible minimum and maximum scores differed between the variables (see Table 1). Generally, the scores on the MQI dimensions were close to the centre of the scale, except for errors and imprecision: most lessons were almost error-free (m = 4,29, sd = 0.78). The scores on the general pedagogical instruction strategies showed effective teaching in terms of connectedness to mathematics (m = 4,47, sd = 0,63, minimum score = 1, maximum score = 5) and communicating high expectations to students (m = 3,96, sd = 1,09, minimum score = 1, maximum score = 5). Generally, about three out of four possible teaching strategies were used (m = 3,06, sd = 0,64). The strategy summarizing was usually not present.
Six teacher profiles were identified. Table 2 additionally shows the descriptive statistics for QIFl for each cluster, including the standardized Z-scores. As the standardized Z-scores made the differences between the clusters clearer, Figure 1 shows these standardized Z-scores in a radar plot. The first two clusters scored high on the subject-matter teaching, on all four of the original MQI codes, yet cluster 1 scored higher on the Student participation in meaning making and reasoning dimension than cluster 2. These two clusters differed in their general pedagogical approach: Cluster 1 was more student-focused, while cluster 2 was more content- and teacher-focused. This difference lay in the scores on Student participation in meaning making and reasoning
dimension (higher for cluster 1 than 2), Direct instruction model (higher for cluster 2 than 1) and Use of curriculum materials (higher for cluster 2 than 1). Cluster 1 was labelled connectivist teaching linking to student thinking, and connectivist teaching for short. The label for cluster 2 became transmissionist, thorough, content oriented teaching, and thorough teaching for short.
Clusters 3 and 4 both scored around average on the subject-matter teaching, yet cluster 3 tended to make more errors (Errors and imprecision) than cluster 4. Cluster 3 tried to be student-focused and to experiment with or beyond the curriculum materials (lower score on Direct instruction model and Use of curriculum materials), but where not able to provide rich lessons (lower score on Richness) and was therefore were labelled as creative, experimenting teaching – and experimenting teaching for short. Cluster 4 followed the curriculum materials closely and were teacher-focused (high scores on Direct instruction model and Use of curriculum materials). Therefore, this cluster was called autopilot teaching, linking to content, and autopilot teaching for short.
Cluster 5 was similar to cluster 4, yet they had classroom management issues. They used the curriculum materials extensively, which is probably why they made few errors (high score on Errors and imprecision). This cluster was labelled content-oriented and relying completely on the textbook teaching, and teaching to the book for short. Finally, cluster 6-teachers were found to teach problematic lessons, from both the subject-matter teaching perspective and from the general pedagogical strategies perspective (their scores were almost always the lowest as compared to the other clusters) – which was corroborated by the experts – and each of them showed similar kinds of issues with their classroom management as cluster 5, and can be described as ineffective teaching.
portray a lesson from individual members of each cluster. Within these portraits we refer to the dimensions and/or codes of QIFl, depicted in brackets and in italics, to connect the portrait with QIFl.
Connectivist Teaching Linking to Student Thinking
An example of a cluster-1 teacher is Jeanine. The atmosphere in her classroom was safe and friendly. Her first lesson was loosely structured around the direct instruction model. She did not use any curriculum materials but self-made worksheets. Jeanine started this lesson by asking: “What is a fraction?” Students were given ample opportunities to answer. Jeanine used continuous questioning, challenging her students to explain more and why (Student participation in meaning making and reasoning). For example, one student said: “If you have a pizza, and you cut in half, both have the same” (Student explanation). Jeanine used the example of braking one‟s leg,
to explain that fractions are divisions and there is the „whole‟. Using examples, such as their class of 23 students and a bar of chocolate, the students concluded that the whole is not necessarily one (Linking and connections, Explanations, Developing mathematical generalizations, Mathematical language, Student provide explanations).
Another student said that if you add and you have to do something else, which is difficult. Jeanine kept on challenging, asking why. She and the students concluded that these fractions are like apples and pears, which one has to compute to bananas for example (i.e., finding the common denominator). At the end of this introduction, all the rules that were discussed previously concerning fractions were summarized by all students, such as recalculating fractions into their equivalent by searching for the common denominator (referring to the apples, pears, and bananas) before ordering, comparing, adding or subtracting fractions.
Next, Jeanine handed out self-made worksheets and two of her students distributed these worksheets to their classmates. All fraction problems on the worksheet, on graph paper so students could easily make bars, dealt with addition and subtraction of fractions and students were asked to draw their solutions and procedures. Even though she did not verbalise the learning goal for this lesson, it was clear from the video that she aimed for understanding concerning fractions with different denominators, and that drawing the problem would support this understanding, which connected to what one student had deemed as difficult in the beginning of the lesson. Jeanine used the digital whiteboard to show the first fraction problem ( ), and asked a student to work out this problem, using bars (Linking and connections). Jeanine kept on asking questions and supported students to help each other out, if they got stuck (Explanations, Working with students and mathematics, Student explanations). A second problem ( ) was similarly addressed. Jeanine said: Doing math is drawing, and by explicitly doing so on the blackboard, she visualized links (Linking and connections).
Figure 1. The standardized Z-scores of the six clusters and overall
Note. Series1 = the overall mean; Series2 = cluster 1; Series3 = cluster 2; Series4 = cluster 3; Series5 = cluster 4; Series6 = cluster 5; and Series7 = cluster 6.
Transmissionist, Thorough, Content-Oriented Teaching
An example of a cluster-2 teacher is Dave. His second lesson was similarly structured around the direct instruction model as was the lesson of Jeanine described above. The atmosphere in Dave‟s classroom was friendly and cheerful, and he communicated high expectations to his students. After showing the lesson goal, from the textbook materials (i.e., recognizing equivalent fractions), he also began the lesson with the question “What do you know about fractions?”, linking to the lesson goal from the regular curriculum materials (i.e., recognizing equivalent fractions). After his students had discussed this question in small groups, Dave collected their outcomes and wrote them on the blackboard. One of the students said: “ ” and Dave asked another student to prove this is true. He drew a pie on the blackboard, helping the student immediately (Richness, Student participation in meaning making and reasoning). Later on, he addressed the concepts and meaning of denominator and numerator (Links and connections, Explanations, Developing generalizations, Mathematical language [Richness], Remediating of errors, Responding to student mathematical productions).
The main difference between Dave and Jeanine was that Dave steered the students much more than Jeanine (i.e., his approach was more teacher-centred). Dave asked direct questions or asked students to finish his sentences, while Jeanine took a more open-ended approach. For example, while proving that “ ”, Dave said “so, of that pie is equal to…” student: “ ?”, Dave “equal to of that pie”. A similarity between them was that they used misconceptions or errors of students to explain and correct concepts without any disapproval (Working with students and mathematics). After the whole class instruction, students worked on assignments from the regular
curriculum materials and Dave circled around to help students (Richness, Working with students and mathematics dimension, Student participation in meaning making and reasoning). Dave ended the lesson by summarizing what the class had been doing and learning, and he repeated the main points (the final phase of the direct instruction model). The experts indicated that Dave‟s lesson was a good standard lesson full of subject matter knowledge.
-2,5 -2 -1,5 -1 -0,5 0 0,5 1 1,5 2
Richness of the mathematics
Working with students and mathematics
Errors and imprecision (recoded)
Student participation in meaning-making and
reasoning
Classroom work is connected to mathematics Number of strategies
Direct instruction model Use of curriculum materials
Experiencing success; communication high
expectations
Creative, Experimenting Teaching
An example of a cluster-3 teacher is Nigella, who was affiliated to a Steiner school. She hardly used the
curriculum materials and followed the direct instruction model approximately, and her third lesson held a nice example of how she tried to provide a creative lesson without any of the curriculum materials, however, this did not lead to richness. In this lesson, she developed fraction problems that all dealt with baking cookies. She did not verbalise a learning goal, but said: “We‟re going to calculate these problems”, which she had written on the blackboard. Students were asked, for example, to work out the relation between water and flower or to recalculate a recipe that was written for four people to six people. Fractions were also linked to percentages and decimals: in some cases, Nigella had given some information concerning the recipes in percentages or decimals. During the lesson, Nigella discussed the fraction problems plenary, in which she asked questions, but constantly she wrote the answers on the blackboard before students actually said the answer or she gave the answer to her own question by herself. In between these plenary discussions, students worked alone or in small groups and Nigella circled around helping and encouraging students.
At almost all instances, the procedure of solving the problem was more prominent than the mathematical reasoning (i.e., procedural level rather than conceptual; Richness). For example, in one of the cookie recipes, 1000 grams of flower was needed for five people and the problem was to calculate the recipe for three people. Nigella steered the conversation and suggested to first calculate grams of flower needed for one person, which she did on the blackboard herself. The next step was to multiply the 200 grams for one person by three. The „why‟ of this procedure was not addressed (Richness). Nigella remediated errors, but only on a procedural (how, rather than why) level. Her students did participate (Student participation in meaning making and reasoning) but were mostly only filling in gaps created in Nigella‟s instruction (e.g., “so if I need 200 gram for one person, for three people I need …”, students: “600”). Nigella did communicate expectations to her students but on a lower level than Jeanine and Dave. In contrast to Jeanine and Dave, Nigella did not activate prior knowledge at the start of the lesson nor did she ask questions like: “How do you know that …”, or “Explain that …” during the lesson (Richness, Student participation in meaning making and reasoning). Also, in contrast to Jeanine and Dave, Nigella did not visualize the calculations, except for one pie to show (Linking and connecting). While Jeanine and Dave both summarized the lesson at its end, Nigella simply said “We‟re done
now”. The experts said that Nigella‟s lesson is based on a good idea, but was not a good lesson, probably because “she started from a fun and motivating activity, rather than from learning goals”.
Autopilot Teaching, Linking to Content
An example from cluster 4 is Monica. Like Nigella, but in contrast to Jeanine and Dave, she did not formulate a lesson goal. She started her second lesson with long division, as her students had recently done a test concerning long division on which several students had scored insufficient marks. Monica used the blackboard to work out two examples. She used a very procedural approach: what to do first, then what and so forth (Richness). Students recited the needed multiplication tables collectively and acted as calculators (Student participation in meaning making and reasoning). Subsequently, she turned to the main subject of the lesson: fractions. During the start of the lesson, several students were not paying attention and Monica had to address them several times (Connected to mathematics), which did help when she wanted to begin with the first fraction problem. At the same time, she communicated high expectations to her students. The assignment, from the curriculum materials, was projected onto the interactive whiteboard. The assignment consisted of several fraction division problems: a bar of 8 cm was divided for example into 6 cm, 2 cm, and 0.5 cm, and students had to find out the corresponding fraction. Monica worked out the first problem (6 cm) on the board in a procedural manner (Richness). First, she and the students agreed that the 8-cm bar was the whole and could be written down as , and 1 cm was therefore Next, she said that the 6-cm bar consisted of 6 out of 8 pieces (Explanations, Linking and connecting). As 1 cm was already said to be , the 6-cm bar was Next, she asked whether this fraction could be “made smaller” (i.e., imprecise mathematical language, while she meant reducing into the lowest common denominator).
working on their tasks (remainders from the curriculum materials-based tasks) and Monica first circled the classroom and then sat behind her desk. Students who had questions were helped to take the next, procedural step, e.g., “so how many do you need to add to make it 80?” or “so 1 cm was , how many is 5 cm?” (Explanations, Student explanations, Remediation of errors). The end of Monica‟s lesson was unclear: several students finished their tasks and started with other tasks for other subjects. The structure of this lesson loosely followed the direct instruction model (i.e., plenary, procedural instruction followed by individual working), and this structure was also observed during Monica‟s first and third lesson. Additionally, in her lessons she followed the curriculum materials closely. It might be argued that cluster-4 teachers acted in an autopilot manner, because they used the curriculum materials extensively without adaptations and did not alternate much in modes of instruction. The experts indicated that Monica‟s lesson was uninspiring, a “model-imitate” approach and questioned Monica‟s knowledge and beliefs.
Content-Oriented and Relying Completely on the Textbook Teaching
An example from a cluster-5 teacher is Sandy. She started her first lesson by turning to the curriculum materials
that were projected on the digital whiteboard. She said: “Open your books at page 68. It‟s about fractions” (i.e., she did not verbalize a learning goal) and very quickly activated students‟ prior knowledge by asking for the meaning of whole, the numerator and denominator (Explanations, Linking and connecting). Sandy went over the fraction problems displayed in the curriculum materials, explaining what students needed to do (i.e., the solution procedure). During this 15 minute plenary instruction, we observed some explanations (Explanations; Student explanations), for example when a student solved , Sandy explained that the whole was divided into fours, three out of fours were complete, so was missing and therefore the answer (Remediation of student errors), but scores for all other codes were low. Sandy worked out all the steps herself, rather than involving the students, writing the calculations on the side of a whiteboard, quickly stepping over steps such as
rather than (Working with students and mathematics, Student participation in meaning making and reasoning). She orally explained such steps, but very quickly, short, and on a procedural level only (Richness). At the end of the instruction of each type of fraction problem, she asked if there were any students having questions. Several of them said they did not understand, and Sandy said she would come to them later on during the lesson and kept on going on the fraction problems displayed on the digital whiteboard. After about 20 minutes, she and the students held a break; afterwards, students worked alone or in small groups on the same tasks and Sandy circled around, checking answers and helping students on a procedural level to achieve the correct answer (Richness, Student participation in meaning making and reasoning). If these individual students gave the correct answer, Sandy would say: “All right, you got it”.
Throughout the whole lesson, students were disruptive, not paying attention or not working on the tasks, and therefore the scores for Student participation in meaning making and reasoning and in Connectedness to mathematics were low. Sandy kept on ssh-ing, asking them to pay attention and work on. The lesson ended like Nigella‟s, as Sandy simply said: “We‟re going to stop now”, complimented the students for working hard and said that she hoped students now understood fractions, and that if they had any questions they should ask. During this second part of the lesson, we observed some explanations and remediation of errors (receiving a mid-score), for example when she helped a student in solving , she asked what 1 is, and with his answer the student came to the correct answer. Subsequently, she and the student solved a number of similar fraction problems, and then she concluded that he understood, and said that he should always solve such problems by working out the 1 into a fraction with an equivalent denominator. This lesson followed the phases of the direct instruction model closely, contrary to her other lessons and the other cluster-5 teachers‟. She communicated expectations to her students but not on a high level. For instance, when one student asked a question, she said rather sarcastically: “Well, now I know, who‟s not paying attention”. The experts said that Sandy‟s lesson was, like Monica‟s, uninspiring and a “model-imitate” approach, and additionally chasing through the textbook and having classroom issues. They also questioned Sandy‟s knowledge and beliefs.
Ineffective Teaching
Probably because of these classroom management issues, her lesson was not fully connected to mathematics. At the start of the lesson, there were two series of six pies on the blackboard (a task from the curriculum materials). In the first series, students were asked to name the corresponding fractions to the partially filled out pies; in the second series, to name the percentage. In both cases, there was little mathematical reasoning (Student participation in meaning making and reasoning). For example, in the second series, the six answers were already listed and by means of logic (i.e., that pie is filled out the most and 80% is the highest number, or 25% is left for the one remaining pie) the percentages were linked to the pies. This part of the lesson was one fragment. While she visually depicted fraction problems, she did not use these to verbally link and connect (Linking and connecting). Next, she showed the learning goal, from the lesson materials: “You will learn how many percent is added”.
During the next part of the lesson, which took about 10 minutes, Sybil discussed five fraction problems, also from the curriculum materials, concerning percentages (e.g. how many is 125% if you know that 100% is 1000ml of yoghurt). The fraction problems were worked out in a procedural manner, but the steps not articulated, for example, adding the 100% to the 25% was never made explicit (Explanations). If she remediated errors, she would do so in a procedural manner, yet, she tended to neglect student utterances (Explanations, Working with students and mathematics, Responding to students). Next, students were working alone or in small groups on tasks from the curriculum materials and Sybil circled around. Occasionally, she helped students in a procedural way (Explanations, Linking and connecting). Constantly, she kept on ssh-ing and asking for silence. At one point, students actually were silent, but when Sybil left her classroom to retrieve some laptops for students who were already finished, the buzz was back immediately. Several students were not working on mathematics anymore and were pressed to work on their tasks (Connected to mathematics). The end of Sybil‟s
lesson was confusing, it was never clear when it had ended. Except for the discussion phase of the direct instruction model, the lesson was structured around this model. She said that students should put their tasks away, and handed out new materials for the next lesson. Also, she concluded that hardly any student had been
working on any task, moreover, she did not communicate high expectations to her students: she approached her students in a cynical and negative way.
Discussion
In this study, we explored fraction lessons of 24 Dutch primary school teachers. A first contribution to existing studies is the Quality of Instruction for Fraction lessons (QIFl) framework. The QIFl framework combines the MQI instrument, which centres on subject-matter teaching mathematics (Ball, et al., 2008; Hill, Blunk et al., 2008; Learning Mathematics for Teaching Project, 2010), and general pedagogical instruction strategies, that describe teaching from a more pedagogical, instructional point of view (Creemers & Reezigt, 1996; Muijs et al., 2014). Moreover, we exclusively focused on the teaching of fractions. Consequently, we were able to provide a broader picture of what high quality means in this area.
A second contribution of our study is the application of cluster analysis, which made it possible to sketch a more nuanced and richer picture of the teaching of fractions. The findings showed six profiles of teachers, which differed in terms of MQI and the general pedagogical instruction strategies. Table 3 summarizes the names of the six profiles, the focus of their teaching styles, and descriptions of their scores on the codes of the MQI and the general pedagogical instruction strategies. As can be seen in the table, the profiles clearly differed on four dimensions: (a) the extent to whether teaching was connectivist or transmissionist (Askew, et al., 1997), (b) the extent to whether teaching was student-focused or content-focused, (c) the extent to which curriculum materials were used (Hill & Charalambous, 2012), and (d) the extent to which lessons were following a direct instruction model approach or were structured in other ways.
In general there seems to be a gradual diminishment in mathematical reasoning from cluster 1 to cluster 6, which is visible in richness, engagement of the students, and the pedagogical-instructional approach. More specifically, connectivist teaching and experimenting teaching were more connectivist in nature, and thorough teaching, autopilot teaching, and teaching to the book were of transmissionist nature. Connectivist teaching and
experimenting teaching were more focused on students, and thorough teaching, autopilot teaching, and teaching to the book were more content-focused. Thorough teaching, autopilot teaching, and especially teaching to the book and ineffective teaching relied more on the curriculum materials, but it must be noted that thorough teaching used these materials more thoughtfully than the others. Thorough teaching and autopilot teaching
This final issue raises the question of whether the direction instruction model encourages student participation. This question is not unexpected, given the debate about cognitivism versus constructivism that has started during the nineties of the last century. For example, Anderson, Reder and Simon (2000) criticize constructivism, and argue that if students cannot construct knowledge on their own, they need instruction. They also demonstrate that there is few evidence for the effectiveness of approaches to learning such as discovery learning (cf. Kirschner, Sweller, & Clarke, 2006). Yet, these authors do agree that active participation of the learner is key, and they postulate cognitive approaches to learning, where rehearsal and practice are needed. Looking back at our results, the mean score for direct instruction model is between the codes “not using it at all” and “using it partially or in a different order”. Only in thorough teaching and autopilot teaching some individual teachers were given a mean between the codes “using it partially or in a different order” and “using it as is”. Findings presented in this paper cannot be related to student learning. In Koopman et al. (2017), using multilevel analysis, it was explored whether the instructional characteristics related to student learning. It was shown that
Student participation in meaning making and reasoning related positively to that student learning, while the
direct instruction model did not relate. This confirms that active participation of the learner is key to learning. These profiles were revealed in a Dutch context and focused exclusively on fraction lessons. As this context differs from other contexts and countries, where previous studies on MQI were conducted, findings cannot be generalized to these other contexts and countries. At the same time, the findings resonate with those of Gallagher (2016), who validated her four clusters using the Classroom Assessment Scoring System (CLASS). For example, Gallagher‟s strong practices resemble our connectivist teaching and thorough teaching, as they all scored high on both MQI and instructional practices. And, Gallagher‟s weak practices scored lower on MQI and instructional practices, as did our autopilot teaching and teaching to the book.
A first limitation of our study was the small sample size, which was also apparent in the small number of members in teaching to the book and ineffective teaching. On the other hand, the cluster analysis approach showed that ineffective teaching was already a separate group in the four cluster solution, and teaching to the book was split from autopilot teaching in the five cluster solution. Additionally, teachers participated voluntary, which might have biased the findings. And, as the experts suggested, the prior knowlegde of the students might have influenced the content and focus on the lessons. However, a large variety in teaching, both effective and ineffective in terms of QIFl was revealed.
A second limitation is the low interrater reliability of the dimension Communicating high expectations. Therefore, findings with respect to this dimension need to be carefully interpreted. This low interrater reliability can be explained by the manner of scoring: this specific dimension was scored based on the whole lesson, and as we used six lessons and their 48 fragments, the interrater reliability was calculated based on six scores. Furthermore, differences in scoring between researchers were minimal and not systematic. Except for this dimension, we feel the QIFl is valid for the Dutch context. Further research could validate QIFl for another context, in terms of mathematics in general, another specific subject in mathematics, or in terms of another country.
A final limitation is that the cluster analysis approach relies on the interpretation of researchers. When we performed the cluster analysis, choices were made and criteria were set in order to find the most optimal cluster solution. These choices and criteria were anchored in the methodology of performing cluster analysis (Norusis, 2011), yet, the interpretation remains ours. In order to be as reliable as possible, the authors, proficient in the field of STEM education and educational studies, had several discussions in which our interpretations were questioned.
Moreover, the discriminant analysis revealed that the majority of teachers were classified correctly, showing the same kinds of patterns the cluster analysis did, though the percentage was not as high as we might have aimed for. The clusters were generally validated by the experts as they recognized the different approaches to teaching from their experience as teacher educators. However, in this respect the face validity of experimenting teaching
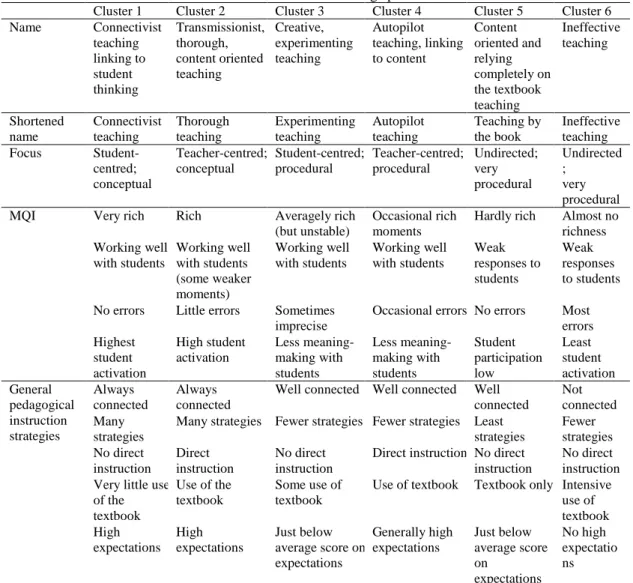
Table 3. Overview of the findings per cluster
Cluster 1 Cluster 2 Cluster 3 Cluster 4 Cluster 5 Cluster 6 Name Connectivist
teaching linking to student thinking Transmissionist, thorough, content oriented teaching Creative, experimenting teaching Autopilot teaching, linking to content Content oriented and relying completely on the textbook teaching Ineffective teaching Shortened name Connectivist teaching Thorough teaching Experimenting teaching Autopilot teaching Teaching by the book Ineffective teaching Focus
Student-centred; conceptual Teacher-centred; conceptual Student-centred; procedural Teacher-centred; procedural Undirected; very procedural Undirected ; very procedural
MQI Very rich Rich Averagely rich
(but unstable)
Occasional rich moments
Hardly rich Almost no richness Working well with students Working well with students (some weaker moments) Working well with students Working well with students Weak responses to students Weak responses to students
No errors Little errors Sometimes imprecise
Occasional errors No errors Most errors Highest student activation High student activation Less meaning-making with students Less meaning-making with students Student participation low Least student activation General pedagogical instruction strategies Always connected Always connected
Well connected Well connected Well connected
Not connected Many
strategies
Many strategies Fewer strategies Fewer strategies Least strategies Fewer strategies No direct instruction Direct instruction No direct instruction
Direct instruction No direct instruction
No direct instruction Very little use
of the textbook
Use of the textbook
Some use of textbook
Use of textbook Textbook only Intensive use of textbook High expectations High expectations Just below average score on expectations Generally high expectations Just below average score on expectations No high expectatio ns
In terms of implications for practice, the profiles of connectivist teaching and thorough teaching function as a speck on the horizon for in-service and for pre-service teachers. These teachers were able to guide lessons and to choose among a variation of teaching strategies, that suits that lesson or situation best. They were able to create a learning environment in which students‟ contributions are recognized and used to guide a lesson. They communicated high expectations to their students, such that they are challenged to work on their tasks. Their lessons were mathematically rich, they remediated errors at a conceptual level, and let students participate actively in the lessons. This resonates with Schoenfeld and Kilpatrick‟s (2008) framework for proficient mathematic teaching, where teaching is based in well-developed subject knowledge, focused on student thinking and learning, performed in well-shaped and thought-through environments, and aimed at teaching for understanding. The residue of the lesson (Hiebert et al., 1997) can be emphasised by summarizing what has been learned – both Jeanine and Dave ended their lessons with a whole-class plenary and take-home message. It is the combination of organizing a lesson well, a good pedagogical climate, and a focus on understanding the subject matter that contributes to good fraction teaching.
Acknowledgement
The research reported here was funded by The Netherlands Organization for Scientific Research (NWO) [grant number 411-10-703].
Note
References
Koopman, M., Thurlings, M. C. G., & den Brok, P. J. (2019). Factors influencing students‟ proficiency development in the fraction domain : the role of teacher cognitions and behaviour. Research Papers in Education, 34(1), 14-37.
Anderson, J. R., Reder, L.M., & Simon, H.A. (2000, Summer). Applications and Misapplications of Cognitive Psychology to Mathematics Education. Texas Educational Review.
Askew, M., Brown, M., Rhodes, V., Wiliam, D., & Johnson, D. (1997, September). Effective teachers of numeracy in primary schools: Teachers’ beliefs, practices and pupils’ learning. Paper presented at British Educational Research Association Annual Conference. York, UK: University of York. Available retrieved from: http://www.leeds.ac.uk/educol/documents/000000385.htm
Ball, D. L., Thames, M. H., & Phelps, G. (2008). Content knowledge for teaching: What makes it special?
Journal of Teacher Education,59(5), 389–407.
Behr, M. J., Wachsmuth, I., Post, T. R., & Lesh, R. (1984). Order and equivalence of rational numbers: A clinical teaching experiment. Journal for Research in Mathematics Education, 15(5), 323-341.
Charalambous, C. Y., Delaney, S., Hsu, H.-Y., & Mesa, V. (2010). A comparative analysis of the addition and subtraction of fractions in textbooks from three countries. Mathematical Thinking and Learning, 12,
117–151.
Charalambous, C. Y. & Praetorius, A.-K. (2018). Studying mathematics instruction through different lenses: Setting the ground for understanding instructional quality more comprehensively. ZDM, 50(3), 355-366. Creemers, B. P. M., & Reezigt, G. J. (1996). School level conditions affecting the effectiveness of instruction.
School Effectiveness and School Improvement, 7(3), 197–228.
Gallagher, M. A. (2016). Mathematics teacher effectiveness: Profiles of practice and teacher knowledge predicting student growth. (Unpublished doctoral dissertation) George Mason University, Fairfax, VA. Hart, K. (1981). Fractions. In K. Hart, M. L. Brown, D. E. Küchemann, D. Kerslake, G. Ruddock, & M.
McCartney (Eds.) Children’s Understanding of Mathematics: 11-16 (pp. 66-82). London, UK: John Murray.
Hiebert, J., Carpenter, T. P., Fennema, E., Fuson, K. C., Wearne, D., Murray, H., … Human, P. (1997). Making sense: Teaching and learning mathematics with understanding. Portsmouth, NH: Heinemann.
Hill, H. C., Blunk, M. L., Charalambous, C. Y., Lewis, J. M., Phelps, G., Sleep, L., & Ball, D. L. (2008). Mathematical Knowledge for Teaching and the Mathematical Quality of Instruction: An exploratory study. Cognition and Instruction, 26(4), 430–511.
Hill, H. C., & Charalambous, C. Y. (2012). Teacher knowledge, curriculum materials, and quality of instruction: Lessons learned and open issues. Journal of Curriculum Studies, 44(4), 559–576.
Hill, H. C., Umland, K., Litke, E., & Kapitula, L. R. (2012). Teacher quality and quality teaching : Examining the relationship of a teacher assessment to practice. American Journal of Education, 118(4), 489-519. Houtveen, A. A. M., Van de Grift, W. J. C. M., & Creemers, B. P. M. (2004). Effective school improvement in
mathematics. School Effectiveness and School Improvement, 15(3–4), 337–376.
Kirschner, P.A., Sweller, J., & Clarke, R.E. (2006). Why minimal guidance during instruction does not work: An analysis of the failure of constructivist, discovery, problem-based, experimental, and inquiry-based learning. Educational Psychologist, 41(2), 75-86.
Lamon, S. J. (2012). Teaching fractions and ratios for understanding: Essential content knowledge and instructional strategies for teachers. New York, NY: Routledge.
Learning Mathematics for Teaching Project (2010). Measuring the mathematical quality of instruction. Journal of Mathematics Teacher Education,14(1), 25–47.
Muijs, D., Kyriakides, L., van der Werf, G., Creemers, B., Timperley, H., & Earl, L. (2014). State of the art teacher effectiveness and professional learning. School Effectiveness and School Improvement, 25(2), 231–256.
Nickson, M. (2000). Teaching and Learning Mathematics: A Guide to Recent Research and its Applications (2nd ed.). London, UK: Continuum.
Norusis, M. J. (2011). IBM Statistics 19 Advanced Statistical Procedures Companion. Retrieved August 8, 2014 from http://www.norusis.com/pdf/SPC_v13.pdf
Pastor, D. A., Barron, K. E., Miller, B. J., & Davis, S. L. (2007). A latent profile analysis of college students‟ achievement goal orientation. Contemporary Educational Psychology,32(1), 8–47.
Sammons, P., Hillman, J., & Mortimore, P. (1995). Key characteristics of effective schools: A review of school effectiveness research. London, UK: Office for standards in education.
Sfard, A. (1991). On the dual nature of mathematical conceptions: Reflections on processes and objects as different sides of the same coin. Educational Studies in Mathematics,22(1), 1–36.
Torbeyns, J., Schneider, M., Xin, Z., & Siegler, R. S. (2015). Bridging the gap: Fraction understanding is central to mathematics achievement in students from three different continents. Learning and Instruction,37, 5– 13.
Author Information
Marieke Thurlings
Eindhoven University of Technology, Eindhoven School of Education
De Zaale, Eindhoven The Netherlands
Contact e-mail: [email protected]
Maaike Koopman
Eindhoven University of Technology, Eindhoven School of Education
De Zaale, Eindhoven The Netherlands
Perry den Brok
Wageningen University & Research, Social Sciences Group
P.O. Box 8130, Wageningen The Netherlands
Birgit Pepin
Eindhoven University of Technology, Eindhoven School of Education